Adsorption Behavior of Waste Leaves of Quercus Leucotrichophora for the Removal of Ni2+ and Cd2+ Ions from Waste Water
Naveen Chandra Joshi* , Vaishali Rangar, Ruchi Sati, Ekta Joshi and Ajay Singh
Department of Chemistry, Uttaranchal University Dehradun, India.
Corresponding Author E-mail: drnaveen06joshi@gmail.com
DOI : http://dx.doi.org/10.13005/ojc/350212
Article Received on : 07-03-2019
Article Accepted on : 04-04-2019
Article Published : 20 Apr 2019
Recently, the heavy metals are known for their toxicity to living organisms and natural environment. In the present study, we have removed Ni2+ and Cd2+ ions from synthetically prepared waste water under batch experiments using the waste leaves of Quercus leucotrichophora as low cost adsorbents. The adsorbent was characterized by FTIR and FESEM methods and the batch experiments included contact time, pH, dosage, temperature and concentration. The adsorption of metal ions was found maximum at the optimized conditions such as contact time 60 minutes, dosage 1 g, pH 5 and lower metal ion concentrations. The percentage adsorption at contact time 60 minutes, dosage 1 g and pH 6 was found 50.2, 51.0 and 74.0% for nickel and 38.8, 29.9 and 70.1% for cadmium. The adsorption data under selected batch system have been tested with Langmuir, Freundlich isotherm models, pseudo first order and pseudo second order kinetic models. Langmuir isotherm model and pseudo first order kinetic model were best fitted to adsorption of nickel and cadmium onto waste leaf powder of Quercus leucotrichophora.
KEYWORDS:Analytical Methods; Batch System; Heavy Metals; Isotherms; Kinetics
Download this article as:| Copy the following to cite this article: Joshi N. C, Rangar V, Sati R, Joshi E, Singh A. Adsorption Behavior of Waste Leaves of Quercus Leucotrichophora for the Removal of Ni2+ and Cd2+ Ions from Waste Water. Orient J Chem 2019;35(2). |
| Copy the following to cite this URL: Joshi N. C, Rangar V, Sati R, Joshi E, Singh A. Adsorption Behavior of Waste Leaves of Quercus Leucotrichophora for the Removal of Ni2+ and Cd2+ Ions from Waste Water. Orient J Chem 2019;35(2). Available from: https://bit.ly/2V68bj5 |
Introduction
Heavy metals are recently known for their hazardousness to all living organisms and natural environment. Due to industrialization and urbanization, the problems related to heavy metals have become a major issue in the world. The common heavy metal contaminants are lead (Pb), cadmium (Cd), mercury (Hg), chromium (Cr), nickel (Ni), copper (Cu), arsenic (As) and zinc (Zn). Such contaminants are not biodegradable and remain persistent in the nature for a long time.1 Some of heavy metals are beneficial for daily vital activities in the living organisms under the concerned limits but many of them are definitely harmful even at very low concentrations. In human, heavy metal are deposited in tissues and organs through drinking water and food chains.2 Nickel is an essential element in the metabolic pathways in human and other organisms but beyond the limits, nickel is a potential toxicant and carcinogen. The toxicity of nickel (Ni) depends on the way of exposure, concentration and solubility of nickel compounds in water. It causes nausea, vomiting, respiratory problems, weakness and gastrointestinal distress.3-7 Cadmium (Cd) is a non-essential element and enters the water bodies through industrial processes like electroplating, metallurgical, pigments, batteries, plastic, ceramics, alloying etc. It causes lung damage, hepatic injury, hypertension and renal dysfunction.8-14
The commonly used methods for the removal of heavy metals from water and waste water are precipitation, electro-winning, reverse osmosis, membrane filtration, ultrafiltration and adsorption. The adsorption based removal of heavy metals utilizing a low cost and readily available adsorbent is a better alternative over the all conventional methods.2,15 The characteristics of this technique are excellent efficiency, low cost, simple, no much additional charges for the operation, minimization of chemicals and prevention of harmful chemical wastes. Using any biomaterial, the adsorption process depends on physic-chemical interactions, complexation and chelation of metal ions with the different functional groups present on the surface of adsorbents.16 The main functional groups that bind with metal ions are COO–, OH–, SO4—, PO4— and amino groups.17-20 The plant Quercus leucotrichophora is abundantly found in mid-elevational central Himalayas. It is medium or large broad tree have leathery dull green leaves. The waste leaves of the plant were collected from the Kumaun region of Uttarakhand (India).
Material and Methods
Preparation of Adsorbent and Waste Water
All the chemicals used in the experiment were of analytical grades and glassware and bottles firstly washed with double distilled water and then dried. The collected waste leaves were washed with double distilled water and dried for 3-4 days in the laboratory. Now, leaves carefully heated under controlled conditions at the temperature between 65-700C in a tray dryer for removing the moisture from the leaves. The well dried leaves were sieved in particle size 0.125 mm and preserved in air tight bottles. The leaf powder was characterized by FT-IR and FESEM methods. Stock solution of waste water containing 1g/l of Ni++ and Pb++ ions was prepared by dissolving cadmium acetate Cd (CH3COO)2 and nickel sulphate NiSO4 in deionized water and the pH of this solution maintained 4 using a digital pH meter. All working solution with different concentrations and pH were prepared by diluting the stock solution. The pH of all solutions has been maintained by using 0.1N HCl and 0.1N NaOH.
Adsorption Study
The adsorption study has carried out under the batch system and the parameters included contact time, temperature, pH, concentration and dosage. For that, a requisite amount of adsorbent treated with a desired working solution at a constant shake 200 rpm. After that, the content filtered and metal ion concentrations have been determined in the filtrate by using Atomic Absorption Spectroscopy, AAS (Model Thermo Fisher Scientific Model AA301). The parameters contact time 10-70 minutes, pH 2-6, concentration 10-50 mg/l, dosage 0.2-1.0g and temperature 10-600C have been applied for the batch operation. The percentage removal or adsorption is calculated by using the formula:
![]()
Where Co and Ce are the metal ion concentrations before and after adsorption.
Results and Discussion
Characterizations of Adsorbent
Fourier transform spectroscopy is used to collect high resolution data over a wide spectral range. This spectroscopy is based on interference of electromagnetic radiation and explains the presence of different functional groups on the surface of adsorbents. These groups generally participate in the interactions with metal ions; FT-IR spectra of adsorbent of the leaf powder are obtained in the range 4000 to 500 cm-1 (Fig.1). The broad peaks obtained at 3450 cm-1, 3030cm-1, 2950cm-1, 1630 cm-1, 1540 cm-1, 1010 cm-1 and 750 cm-1 indicates the presence of groups such as –OH, -NH, -C-H (aromatic), =C-H, C=O, C=C, C-C etc on the adsorbent surface. The Field Emission Scanning Electron Microscope (FESEM) observes the morphological behaviour of adsorbent’s particles. This technique is applied for the small particles (nano-scale) and provides topographical and elemental at magnifications of 10x to 3000,000x. Field-emission Scanning Electron Microscope works with electrons and these electrons releases by a field emission source. The electrons are focussed and deflected by electronic lenses and a smooth beam bombards the object. A well-defined shape of adsorbent’s particles before the adsorption is shown in the figure 2 and their modifications after adsorption is well observed in figure 3.
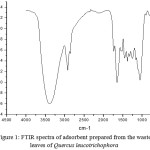 |
Figure 1: FTIR spectra of adsorbent prepared from the waste leaves of Quercus leucotrichophora.Click here to view figure |
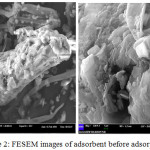 |
Figure 2: FESEM images of adsorbent before adsorption.Click here to view figure |
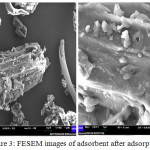 |
Figure 3: FESEM images of adsorbent after adsorption. |
Adsorption Study
Effect of Contact Time, Dosage and pH
For the initial removal of metal ions, a minimum time is necessary for the interactions of metals ions with adsorbents. The percentage adsorption of nickel and cadmium is found 8.19 and 19.82% after contact time 10 minutes. The adsorption of these metals increases with the contact time from 10 to 60 minutes (Fig.4a) but after 60 minutes it becomes constant due to occupation of all binding groups by metal ions1. The percentage removal 26.90 and 13.49% is found at contact time 20 minutes for Ni++ and Cd++ ions; it increases very sharply to 50.2 and 38.8% at contact time 60 minutes and after that it becomes constant1,6. The adsorption of Ni++ and Cd++ ions also increases with the amount of adsorbent from 0.2 to 1 g due to availability of more and more binding sites for the physical and chemical interactions; initially it is found 9.61 and 3.9% for Ni++ and Cd++ ions at dosage 0.2 g (Fig. 4b). At 0.6 g, the adsorption is found 39.7 and 16.8% for Ni++ and Cd++ ions and the maximum adsorption efficiency is observed 51 and 29.9% for Ni++ and Cd++ ions at 1g of adsorbent1. The most important parameter for the adsorption is the pH of working solutions; usually at lower acidic pH, the adsorption is found minimum (Fig.5a) due to the protonation of organic binding groups and a repulsion between such groups and positively charged metal ions.22 The availability of electron bearing or negatively binding groups is more at higher acidic pH values. The removal or adsorption efficiency for Ni++ and Cd++ ions is found 18.1 and 20.2% and then it increases very efficiently to 74 and 70.1% at pH 6.
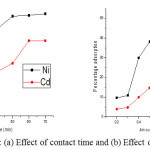 |
Figure 4: (a) Effect of contact time and (b) Effect of dosage.Click here to view figure |
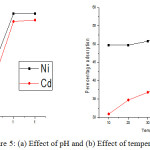 |
Figure 5: (a) Effect of pH and (b) Effect of temperature. |
Effect of Temperature and Concentration
The adsorption of metal ions on the surface of adsorbent increase with the applied temperatures in batch operation but after a certain temperature it becomes constant or decreases due to dissolution of metal ions in the working solution from the adsorbents (Fig. 5b).23 At initial temperature 10°C, the percentage adsorption is observed 49.7 and 30.9 % for Ni++ and Cd++ ions and increases to 57.4 and 41.4 % at 50°C and after that it becomes constant. The adsorption process is also depending on the variation of concentration, the amount of metal ions adsorbed per gram of adsorbent increases with the concentration (Fig. 5b) but the efficiency of adsorption decreases; it may due to the evolution of a motive force of concentration variations.19,24 At 10 mg/l, 3.61 and 1.99 mg/g Ni++ and Cd++ ions have been and removed and increased to 5.39 and 3.14 mg/g at 50 mg/l (Fig. 6a).
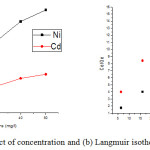 |
Figure 6: (a) Effect of concentration and (b) Langmuir isotherm model. |
Isotherm and Kinetic Models
Langmuir and Freundlich Model
Langmuir isotherm model is related to the single layer adsorption of metal ions on a homogeneous surface containing a finite number of active or binding groups. It is also useful in the determination of binding capacities of adsorbents1. All constants of this model have been calculated by using the following linear form of the equation:
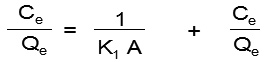
Where; K1 and A are the adsorption capacity (mg/g) and rate of adsorption (L/mg); Qe and Ce are the amount of metal ions absorbed on the adsorbent’s surface and equilibrium concentration. The values of K1 and A have been calculated as 5.995 mg/g and 1.001 L/mg for nickel and 3.711 mg/g and 1.111 L/mg for cadmium from the graph Ce/Qe vs Ce (Fig. 6b). The values of regression (R2) are found 0.927 for nickel and 0.9743 for cadmium indicating a favorable mono layer adsorption (Table 1)21. The characteristic dimensionless factor of Langmuir model i.e. RL can be mathematically defined as:
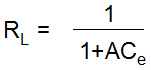
Where; A is the rate of adsorption (L/mg) and Ce is equilibrium constant (mg/l). The values of RL are found less than one in all cases of initial metal ion concentrations. It also indicates a favorable adsorption of metal ions on the homogeneous surface of adsorbent. The Freundlich isotherm model is concerned with the adsorption of metal ions on a heterogeneous surface and explains the adsorption of metal ions from diluted solutions.21 A linear form of Freundlich model is given as below:
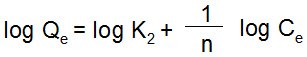
Where; K2 and 1/n are the Freundlich constant related to adsorption capacity and adsorption intensity and their values have been calculated as 2.382 mg/g and 0.2012 for nickel and 1.174 mg/g and 0.2538 for cadmium from the graph log Qe vs log Ce (Fig. 7a). Qe and Ce are the amount of metal adsorbed per gram of adsorbent and equilibrium concentration (mg/l).
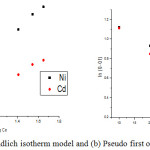 |
Figure 7: (a) Freundlich isotherm model and (b) Pseudo first order kinetic model.Click here to view figure |
Pseudo-First and Pseudo-Second Order Model
The kinetic study of adsorption explains very clearly the rate of adsorption in a batch operation. It also helps in the designation of optimized conditions for a significant metal ion removal.25 Lagergren’s pseudo first order kinetic model6 is mathematically represented as below:
In (Q-Qt) = In Q – Kf t
Where’ Q and Qt are the amount of metal adsorbed at equilibrium in mg/g and at time t; kf is the rate constant in min-1. The value of kf is calculated as -0.027 and -0.0262 min-1 for nickel and cadmium from the graph ln (Q-Qt) (Fig. 7b). A high regression value (R2) for nickel and cadmium indicates better applicability of pseudo first order kinetic model (Table 1). Pseudo second order model is related to the dependency of adsorption rate on the unoccupied binding sites.23 It is mathematically represented as below:
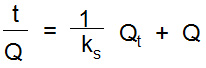
Where’ ks is the pseudo second order rate constant in g/mol min; its values have been calculated as 0.269 and 0.0867 g/mol min for nickel and cadmium. The regression value (R2) found 0.9606 for nickel and 0.8731 for cadmium which indicated the better applicability of pseudo second order model for nickel (Table 1).
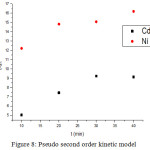 |
Figure 8: Pseudo second order kinetic model. |
Table 1: Isothermal and kinetic parameters.
|
Models |
Metals |
Parameters |
Values |
|
Langmuir |
Ni |
K1 (mg/g) |
5.995 |
|
A (L/mg) |
1.001 |
||
|
R2 |
0.9727 |
||
|
Cd |
K1 (mg/g) |
3.711 |
|
|
X (L/mg) |
1.111 |
||
|
R2 |
0.9743 |
||
|
Freundlich |
Ni |
K2 (mg/g) |
2.382 |
|
1/n |
0.2012 |
||
|
R2 |
0.8905 |
||
|
Cd |
K2 (mg/g) |
1.174 |
|
|
1/n |
0.2538 |
||
|
R2 |
0.8906 |
||
|
Pseudo first order |
Ni |
Kf |
-0.027 |
|
R2 |
0.998 |
||
|
Cd |
Kf |
-0.0262 |
|
|
R2 |
0.991 |
||
|
Pseudo second order |
Ni |
KS |
0.269 |
|
R2 |
0.9606 |
||
|
Cd |
KS |
0.0867 |
|
|
R2 |
0.8731 |
Conclusion
The leaves of Quercus leucotrichophora have been found good adsorbents for the removal of nickel and cadmium from synthetic waste water. The observed optimized conditions like contact time 60 minutes, adsorbent dosage 1 g, pH 5 and lower metal ion concentrations can be used for maximum removal of nickel and cadmium under batch conditions. The adsorption capacity of adsorbent is much good for nickel than cadmium. Langmuir isotherm model and pseudo second order kinetic models are best fitted in the equilibrium data of adsorption.
Ackowledgements
We are thankful to Department of Chemistry, Uttaranchal University Dehradun (India) for providing all facilities during the experimental works.
Conflict of Interest
The authors declare no conflict of interest.
References
- Joshi, N. C.; Singh, A.; Rajput, H. Orient. J. Chem.,2018, 34, 2548-2553.
- Joshi, N. C. Europ. J. Pharm. Med. Res., 2017, 4, 388-394.
- Uthus, E. O.; Seaborn, C. D. Journal of Nutrition, 1996, 126, 2452–2459.
- Watt, R. K.; Ludden, P. W. Cellular and Molecular Life Sciences, 1999, 56, 604–625.
- Maleva, M. G.; Nekrasova, G. F; Malec,P.; Prasad, M. N. V.; Strzałka, K. Chemosphere, 2009, 77, 392–398.
- Manjuladevi, M.; Anitha, R.; Manonmani, S. Appl. Water Sci., 2018, 8, 36-44.
- Yous, R.; Mohellebi, F.; Cherifi, H. Korean J. Chem. Eng., 2018, 35, 890-899.
- Ahmedna, M.; Marshall, W.E.; Husseiny, A.A.; Rao, R.M.; Goktepe, I. Water Res., 2004, 38, 1062–1068.
- Volesky, B. Biosorption of Heavy Metals, CRC Press, Boca Raton., 1990
- Lo, W.; Chua, H.; Lam, K.H.; Bi, S.P. Chemosphere, 1999, 39, 2723–2736.
- Davis, T.A.; Volesky, B.; Vieira, R. H. S. F. Water Res., 2000, 34, 4270–4278.
- Hajialigol, S.; Taher, M.A.; Malekpour, A. Ads. Sci. Technol., 2006, 24, 487–496.
- Tang, Q.; Zhou, T.; Gu, F.; Wang, Y.; Chu, J. M. J. Cent. South Uni., 2017, 24, 1941-1945.
- Cao, Y.; Zhang, S.; Wang, G.; Xu, X. Environ. Sci. Pollut. Res., 2017, 24, 8525-8533.
- Joshi, N. C. J. Pharm. Chem. Biol. Sci., 2017, 5, 330-336.
- Zafar, M. N.; Nadeem, R.; Hanif, M. A. J. Hazard. Mater., 2007, 143, 478-485.
- Joshi, N. C. R.J.L.B.P.C.S. 2018, 4, 59-69.
- Joshi, N. C.; Bhandari N. S.; Kumar, S. Envir. Sci. An Indian J., 2011, 6, 148-153.
- Joshi, N. C.; Singh, A. J. Pharm. Chem. Biol. Sci., 2018, 6, 329-334.
- Bhandari, N. S.; Joshi, N. C.; Kumar, S. Envir. Sci. An Indian J., 2011, 6, 75-79.
- Bhandari, N. S.; Joshi, N. C.; Shah G. C.; Kumar, S. J. Indian Chem. Soc., 2012, 89, 383-387.
- Ho, Y. S.; Mckay, G. 1999, 34, 451-465.
- Joshi, N. C.; Bahuguna, V. Rasayan J. Chem., 2018, 11, 142-150.
- Joshi, N. C. J. Pharm. Chem. Biol. Sci., 2017, 5, 330-336.
- Kumar, M.; Singh, A. K.; Sikandar, M. Appl. Water Sci., 2018, 8, 225-236.

This work is licensed under a Creative Commons Attribution 4.0 International License.
![]()
A New Edition of Web of Science
Journal Impact Factor
2022: 0.5
Five Year: 0.8
Journal is Indexed in

Cabells Whitelist
![]()


