A Rapid Spectrophotometric Method for Quantitative Determination of Ethanol in Fermentation Products
Malinee Sriariyanun1, Parita Mutrakulcharoen1, Surapun Tepaamorndech2, Kraipat Cheenkachorn3 and Kittipong Rattanaporn*4
1The Sirindhorn International Thai-German Graduate School of Engineering (TGGS), KMUTNB, Bangkok, 10800 Thailand.
2Food Biotechnology Research Unit, National Center for Genetic Engineering and Biotechnology, Pathumthani, 12120 Thailand.
3Department of Chemical Engineering, Faculty of Engineering, KMUTNB, Bangkok, 10800 Thailand.
4Department of Biotechnology, Faculty of Agro-industry, Kasetsart University, Bangkok, 10900 Thailand.
Corresponding Author E-mail: kittipong.r@ku.th
DOI : http://dx.doi.org/10.13005/ojc/350234
Article Received on : 08-01-2019
Article Accepted on : 26-03-2019
Article Published : 05 Apr 2019
A rapid and accurate assay for monitoring ethanol production is required to control the progress of fermentation in various industrial-related research and processes. In this study, a spectrophotometric assay to measure ethanol concentration in fermentative sample was developed. Ethanol in unknown aqueous solution was extracted using tri-n-butyl phosphate (TBP) and subsequently oxidized by dichromate reagent. Oxidation product of ethanol with dichromate reagent could be visualized as blue green-color. The A595 value detected by spectrophotometer and ethanol concentration between 0.7%-8.0% was plotted in linear regression with high correlation coefficiency (R2). In addition, concentration of methanol, propanol and butanol were determined as did in ethanol suggesting the broad application of this assay. Our established method was applied to commercial wine and fermentative products from yeast culture broths and the results were compared with Gas Chromatography Mass Spectrophotometry (GCMS) method. In this study, this assay was demonstrated as a cheap, rapid, and high accuracy method for determination of ethanol concentration in unknown solutions.
KEYWORDS:Alcohol; Colorimetric Method; Ethanol; Fermentation; Quantitative Determination
Download this article as:| Copy the following to cite this article: Sriariyanun M, Mutrakulcharoen P, Tepaamorndech S, Cheenkachorn K, Rattanaporn K. A Rapid Spectrophotometric Method for Quantitative Determination of Ethanol in Fermentation Products. Orient J Chem 2019;35(2). |
| Copy the following to cite this URL: Sriariyanun M, Mutrakulcharoen P, Tepaamorndech S, Cheenkachorn K, Rattanaporn K. A Rapid Spectrophotometric Method for Quantitative Determination of Ethanol in Fermentation Products. Orient J Chem 2019;35(2). Available from: https://bit.ly/2ONVXFW |
Introduction
Ethanol is biologically produced through the fermentation of sugars by various types of microbes or chemically produced via chemical reaction or petro-chemical processes. In Thailand, ethanol was produced and utilized as an alternative biofuel with production capacity of 1,200 billion liters in 2016. According to the government policy, the production of ethanol is targeted to be 3,240 billion liters in 2021, remarking the potential market growth of ethanol.1 Currently, ethanol is mainly obtained from fermentation of agricultural by-products, for example, molasses and cassava peels in Thailand. In addition, lignocellulosic waste obtained after harvesting seasons could be raw material for bioethanol production in industrial scale.2
In general, ethanol fermentation is considered as a slow process that normally takes 48-72 h per batch in industrial scale production. The fermentation process sometimes fails due to many reasons, for example, contamination, inconsistent quality of raw materials, failure of operational controllers, presence of fermentation inhibitors.3 Due to large scale of production in industries, one-time failure leads to big loss of expenses. Therefore, the rapid quantitative measurement method to monitor the progress of ethanol production is necessary to promptly adjust the on-going and real-time fermentation to be proper schemes.
Various techniques have been developed to determine ethanol concentration in different solutions as listed in Table 1. An ideal method for this purpose should be rapid, cheap, simple and high accuracy, high sensitivity, high repeatability. Furthermore, the method that does not require expensive instrument and well-trained personnel is primarily preferred. Gas chromatography (GC) is one of the common methods for determination of ethanol concentration in alcoholic beverages due to its accuracy, and sensitivity.4 However, this method requires expensive instrument and skilled worker for analysis. In addition, one instrument could analyze one sample at a time of analysis. Distillation is one of the selected choices for factory’s lab, although it is time-consuming, and laborious.5,6 During fermentation, the product not only contains ethanol but also other by-products for example, butanol, or volatile fatty acid that could be unspecifically detected by many methods.7 Enzymatic assay offers high specificity and sensitivity to ethanol,8 although it is relatively expensive compared to other methods.
Table 1: Comparison of different quantitative measurement methods for determination of ethanol concentration in samples.
| Methods | Sensitivity | Assay time/sample | Minimum volume of sample | Remark | References |
| Gas chromatography | 100 ppm | Approx. 5 min per sample | 1 µL | High accuracy, Expensive equipment, required high cost of sample analyses and skilled analysts | 4 |
| Gravimetric method (i.e. alcohol meter, hydrometer) | Rough | 5 min | 100 mL | Required large amount of samples and must use at reference standard condition at 20oC | 5,6 |
| Distillation method (i.e. Ebulliometer) | 2 g/L | 15 min | 50 mL | Required large amount of samples and may be interfered with the volatile acids for the result interpretration. The total suspended solid is limited. | 5,6 |
| Solvent extraction-dichromate oxidation | 0.25- 8% (v/v) | 10 min | 1.2 mL | Taking long time for extraction (1 h). | 7 |
| Enzymatic assay | 0.093 mg/L-0.1 g/L | 5 min | 10 µL | High accuracy, high cost of sample analyses, limited range of ethanol concentration. | 8 |
| Cerric Ammonium Nitrate | 0.3-3.85 % (w/v) | 10 min | 1 mL | Does not work for fermentation broths due to residual sugars. | 9 |
In most biological solutions, including fermentation broth, contains a variety of soluble and insoluble compounds. In ethanol production, the final fermented supernatant contains remaining raw materials, i.e. molasses, starch hydrolysate, and other by-products that may cross react with the assay due to their strong color.10,11 Thus, the extraction of ethanol from unknown samples is suggested to reduce cross-reactivity and other interferences. In this study, a detection assay to quantitatively determine the ethanol concentration using the modified solvent extraction and dichromate oxidation method which was developed and tested for its sensitivity to fermentation broth. GCMS analysis of ethanol was also conducted as a benchmark of this dichromate oxidation colorimetric method. Our results demonstrated that the modified solvent extraction and dichromate oxidation method was able to determine the ethanol concentration in many numbers of fermentation samples simultaneously which is suitable for research and process control applications.
Material and Methods
Spectrophotometric Method for Ethanol Concentration Determination
In spectrophotometric method, ethanol concentration was determined by solvent extraction and dichromate oxidation reaction7 with protocol modification described as follows. Firstly, ethanol in liquid sample was extracted by Tri-n-butyl phosphate (TBP, Sigma Aldrich, USA). One mL of TBP and 1 mL of aqueous sample was mixed in a microtube and then vortex vigorously for 1 min. The mixture was centrifuged at 3,420 xg for 5 min to separate into two phases. Upper phase, TBP layer, was clear and transparent, while lower phase, water later, was turbid. Then, 500 µL of upper phase was transferred to a new microtube and mixed with 500 µL of dichromate reagent (containing 10% w/v of K2Cr2O7 in 5 M of H2SO4), and vortex vigorously for 1 min. The mixture was set still for 10 min at room temperature to allow oxidation product in lower phase developed its color to blue green. One hundred microliters of the oxidation products were diluted with 900 µL of deionized water. The optical density at 595 nm (A595) of tested sample was measured in spectrophotometer (T80+ UV/Vis Spectrometer, PG Instrument Ltd., USA). The ethanol concentration in sample was estimated from the ethanol standard curve representing the relationship between A595 and the concentrations of ethanol.
GCMS Analysis of Ethanol
Standard ethanol diluted with deionized water were prepared to 0.01% – 0.5% (v/v) and 1 μl was injected into the injector port of GCMS apparatus (GCMS-QP2020, Shimadzu, Japan) equipped with auto injector (AOC-20i, Shimadzu, Japan) and DB-wax capillary column (30 m x 0.25 mm x 0.25 μm, Agilent, USA). The sample was analyzed in GCMS using helium as carrier gas and the flow rate was 1.5 mL/min. The injector temperature was 220°C with the split ratio of 40:1. The oven temperature was programmed as follows: the initial temperature was 60°C for 5 min, then ramped to 180°C at 20°C/min and held for 5 min.12 The mass spectra operating parameters were, ionization potential, 70 eV; ion source temperature; 250°C, solvent delay 1.5 min, scan range 60-350 amu, EV voltage 3,000 volts.
Yeast fermentation for ethanol production from lignocellulose hydrolysates
In this study, ethanol samples were prepared from yeast cultures grown in Modified Lignocellulose Hydrolysate (MLH) media and yeast malt (YM) media. To prepare MLH media, 1 g of dried rice straw was hydrolyzed in 40 mL of 50 mM sodium citrate buffer (pH 4.7) containing cellulase mixtures (20 FPU of Celluclast 1.5L (Sigma-Aldrich, USA) and 100 CBU of Novozyme 188 (Sigma-Aldrich, USA).13-17 The hydrolysis reaction was conducted at 45°C for 72 h in a 200 rpm shaking incubator. The supernatant of hydrolysate was collected by centrifugation at 3,420 xg for 10 min. The reducing sugars released from rice straw biomass was quantitively measured using DNS assay.18 The hydrolysate supernatant was mixed with 6 g/L yeast extract, 1 g/L KH2PO4, 0.5 g/L MgSO4.7H2O and 1 g/L glucose to be MLH media and pH was adjusted to pH 5.5.12
To grow yeast culture, Saccharomyces cerevisiae TISTR 5339 (Sc 5339) and Saccharomyces cerevisiae TISTR 5596 (Sc 5596), obtained from Thailand Institute of Scientific and Technological Research (TISTR), were inoculated in 20 mL of YM broth media (containing 5 g/L peptone, 3 g/L yeast extract, 3 g/L malt extract and 10 g/L glucose, pH 5.5) and MLH media. The yeast cultures were placed in shaker incubator at 30°C, 150 rpm for 48 h. Ethanol samples were collected from supernatant fractions by centrifugation at 3,420 xg for 10 min, and kept in -20°C until it was analyzed by spectrophotometric assay and GCMS. Each analysis was repeated at least 4 replicates.
Results and Discussion
Sensitivity of Spectrophotometric Method
In this study, an assay to determine ethanol concentration in unknown sample was conducted in two step reactions. Firstly, ethanol in aqueous solution was extracted using non-alcoholic solvent, tri-n-butyl phosphate (TBP).19 Secondly, ethanol was oxidized by chromium ions, and chromium ions were reduced from +6 oxidation state, orange color, to +3 oxidation state, blue-green color.7
To estimate the appropriate range of ethanol concentration for this assay, ethanol solutions diluted with deionized water were prepared to concentration of 0.2% to 10% ethanol. Each sample was subjected to the assay and A595 value was recorded by spectrophotometer (Fig 1.). The correlation plot between ethanol concentration and A595 was generated, and the linear regression with high correlation efficiency (R2 = 0.9948) could be observed when the ethanol concentration ranging from 0.8% – 7%. The plateau of A595 could be observed when ethanol concentration was 8% or higher. This could be the result of TBP extractability reached its limitation, or chromium ion supplies were not enough to oxidize remaining ethanol in the sample. Furthermore, when the sample volume used in this assay was reduced from 1 mL to 0.5 mL, the linear correlation was also observed similarly. This result suggested that this assay is applicable to small volume sample and suitable for screening research. Previously, the solvent extraction and dichromate oxidation method was tested in yeast culture in both microtube and a 96-deep well microplate.7 It was found that different composition of yeast culture showed different range of linear regressions of ethanol concentration, and the maximum concentration that could be estimated by this assay was 8%.7
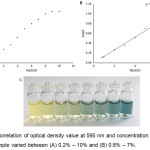 |
Figure 1: Correlation of optical density value at 595 nm and concentration of each ethanol sample varied between (A) 0.2% – 10% and (B) 0.8% – 7%. |
The color of dichromate oxidation of ethanol with different concentration ranged from 1% – 7% (from left hand to right hand). Standard deviations were calculated from four replicates of each ethanol concentration.
Specificity of Spectrophotometric Method
During ethanol fermentation by microbes, other by-products, including other alcohols, could be produced simultaneously and could interfere the color signal in the assay.11 In this section, methanol, ethanol, propanol and butanol with different concentration ranging from 0.8% – 6% were tested to evaluate the specificity of the assay. Based on the results, it indicated that our assay is compatible to different types of alcohols. Thus, this assay could be further applied to various purposes, not only for ethanol concentration determination. The correlation plots between alcohol concentration and A595 values were drawn and the linear regression trend lines were generated with high correlation coefficient (R2 > 0.9950) (Fig. 2).
Interestingly, the slopes of each alcohol were different, which may be due to the redox potential of each alcohol. Wang et al,20 studied the oxidation activity of methanol, ethanol and propanol on Pd electrode in alkaline medium. The alcohol electrooxidation activity of ethanol and propanol is higher than that of methanol suggesting that ethanol and propanol is more easily oxidized than methanol. The results in our study also agreed well to this report that the slope of ethanol and propanol were less than methanol.
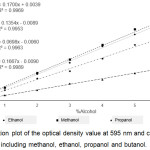 |
Figure 2: Correlation plot of the optical density value at 595 nm and concentration of alcohol samples, including methanol, ethanol, propanol and butanol. |
Standard deviations were calculated from four replicates of each alcohol concentration.
Effect of pH in Assay Accuracy
One of the target goal of this assay is for determination of ethanol concentration in fermentation broth. Practically, during the progress of ethanol fermentation, pH of broth decreases gradually until the end of process.21 Besides, the oxidation-reduction reaction, which is the key of this assay, may be affected by pH change. To investigate the effect of pH to the consistency of the assay, pH of 4% (v/v) ethanol solutions were variant adjusted between pH 1.0 – 13.0. Each sample was subjected to the assay and the A595 value was recorded by using spectrophotometer. The ethanol concentration was calculated as shown in Fig. 3 using standard curve in Fig. 1. The results showed that calculated ethanol concentration of all samples was 4.00% – 4.24% suggesting the broad compatibility of this assay at various pH of samples. The determined ethanol concentration at each pH was analyzed by ANOVA analysis to assess whether pH has effect on the assay. The obtained P-value at < 0.001 (F-value = 7.12) indicated that pH resulted in deviation of determined ethanol concentration. Also, to verify the application of this assay to fermentation aqueous products, commercial wine products with pH 3.02 (Haut-Medoc, France) containing 12% ethanol was subjected to this assay, and the calculated ethanol concentration obtained from A595 was 12.00% ± 0.08%. These results suggested that this assay also suitable for application in alcoholic beverages.
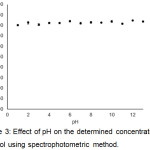 |
Figure 3: Effect of pH on the determined concentration of ethanol using spectrophotometric method. |
Comparison of Spectrophotometric Method and GCMS
The accuracy of spectrophotometric assay based on solvent extraction and dichromate oxidation was evaluated by comparing with GCMS analysis. Two yeast isolates, Sc 5339 and Sc 5596, were cultured in two types of media, MLH and YM, for ethanol production. Sc 5339 was shown to grow in pineapple core and peel hydrolysates22 and produce high ethanol yield.23 Sc 5596 was previously demonstrated to grow in sorghum straw hydrolysate with presence of lignin and produce ethanol in the strength condition.24 Therefore, these two yeast strains could utilize sugars from lignocellulose hydrolysates. In this study, MLH media is composed of rice straw hydrolysate as a main carbon source. After unpretreated rice straw was enzymatic hydrolyzed, the reducing sugar released from the reaction was quantitatively measured by DNS assay to be 4.28 mg/mL. Glucose was added into MLH media to obtain final sugar concentration at 4.75 mg/mL.
After 48 h fermentation, the supernatant fractions of Sc 5339 and Sc 5596 cultures were collected and ethanol concentrations were analyzed by spectrophotometric assay and GCMS analysis. The calculated ethanol concentrations of 4 yeast cultures, Sc 5339 and Sc 5596 grown in YM and MLH media, obtained from GCMS analysis were less that that obtained from spectrophotometric assay for 0.034% – 0.063% (Fig 4). This result suggested that spectrophotometric assay could be used to quantitative determine ethanol concentration with minor difference from GCMS analysis. This difference of the determined ethanol concentration obtained from two methods was evaluated by using two-tailed T-test. The results showed that P-values of Sc 5596, Sc 5339, H-Sc 5596, H-Sc 5339 were 0.0159, 0.0657, 0.0042, 0.0285, respectively. Thus, with criteria of P-value at 0.05, the determined ethanol concentrations of Sc 5339 samples that obtained from spectrophotometric assay and GCMS analysis were not statistically different.
The ethanol concentration measured by using spectrophotometric assay of Sc 5339 and Sc 5596 grown in YM were 0.704% and 0.788%, and Sc 5339 and Sc 5596 grown in MLH were 0.666% and 0.727%, respectively. Comparing between two types of media, both yeast strains showed that they produced ethanol with little higher yield in YM media than MLH. For example, ethanol yield in Sc 5339 that was grown in YM was higher than in MLH for 0.038%. While, the carbon source concentration in YM (13 g/L) is much higher than MLH (4.75 g/L) suggesting that these two yeast strains have good ability to grow and produce ethanol in lignocellulose hydrolysate media.
Interestingly, all of ethanol concentrations obtained from spectrophotometric assay were higher than that obtained from GCMS analysis. Based on previous studies, the dichromate oxidation reaction could cross-react with several types of alcohols, and the results in Fig. 2, also agreed well with it. However, GCMS analysis of these fermentation broths could detect only ethanol, suggesting that the difference of both methods was not due to cross-reactivity. Yeast fermentation broth of YM and MLH media contained yeast extract, peptone, glucose, malt extract, lignin, and unknown components in lignocellulose hydrolysates. These chemicals have their own intrinsic colors that cause interference in final color of oxidation reaction detected by spectrophotometer. Therefore, it suggested that the extraction step by TBP was a crucial step for this assay to remove false signal of the tested sample.
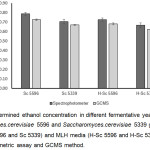 |
Figure 4: Determined ethanol concentration in different fermentative yeast cultures of Saccharomyces.cerevisiae 5596 and Saccharomyces.cerevisiae 5339 grown in YM media (Sc 5596 and Sc 5339) and MLH media (H-Sc 5596 and H-Sc 5339) using spectrophotometric assay and GCMS method. |
Conclusion
In this study, the solvent extraction and dichromate oxidation method to quantitative determine ethanol concentration in fermentation broth was developed and tested for its sensitivity and specificity. In addition, this method required small volume of samples (0.5-1.0 mL) with less than 20 min/sample and many samples could be analyzed at the same time in one batch. It did not require expensive equipment, chemicals and skilled analysts. It is useful for process monitoring and optimization for improvement of ethanol fermentation because it can handle many samples in the same time in one batch. Here, this method was validated to show its applications in alcoholic beverages and fermentation broths containing lignocellulosic hydrolysates.
Acknowledgements
The authors would like to thank King Mongkut’s University of Technology, North Bangkok (Research Grant Contract No. KMUTNB-61-GOV-03-47) and Kasetsart University Research and Development Institute (KURDI) at Kasetsart University for financial supports of this work.
Conflict of Interest
There is no conflicts of interest.
References
- Office of the Cane and Sugar Board (OCSB), Ministry of Industry, Thailand. 2017, www.ocsb.go.th.
- Rodiahwati, W.; Sriariyanun, M. KMUTNB Int J Appl Sci Technol. 2016, 9, 289-298
- Nigam, P.S.; Singh, A. Prog. in Energy and Combust Sci. 2011, 37, 52-68.
- Stackler, B.; Christensen, E.N. Amer. J. Enol. Viticult. 1974, 25, 202-207.
- AOAC Official Method of Analysis. In Official Methods of Analysis of AOAC International. 15th edition. 1990, 739-750.
- Amerine, M.A. Wine and Must Analysis. John Wiley & Sons, New York. 1974, 121
- Seo, H.B.; Kim, H.J.; Lee, O.K.; Ha, J.H.; Lee, H.Y.; Jung, K.H. J. Ind. Microbiol. Biotechnol. 2009, 36, 285-292.
- Caudy, A.A. Cold Spring Harb Protoc. 2017, 9, pdb prot089102.
- Reid, W.V.; Truelove R.K. Analyst. 1952. 77, 325-328.
- Sayyad, S.F.; Chaudhari, S.R.; Panda, B.P. Pharmaceutical and Biological Evaluation. 2015, 2, 204-207.
- Sumbhate, S.; Nayak, S.; Goupale, D.; Tiwari, A.; Jadon, R.S. J. Anal.Tech. 2012, 1, 1-6
- Rattanaporn, K.; Tantayotai, P.; Phusantisampan, T.; Pornwongthong, P.; Sriariyanun, M. Bioprocess Biosyst. Eng. 2018, 41, 467-477.
- Sriariyanun, M.; Yan, Q.; Nowik, I.; Cheenkachorn, K.; Phusantisampan, T.; Modigell, M. Kasetsart Journal -Natural Science. 2015, 49, 146-154.
- Amnuaycheewa, P.; Hengaroonprasan, R.; Rattanaporn, K.; Kirdponpattara, S.; Cheenkachorn, K.; Sriariyanun, M. Industrial Crops and Products. 2016, 84, 247-254.
- Amnuaycheewa, P.; Rodiahwati, W.; Sanvarinda, P.; Cheenkachorn, K.; Tawai, A.; Sriariyanun, M. KMUTNB Int J Appl Sci Technol. 2017, 10, 107-117.
- Junnienkul, N.; Douzou, T.; Yasurin, P.; Asavasanti, S.; Sriariyanun, M. 2018. KMUTNB Int J Appl Sci Technol. 2018, 11, 199-207.
- Cheenkachorn, K.; Douzou, T.; Roddecha, S.; Tantayotai, P.; Sriariyanun, M. 2016. Energy Proc. 2016, 100, 160-165.
- Miller, G., 1959. Anal. Chem. 1959, 31, 426-428.
- Offeman, R.D.; Stephenson, S.K.; Robertson, G.H.; Orts, W.J. Ind Eng Chem Res. 2005. 44, 6789–6796.
- Wang, D.; Liu, J.; Wu, Z.; Zhang, J., Su, Y.; Liu, Z.; Xu, C. 2009. Electrooxidation of methanol, ethanol and 1- propanol and Pd electrode in alkaline medium. Int. J. Electrochem. Sci. 2009, 4, 1672-1678.
- Mohd Azhar, S.H.; Abdulla, R.; Jambo, S.A.; Marbawi, H.; Gansau, J.A.; Mohd Faik, A.A.; Rodrigues, K.F. Biochem Biophys Rep. 2017, 10, 52-61.
- Soontornchaiboon, W.; Chunhachart, O.; Pawongrat, R. KKU Res. J. 2016, 21, 347-355.
- Laopaiboon, L.; Nuanpeng, S.; Srinophakun, P.; Klanrit, P.; Laopaiboon, P.; Biotechnology. 2008, 7, 493-498.
- Jutakridsada, P.; Ladadok, C.; Kamwilaisak, K. Adv. Mater. Res. 2014, 931-932, 188-193.

This work is licensed under a Creative Commons Attribution 4.0 International License.
![]()
A New Edition of Web of Science
Journal Impact Factor
2022: 0.5
Five Year: 0.8
Journal is Indexed in

Cabells Whitelist
![]()


