Viscosity and Density Studies of Drugs in Aqueous Solution and in Aqueous Threonine Solution at 298.15 K
Hanaa G. Attiya, Zainab A. H. Al-Dulaimy , Kawther Ahmed Sadiq and Maida Hameed Saleem
Department of Chemistry, College of Education for Pure Science-Ibn-Al-Haitham, University of Baghdad- Baghdad, Iraq.
Corresponding Author E-mail: zainabaldialamy@yahoo.com
DOI : http://dx.doi.org/10.13005/ojc/350141
Download this article as:
![]()
Viscosities (η) and densities (ρ) of atenolol and propranolol hydrochloride in water and in concentrations (0.05 M) and (0.1 M) aqueous solution of threonine have been used to reform different important thermodynamic parameters like apparent molal volumes ϕv, partial molal volumes at infinite dilution ϕv̊, transfer volume ϕv̊(tr), the slop Sv, Gibbs free energy of activation for viscous flow of solution ΔG*1,2 and the B-coefficient have been calculated using Jones-Dole equation. These thermodynamic parameters have been predicted in terms of solute-solute and solute-solvent interaction.
KEYWORDS:Atenolol; Density; L-Threonine; Propranolol Hydrochloride; Viscosity
Introduction
Drug work in human body is known as pharmacodynamics. The efficiency of a drug depends on its bioavailability.1 The general reason of low oral bioavailability is due to low solubility of drug molecules. Sometimes, low aqueous soluble drugs require high dosages for the coveted action. Low water solubility of drugs is a serious problem for generic developments. Solubility of most drugs is having poor aqueous. Therefore, the raise of drug solubility and its oral bioavailability is a difficult function for drug evaluation process. Sometimes, some carrier molecules are added to the drugs to increase the solubility.2 Numerous of works related to volumetric and viscometric properties of drugs have been completed by many researchers.3-5 Molecular interaction (solute-solute and solute-solvent) have great importance in physical chemistry and geochemistry. Viscosity B-coefficient, partial molar volumes and apparent molar volumes are advantageous in understanding solute-solvent interactions.6,7 L-Threonine (abbreviated as Thr.) distributing polar amino acid, is an essential a-amino acids. It was discovered at last of 20 common proteinogenic amino acids with two chiral centers. 4-(2-hydroxy-3-[(1-methylethyl) amino]propoxy)benzeneacetamide is known chemically as atenolol (ATN),8 is a β1-selective (cavdio selective) adrenorecepter discount drug used for antiangina therapy to relive symptoms, get better indulgence, and an antiarrhythmic to useful check heartbeat and infections. Atenolol is also used in management of alcohol with drawl, in worry states, headache prophylaxis, increased of metabolism, and tremble.9 The drug is formal in Indian pharmacopoeia.10 Isopropyl amino-3-(1-naphthyloxy) propan-2-ol hydrochloride, is known chemically propranolol hydrochloride, is a widely used non-cardio selective beta-adrenergic antagonist and been used for myocardial infarction, arrhythmia, angina pectoris, hypertension, migraine and anxiety.11 Threonine a polar side chains and exhibits good solubility in water, the nature of solute-solute and solute-solvent interactions have been discussed in terms of the values of ϕv, ϕv̊, Sv and B-coefficient. Thermodynamic parameters play an important role in detecting the various types of interactions occurring in solution. These are useful in illustrating the nature and effect of solute in solvent, intermolecular interactions and permeation of drug across biological membranes.
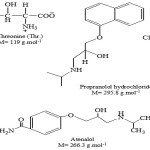 |
Scheme 1 |
Experimental
Amino acid L-threonine obtained from Fluka company is stock solution and used without any further treatment. Atenolol and propranolol hydrochloride were supplied by the state company for drugs industry were medical appliances Samarra Iraq. The viscosity (η) was determined using assuspended-level ubbelohode viscometer described by findly, in a bath controlled to ∓ 0.01 K for all measurements. Vibrating tube with digital anton parr densimeter (DMA 60 / 602) according to Shukla et al. in a thermostated bath controlled to ∓ 0.01 K used to measure densities for all solution.
Result and Discussion
The apparent molal volume (ϕv) is calculated using the following equation.12,13,14
![]()
Where and ρ˳ are the densities of solution and solvent respectively, M is molecular weight of solute and (m) is the molality of solution, m is calculated using the following relation:
![]()
Where (C) is the molar concentration. As the plots of ϕv against the molal concentration (m) were linear in the studied concentration range, standard partial molar volume ϕv̊ was obtained from the Masson equation.15
ϕv = ϕv̊+ Sv,m ………. (3)
Where ϕv̊ is the partial molal volume at infinite dilution which gives information about solute hydrophobicity also a measure of solute-solvent interaction. Sv is slop indicating solute-solute interaction. The Gibbs free energy of activation for viscous flow of solution at a given temperature and composition was measure by basing transition theory is given by equation.16
![]()
Where h is planks constant, NA is Avogadro’s number, R is the gas constant and T is the absolute temperature. Volume of mole solution, ⊽1,2 obtained from the following relation.
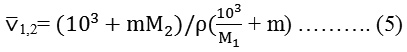
Where M2 and M1 are the molecular weight for solute and solvent respectively.
The viscosity measurements have been analyzed in terms of Jones-Dole equation.17
![]()
Where η and η˳ are the viscosities of solution and solvent respectively and C is the molarity of solution, using Jones-Dole equation, was calculated viscosity B-coefficients. The value of B depends upon the nature of solute-solvent interaction which is specific for solute-solvent system and the size of solute. The standard partial molar volume of transfer was obtained from the following relation.18
ϕv̊ (tr)= ϕv̊ (in aqueous threonine)- ϕv̊ (in water) ………. (7)
The values of ϕv̊ (tr) and Sv are listed in Table 7 and 8. The values of ϕv̊ (tr) of drugs in mixed liquids (threonine + water) are higher than those in aqueous solution, ϕv̊ (tr) are positive for all solutions studied and Sv are positive which indicates ion-ion interaction is greater than post-micellar region. The B-coefficients measure the shape effects, the size as well as the structural effect induced by solute-solvent interaction. It can be seen from Tables (1-6) that all the viscosity B-coefficients for drugs are positive, this may be understanding in expressing of the solute-solvent interaction.
Table 1: Molarity, molality, density, viscosity, apparent molal volume, Gibbs free energy of activation for viscous flow, relative viscosity and parameters of Jones-Dole coefficients of atenolol in aqueous solution at 298.15 K.
| C(mol. L-1) | M(mol. Kg-1) | ρ(gm. cm-3) | η (cp) | ϕv(cm3. mol-1) | ΔG*(J. mol-1) | ηr | Jones-Dole B-coefficient |
| 0.0000 | 0.0000 | 0.99705 | 0.89039 | – | – | – | 2.7846 |
| 0.005 | 0.0050198 | 0.99733 | 0.95941 | 200.89778 | 61005 | 1.07752 | |
| 0.006 | 0.0060244 | 0.99744 | 0.962627 | 201.90081 | 61014 | 1.08113 | |
| 0.007 | 0.0070308 | 0.99750 | 0.969056 | 202.61638 |
61031 |
1.08835 | |
| 0.008 | 0.0080368 | 0.99755 | 0.97455 | 204.406406 |
61045 |
1.09452 | |
| 0.009 | 0.0090435 | 0.99759 | 0.97874 | 206.91372 |
61057 |
1.09923 | |
| 0.01 | 0.0100506 | 0.99763 | 0.98042 | 208.919201 |
61061 |
1.10111 | |
| 0.02 | 0.020038 | 0.99810 | 1.00655 | 214.15282 | 61131 | 1.13046 | |
| 0.03 | 0.030290 | 0.99843 | 1.031864 | 220.9535 |
61198 |
1.15889 | |
| 0.04 | 0.040492 | 0.99857 | 1.05174 | 228.97696 |
61252 |
1.18121 | |
| 0.05 | 0.050744 | 0.99865 | 1.07546 | 234.99362 |
61313 |
1.20785 |
Table 2: Molarity, molality, density, viscosity, apparent molal volume, Gibbs free energy of activation for viscous flow, relative viscosity and parameters of Jones-Dole coefficients of propranolol hydrochloride in aqueous solution at 298.15 K.
| C (mol. L-1) | M (mol. Kg-1) | ρ (gm. cm-3) | η (cp) | ϕv (cm3. mol-1) | ΔG* (J. mol-1) | ηr | Jones-DoleB-coefficient |
| 0.0000 | 0.0000 | 0.99705 | 0.89039 | – | – | – | 3.5047 |
| 0.005 | 0.0050204 | 0.99742 | 1.03175 | 224.96221 | 61186 | 1.15876 | |
| 0.006 | 0.0060259 | 0.99748 | 1.034838 | 224.80140 | 61194 | 1.16223 | |
| 0.007 | 0.007032 | 0.99755 | 1.044810 | 225.04145 |
61218 |
1.173430 | |
| 0.008 | 0.0080382 | 0.99761 | 1.051738 | 226.47684 |
61235 |
1.18121 | |
| 0.009 | 0.009045 | 0.99767 | 1.05554 | 227.58442 |
61244 |
1.18548 | |
| 0.01 | 0.0100527 | 0.99772 | 1.058166 | 229.48006 |
61251 |
1.18843 | |
| 0.02 | 0.020155 | 0.99823 | 1.089348 | 237.50229 | 61329 | 1.22345 | |
| 0.03 | 0.0300420 | 0.99859 | 1.1144481 | 244.73276 |
61391 |
1.25164 | |
| 0.04 | 0.040535 | 0.99864 | 1.150704 | 256.80856 |
61477 |
1.29236 | |
| 0.05 | 0.05082 | 0.99872 | 1.179206 | 263.17909 |
61545 |
1.32437 |
Table 3: Molarity, molality, density, viscosity, apparent molal volume, Gibbs free energy of activation for viscous flow, relative viscosity and parameters of Jones – Dole coefficients of atenolol in (0.05 M) aqueous solution of threonine at 298.15 K.
| C (mol. L-1) | M (mol. Kg-1) | ρ (gm. cm-3) | η(cp) | ϕv (cm3. mol-1) | ΔG* (J. mol-1) | ηr | Jones-DoleB-coefficient |
| 0.0000 | 0.0000 | 1.01235 | 1.09357 | – | – | – | 0.1674 |
| 0.1 | 0.10333 |
1.01348 |
1.29517 | 251.8892 | 66137 | 1.18435 | |
| 0.2 | 0.20806 |
1.01450 |
1.31952 |
252.4325 |
66217 |
1.206623 | |
| 0.3 | 0.32069 |
1.01537 |
1.34275 |
253.1074 |
66295 |
1.2278651 | |
| 0.4 | 0.43981 |
1.01602 |
1.37257 |
253.9881 |
66386 |
1.25513 | |
| 0.5 | 0.56588 |
1.01673 |
1.38865 |
254.3983 |
66455 |
1.26983 | |
| 0.6 | 0.699904 |
1.01704 |
1.41917 |
255.3299 |
66544 |
1.29774 | |
| 0.7 | 0.84296 |
1.01726 |
1.43745 |
256.1226 |
66614 |
1.31446 | |
| 0.8 | 0.99473 |
1.01728 |
1.46028 |
256.9640 |
66694 |
1.33533 | |
| 0.9 | 1.15735 |
1.01731 |
1.49297 |
257.6075 |
66789 |
1.36523 | |
| 1.0 | 1.33147 |
1.01735 |
1.50993 |
258.1123 |
66859 |
1.38073 |
Table 4: Molarity, molality, density, viscosity, apparent molal volume, Gibbs free energy of activation for viscous flow, relative viscosity and parameters of Jones – Dole coefficients of atenolol in (0.1 M) aqueous solution of threonine at 298.15 K.
| C (mol. L-1) | M (mol. Kg-1) | ρ (gm. cm-3) | η(cp) | ϕv (cm3. mol-1) | ΔG* (J. mol-1) | ηr | Jones-DoleB-coefficient |
| 0.0000 | 0.0000 | 1.01458 | 1.10257 | – | – | – | 0.1759 |
| 0.1 | 0.10115 |
1.01525 |
1.31328 | 255.86944 | 66167 | 1.19111 | |
| 0.2 | 0.20777 |
1.01591 |
1.33693 |
256.26352 |
66246 |
1.21256 | |
| 0.3 | 0.32034 |
1.01639 |
1.35863 |
256.52647 |
66322 |
1.23224 | |
| 0.4 | 0.43941 |
1.01684 |
1.38817 |
256.90440 |
66412 |
1.25904 | |
| 0.5 | 0.565572 |
1.01721 |
1.40025 |
257.2887 |
66435 |
1.26999 | |
| 0.6 | 0.69971 |
1.01728 |
1.42731 |
258.0379 |
66557 |
1.29453 | |
| 0.7 | 0.84246 |
1.01731 |
1.45057 |
258.62898 |
66637 |
1.31563 | |
| 0.8 | 0.99468 |
1.01732 |
1.47854 |
259.09737 |
66724 |
1.34099 | |
| 0.9 | 1.157303 |
1.01733 |
1.52403 |
259.4657 |
66840 |
1.38225 | |
| 1.0 | 1.331434 |
1.01735 |
1.55954 |
259.9546 |
66939 |
1.41446 |
Table 5: Molarity, molality, density, viscosity, apparent molal volume, Gibbs free energy of activation for viscous flow, relative viscosity and parameters of Jones – Dole coefficients of propranolol hydrochloride in (0.05 M) aqueous solution of threonine at 298 .15 K.
| C (mol. L-1) | M (mol. Kg-1) | ρ (gm. cm-3) | η(cp) | ϕv (cm3. mol-1) | ΔG* (J. mol-1) | ηr | Jones-DoleB-coefficient |
| 0.0000 | 0.0000 | 1.01674 | 1.11425 | – | – | – | 0.2137 |
| 0.1 | 0.100985 |
1.01983 |
1.33918 | 260.53875 | 65943 | 1.20187 | |
| 0.2 | 0.207551 |
1.02278 |
1.36556 |
261.227123 |
66078 |
1.22554 | |
| 0.3 | 0.320202 |
1.02565 |
1.40066 |
261.72403 |
66128 |
1.25704 | |
| 0.4 | 0.439614 |
1.02821 |
1.41347 |
262.727004 |
66184 |
1.26854 | |
| 0.5 | 0.56655 |
1.03044 |
1.45717 |
263.98106 |
66305 |
1.30776 | |
| 0.6 | 0.70165 |
1.03261 |
1.49320 |
264.91539 |
66407 |
1.34009 | |
| 0.7 | 0.84589 |
1.03459 |
1.50444 |
265.84971 |
66468 |
1.35018 | |
| 0.8 | 0.999713 |
1.03641 |
1.56044 |
266.5829 |
66598 |
1.40044 | |
| 0.9 | 1.165999 |
1.03809 |
1.58841 |
267.60016 |
66691 |
1.42554 | |
| 1.0 | 1.34447 |
1.03959 |
1.64204 |
268.45699 |
66819 |
1.47367 |
Table 6: Molarity, molality, density, viscosity, apparent molal volume, Gibbs free energy of activation for viscous flow, relative viscosity and parameters of Jones-Dole coefficients of propranolol hydrochloride in (0.1M) aqueous solution of threonine at 298.15 K.
| C (mol. L-1) | M (mol. kg-1) | ρ (gm. cm-3) | η(cp) | ϕv (cm3. mol-1) | ΔG* (J. mol-1) | ηr | Jones-DoleB-coefficient |
| 0.0000 | 0.0000 | 1.01824 | 1.13057 | – | – | – | 0.2321 |
| 0.1 | 0.10089 |
1.02071 |
1.39121 | 266.24253 | 65999 | 1.23054 | |
| 0.2 | 0.20749 |
1.02305 |
1.40741 |
266.88177 |
66066 |
1.24487 | |
| 0.3 | 0.32037 |
1.02515 |
1.43717 |
267.88028 |
66157 |
1.27119 | |
| 0.4 | 0.44019 |
1.02701 |
1.46598 |
268.96920 |
66247 |
1.29667 | |
| 0.5 | 0.56767 |
1.02869 |
1.49854 |
269.97606 |
66343 |
1.32547 | |
| 0.6 | 0.70371 |
1.03011 |
1.52109 |
271.07243 |
66424 |
1.34542 | |
| 0.7 | 0.84935 |
1.03122 |
1.60653 |
272.27648 |
66646 |
1.42099 | |
| 0.8 | 0.99446 |
1.03221 |
1.63930 |
273.35163 |
66697 |
1.44998 | |
| 0.9 | 1.173617 |
1.03308 |
1.67062 |
274.30782 |
66794 |
1.47768 | |
| 1.0 | 1.356134 |
1.03319 |
1.69098 |
275.81896 |
66903 |
1.49569 |
Table 7: Limiting, partial molal volume, slop and partial molal volume of transfer at infinite dilution of atenolol at 298.15 K.
| Conc. | ϕv̊ | Sv | ϕv̊ (tr) (cm3. mol-1) |
| 0% | 198.8 | 732.13 | – |
| 0.05 M | 251.48 | 5.2735 | 52.68 |
| 0.1 M | 255.49 | 3.467 | 56.68 |
Table 8: Limiting, partial molal volume, slop and partial molal volume of transfer at infinite dilution of propranolol hydrochloride at 298.15 K.
| Conc. | ϕv̊ | Sv | ϕv̊ (tr) (cm3. mol-1) |
| 0% | 219.32 | 881.41 | – |
| 0.05 M | 259.94 | 6.6078 | 40.62 |
| 0.1 M | 265.49 | 7.7197 | 46.17 |
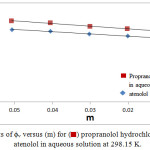 |
Figure 1: plots of ϕv versus (m) for (⬛) propranolol hydrochloride and (◊) atenolol in aqueous solution at 298.15 K. |
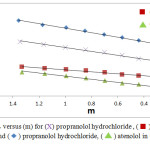 |
Figure 2: plots of ϕv versus (m) for (X) propranolol hydrochloride, (⬛) atenolol in 0.05 M threonine and (◊) propranolol hydrochloride, (Δ) atenolol in 0.1 M threonine at 298.15 K. |
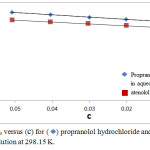 |
Figure 3: plots of ηr versus (c) for (◊) propranolol hydrochloride and (⬛) atenolol in aqueous solution at 298.15 K. |
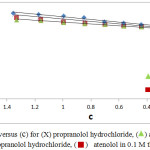 |
Figure 4: plots of ηr versus (c) for (X) propranolol hydrochloride, (Δ) atenolol in 0.05 M threonine and (◊) propranolol hydrochloride, (⬛) atenolol in 0.1 M threonine at 298.15 K. Click here to view figure |
Conclusion
The density and viscosity of atenolol and propranolol hydrochloride in water and in concentrations (0.05 M and 0.1 M) aqueous solution of threonine are measured. Different thermodynamics parameters such as ϕv̊, ϕv̊ (tr), ΔG* and viscosity B-coefficient are calculated, the results show the existence of strong solute-solvent interactions.
Acknowledgments
Author wants to show her gratitude to the University for their assistance in this work.
Conflict of Interest
On behalf of all coauthors, I certify that all of the materials in this manuscript have no financial interest or non-financial interest with any organization, person, or any entity.
References
- Vemula, V. R.; Lagishetty, V.; Lingala, S. International Journal of Pharmaceutical Sciences Review and Research. 2010. 5(1), 41-51.
- Joshi, H. A.; Dyade, D. K.; Patil, R. N. Indo American Journal of Pharmaceutical Research. 2012, 2(11), 1387-1392.
- Kumar, H.; Kaur, K. Journal of molecular Liquids. 2012, 173, 130-136.
CrossRef - Dhondge, S. S.; Zoadape, S. P.; Parwate, D. V. Journal of Chemical Thermodynamics. 2012, 48, 207-212.
CrossRef - Ryshetti, S.; Gupta, A.; Tangeda, S. J.; Gardas, R. L. Journal of Chemical Thermodynamics. 2014, 77, 123-130.
CrossRef - Aswala, S. R.; Aswale, S. S.; Hajares, S. J. Chem. Pharm. Res. 2012, 4(8), 3783-3791.
- Khanuja, P.; Chourey, V. R.; Hajares, S. J. Chem. Pharm. Res. 2012, 4(6), 3047-3050.
- The Merck Index: An Encycolopedia of Chemicals, Drugs and Biologicals, Merch and Co., Whitehouse Station, NJ, USA, 1989, 11th edition.
- Hegde, R. N.; Kumara Swamy, B. E.; Sherigara, B. S.; Nandibewoors, S. T. International Journal of Electrochemical Science. 2008. 3(3), 302-314.
- Indian Pharmacopoeia, Ministry of Health and Family, Welfare Government of India, Newdelh, 4th edition, 1996.
- British Pharmacopoeia, 30th edition, London, 1993, p. 55, 58, 370, 554.
- Karkowiak, J.; Journal of Chemical Thermodynamics. 2011, 43, 882-894.
CrossRef - Brahman, D.; Sinha, B. Journal of Chemical and Engineering Data. 2011, 56, 3073-3082.
- Brahman, D.; Sinha, B. Journal of Chemical Thermodynamics. 2014, 68, 260-269.
CrossRef - Masson, D. D. Philosophical Magazine. 1929, 8, 218-235.
CrossRef - Feakins, D.; Freemantle, D. J.; Lawrence, K. J. Chem. Soc. Faraday Trans. 1974, 1, 795.
CrossRef - Jones, G.; Dole, M. J. Am. Chem. Soc. 1929, 51, 2950-2964.
CrossRef - Sinha, B.; Sarkar, A.; Roy, P. K.; Brahman, D. International Journal of Thermodynamics. 2011, 32, 2062-2078.
CrossRef
Accepted on: 30-11-2018


ISSN Online: 2231-5039

![]()


