Thermal and Optical Properties of Polystyrene Nanocomposites Reinforced with Soot
Ali N. Sabbar1, Haider S. Mohammed2, Ahmed R. Ibrahim2 and Haider R. Saud2
1Department of Physics, College of Science, Al Muthanna University, Al Samawa City 66001, Iraq.
2Department of Chemistry, College of Science, Al Muthanna University, Al Samawa City 66001, Iraq.
Corresponding Author E-mail: asabbar84@gmail.com
DOI : http://dx.doi.org/10.13005/ojc/350159
Article Received on : 14-10-2018
Article Accepted on : 25-11-2018
Article Published : 09 Jan 2019
Heat stabilizer plays a major rule in the manufacturing of plastic products to enhance thermal properties. Carbon nanostructures (include soot) is one of the famous heat stabilizers. In the present study, different ratios of soot were blended to polystyrene (PS) using magnetic-heater stirrer and the ultrasound machine. The casting method was used to prepare the thin films of the pure and blended polystyrene. The techniques such as Fourier transform infrared spectroscopy (FTIR), thermogravimetric analysis (TGA) and UV-Visible spectrophotometer were successfully used to characterize as-prepared composites. TGA results show that the thermal stability of PS is increased significantly after the addition of soot to PS. The initial decomposition temperature (5% weight loss) of PS (229°C) is increased to 395°C when loading 5% (wt/wt) of soot. Differential thermal analysis (DTA) curves of composites represented higher temperature peak 452.23°C, and less degradation rate than virgin PS. In addition, the optical results of PS composite showed decreasing in the energy gap, values of refractive index and the real part of dielectric constant when the soot was added to PS.
KEYWORDS:Carbon Thermal Stabilizer; Optical Properties; Polystyrene; Soot; Thermal Properties
Download this article as:| Copy the following to cite this article: Sabbar A. N, Mohammed H. S, Ibrahim A. R, Saud H. R. Thermal and Optical Properties of Polystyrene Nanocomposites Reinforced with Soot. Orient J Chem 2019;35(1). |
| Copy the following to cite this URL: Sabbar A. N, Mohammed H. S, Ibrahim A. R, Saud H. R. Thermal and Optical Properties of Polystyrene Nanocomposites Reinforced with Soot. Orient J Chem 2019;35(1). Available from: https://bit.ly/2HXDkzG |
Introduction
Polystyrene (PS) has an amorphous structure, optically thermoplastic material, which is flexible as thin films. Polystyrene is a solid glass material at room temperature and is melts if heated to a temperature higher than its glass transition temperature.1,2
One of the important methods to improve thermal and optical properties of PS, is by additive fillers to the virgin polymer. Nowadays, there is a great deal of interest in the thermal stabilization of polymer, with different additives to enhancement the desired properties to the virgin polymer such as improvement of thermal properties.3 Thermal stabilizing additives are widely used in polymer industries for two reasons; firstly, during the mild manufacturing process can it protect the polymer from thermal degradation, secondly, thermal protection during the end-use of polymer in the life.4 The blending of a small amount of inorganic material to an organic polymer can enhance the performance of all properties of the polymer matrix, such as mechanical, thermal, optical, electrical and catalytic properties.5 The effect of thermal stabilizer addition on a polymer must be characterized experimentally using thermal techniques as thermogravimetric analysis (TGA) and differential scanning calorimetry (DSC).6
The consumption of black carbon in polymer industries over worldwide was more than 10 million ton in 2005, which rubber tire industry consumes about 70%, other rubber products consume approximately 20%, and 10% goes to non-rubber applications.7 Many advantages for using black carbon as a polymer filler such as mechanical reinforcement agent, light thermal stabilizer, black pigment, and UV-stabilizing agent.8,9
Incomplete combustion of paraffin candle flame or oil flame produces highly stable carbon nanoparticles (CNP).10 The nanostructure of soot shows a mixture of graphite and amorphous carbon nanoparticles with a size range of (20-50 nm) and manifested the meso-porosity with an average pore size of 7 mm.10,11 The soot particles contain a graphite structure with well-defined photoluminescence properties, and behave as indirect band-gap materials.12
González et al reported the carbon nanotubes (CNTs) increased the thermal stability of PS nanocomposite up to about 40 wt.%, when increased CNT loadings the polymer decomposition temperature decreased depending to high thermal properties of the CNTs and the morphology of nanocomposite.13 Anyway, CNTs is a good and very expansive material used to enhance the thermal stability of Ps. In the current work, the soot is used as a cheaper material and applied as nanofiller for synthesis thermal stabilized carbon polystyrene nanocomposite.
Method
Materials
Polystyrene (MwPS≈10250) and dichloromethane (≥99.8%) were purchased from CDH Laboratory Chemicals and Sigma Aldrich companies. They have used as received. Kerosene fuel was purchased from local commercial resources.
Synthesis of Soot
Soot powder was prepared using local Iraqi Kerosene fuel as following: The pottery vessels of radius 15cm placed directly above the flame for two hours. Flying smoke from the flame has accumulated on the inside wall of the pottery vessels. The soot has collected by spraying it using acetone then left to dry.
Synthesis of ST/PS
A different weight ratios of soot/polystyrene nanocomposites (which are termed SP-1 (1:100), SP-2.5 (2.5:100), SP-5 (5:100), SP-10 (10:100) SP-20 (20:100), wt (soot): wt (PS)) were synthesized by ultrasound assisted solution casting method. Firstly, five grammars of PS was dissolved in (50ml) of dichloromethane at 50ºC with the help of magnetic heater stirrer, until reaching a clear solution. Secondly, the solution has distributed in five containers. After that, different amounts of soot (0.01, 0.025, 0.05, 0.1, 0.2 gm.) were added to separate PS solutions and then applied ultrasonic frequencies (frequency 40 kHz, output power 350W) for 15 minutes to achieve better dispersion of soot. Finally, soot/polystyrene solutions were cast onto glass substrate (2.5×7) cm2 as thin films thus allowing the solvent to evaporate overnight.
Characterization
Under nitrogen atmosphere, 20 ml/min gas flow rate and 20ᵒC/min, the thermal gravimetric analysis (TGA) of polystyrene, soot and nanocomposites were done by Perkin Elmer (TGA 4000). FTIR spectrum of PS, ST and ST/PS were performed using FTIR (Shimadzu, FTIR 8400s) to determine the functional groups. The thickness of thin films is measured by optical micrometer handle gauge of coating thickness. The UV spectrophotometer (PG model T80) with bandwidth (190-1100 nm) used to determine the absorption and reflection values of prepared thin films. The absorption coefficient is determined by the absorption (A) and thickness of films (d) according the following equation14:
The value of energy gap (Eg) is calculated using the equation15,16:
(aE)m = B(E – Eg) (2)
Where B- is proportional constant depend on the type of material, – the photon energy. For allowed direct transitionm = 2 and for indirect transition m=1/2.
The refractive index values evaluated using the formula17:
Theoretically, the dielectric constant can calculate according the following equations18:
ε = εr + i εi (4)
Where,
εr = n2 –k2 (5)
εi = 2nk (6)
Results and Discussion
The FTIR spectrum of PS and SP composites shown in Fig.1, the polystyrene spectrum shows the following peaks: The peaks at range (3082 – 2850 cm-1 ) are due to stretching of C-H aliphatic and aromatic, the strong absorption band appeared at 1600 cm-1 has been assigned to C=C, whereas the peak at 1492 cm-1 is due to the C=C stretching of benzene-rings, and other PS characteristic peaks were appeared as reported in the literatures.19,20 There is no significantly change in PS characteristic peaks appeared in ST/PS-2.5 FTIR spectrum, only slightly shifts of some C-H bands. In summary, when no coupling agents were used to couple between soot and PS, the binding of soot to PS must be one of physical interaction.21
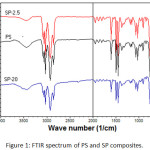 |
Figure 1: FTIR spectrum of PS and SP composites. |
TGA and DTA curves of PS and ST/PS were shown in Fig.2 and Fig.3, respectively. TGA data of ST/PS-5 showed higher initial decomposition temperature (395°C) than virgin PS (229°C), and surprisingly noticed that the loading of more soot percentages (10% wt/wt) and (20% wt/wt) to polymer didn’t enhance the stability of the thermal nanocomposite, due to the accumulations of soot particles in polymer matrix, therefore have lower influence in stopping heat than (5% wt/wt) soot ratio.22
The temperature corresponding to 10% weight loss of PS and ST/PS were in the range (370-420°C). The major weight loss (50%) was obtained over the range of (428-552°C), which correspond to the polymer structural decomposition and the fully decomposed of pure polystyrene was obtained at 470°C.
When raised the amount of ST in PS/ST, the DTA peak of maximum loss was shifted from 435.54°C to a higher temperature 452.23°C as shown in Fig.3. SP-20 DTA curve showed a higher temperature peak 452.23°C, more broad peak and less degradation rate. The result clearly explains that the decomposition of SP composites happened at higher temperatures in the presence of soot, which may have stabilized or delayed the thermal degradation of PS due to the interaction of PS with soot nanoparticles that caused the inhibition of the diffusion of the decomposed products in the nanocomposites matrix.23
Table 1: TGA and DTA data of PS (polystyrene) and SP composites.
| Material | a Max. DTA peak (°C) | b IDT (°C) | T10% (°C) | T50% (°C) | T90% (°C) | Residue (%) at 900°C |
| PS | 435.54 | 229 | 370 | 428 | 447 | 0.00 |
| SP-1% | 436.72 | 290 | 372 | 429 | 448 | 0.00 |
| SP-2.5% | 437.17 | 394 | 412 | 435 | 453 | 0.00 |
| SP-5% | 441.14 | 395 | 415 | 438 | 456 | 0.00 |
| SP-10% | 448.26 | 395 | 420 | 447 | 517 | 0.00 |
| SP-20% | 452.33 | 391 | 420 | 452 | 576 | 1.05 |
aMax. DTA peak is the max point in differential thermal analysis curve; bIDT is the initial decomposition temperatures.
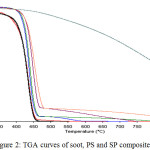 |
Figure 2: TGA curves of soot, PS and SP composites. |
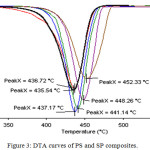 |
Figure 3: DTA curves of PS and SP composites. |
According Fig.4A, the transitions were indirect and absorption coefficient values rose with increasing soot concentration, which indicates the carbon atoms stimulate pair’s electron-holes to transit between the valence band and conduction band.24Absorption coefficient values were increased because of the increasing in the absorption of films, according Eq.1.
The energy gap (Eg) reduced with increasing concentration of nanofiller in the matrix, see Fig.4B, this is confirm, that nanocarbon atoms contribute to improved electrical conductivity.25 The refractive index (n) values reduced with increasing soot concentration, Fig.4C, because of decreasing reflection values with increasing nanofiller concentration in the matrix.26 By increasing concentration of soot, the real part of dielectric constant (ε) values are reduced too, generally for short wavelength (350 to 390 nm) a significant increase, then we noted a stable increase; while the imaginary part of dielectric constant values rose with increasing filler, Fig.4D and Fig.4E. The optical conductivity (δ) is increased with increasing soot concentration. The value of optical conductivity is not affected by the incident photon energy, see Fig. 4F.
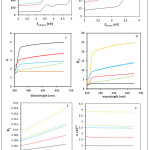 |
Figure 4: Optical properties of PS and nanocomposites: |
(A) Absorbance coefficient versus incident photon energy, (B) (αE)2 versus photon energy and Energy gap versus concentration of soot in matrix (inset), (C) Refractive index versus wavelength, (D) Real part of dielectric constant versus wavelength, (E) Imaginary part of dielectric constant versus wavelength, (F) Optical conductivity versus wavelength.
Conclusions
In summary, we have prepared thin films of soot-polystyrene nanocomposites with high thermal stability by solution blending method. The soot immobilized on molecular polystyrene matrices, have been characterized by using different techniques. The results are expected to be highly related to the association between the nanofiller ratio and the thermal & optical properties nanocomposites. We foxed on using a cheap and easily obtained resource can be alternative material for stabilizing the polymer. The results showed also that the increase in the ratio of soot increases the number of charge carriers thus the number of direct transitions. The soot contributes to reduce the energy gap, which increases the electrical conductivity of the polymer. Optical conductivity and imaginary part of dielectric constant are increased by increasing the proportion of soot in the matrix, while the values of refractive index and real part of dielectric constant are reduced.
Acknowledgments
We are thankful to the Faculty of Science / Al Muthanna University for allowing us to test the samples in the laboratory.
References
- Tuhaiwer, A. S. Inter. Lett. of Chem., Phy. & Astr. 2016, 68, 39-47.
- Ropers, S., “Bending Behavior of Thermoplastic Composite”, Springer Fach. Wies. GmbH, 2017, 5-20.
- Mekhemer, W. K.; Abou El-Ala, A. A.; El-Rafey, E. Mol. Cryst. Liq. Cryst. 2000, 354, 13–21.
- Solera, P. J. Vinyl Addit. Technol. 1998, 4, 197–210.
- Šupová, M.; Martynková, G. S.; Barabaszová, K., Sci. Adv., 2011, 3, 1–25.
- Corcione, C. E. and Frigione, M. Materials 2012 ,5, 2960–2980.
- I. W. G. on the E. of C. R. to Humans, IARC Monogr. Eval. Carcinog. Risks Hum., 2010, 94, 1-412.
- Marsh, H. and Rodríguez-Reinoso, F., “Activated Carbon (Origins),” Activated Carbon, 2006, 13–86.
- Pandey, A. K.; Kumar, R., Kachhavah, V. S.; Kar, K. K. RSC Adv. 2016, 6, 50559–50571.
- Qahtan, T. F.; Gondal, M. A.; Alade, I. O.; Dastageer, M. A. Sci. Rep. 2017, 7,1-7.
- Bake, A.; Merah, N.; Matin, A.; Gondal, M.; Qahtan, T.; Abu-Dheir, N. Prog. Org. Coat. 2018, 122, 170–179.
- Han, L.; Ghosh, D.; Chen, W.; Pradhan, S.; Chang, X.; Chen, S. Chem. Mater. 2009, 21, 2803–2809.
- Espinosa-González, C. G.; Rodríguez-Macías, F. J.; Cano-Márquez, A. G.; Kaur, J.; Shofner, M. L.; Vega-Cantú, Y. I. J. Mater. Res. 2013, 28, 1087–1096.
- Habubi, N. F.; Oboudi, S. F.; Chiad, S. S. J. Nano- Electron. 2012, 4, 1–4.
- Sabbar, A. N. ;, Talib, K. M.; Badh, H. T. MJPS 2018, 5,1–7.
- Shanshool, H. M.; Yahaya, M.; Yunus, W. M. M.; Abdullah, I. Y. Australian J. of Basic and Appl. Sci. 2015, 5,401–409.
- Mohamed, A. N.; Tuhaiwer A. S.; Razzaq, Z. S. WSN. 2016, 30, 45–56.
- Vasu, V. and Subrahmanyam, A. Thin Solid Films 1991. 202, 283–288.
- He, J.; Chen, Q.; Huang, H.; Zheng, L.; Chen, B.; Lin, J. Prog. Org. Coat. 2015, 85, 15-21.
- Ch. Chen and Ch. Lin. Oriental J. Chem., 2018, 34(1), 125-133.
- Vashist, S. K.; Schneider E. M.; Lam E.; Hrapovic S.; Luong J. H. Sci. Rep. 2014, 4, 4407, 1-7.
- Hadi A. J.; Abdulkadir, H. K.; Hadi G. J.; Bin Yusoh K.; Hasany S. F. Orient. J. Chem., 2018, 34(2), 1069-1077.
- Timochenco, L.; Grassi, V. G.; Dal Pizzol, M.; Costa, J. M.; Castellares, L. G.; Sayer, C.; Machado, R. A F; Araújo P. H H, Express Polym. Lett. 2010, 4(8), 500–508.
- Numai, T., “Fundamentals of semiconductor lasers”, Springer Ser. Opt. Sci. 2015, 93, 89–186.
- Winey, K. I.; Kashiwagi, T.; Mu. M. MRS Bulletin, 2007, 32, 348–353.
- Xi J. Q.; Schubert M. F.; Kim J. K.; Schubert E. F.; Chen M.; Lin S.; Liu W.; Smart J. A. Nature Photonics, 2007, 1, 176–179.

This work is licensed under a Creative Commons Attribution 4.0 International License.
![]()
A New Edition of Web of Science
Journal Impact Factor
2022: 0.5
Five Year: 0.8
Journal is Indexed in

Cabells Whitelist
![]()


