The Utilization of Waste Cooking Oil (WCO) as a Mixture of Polyol Sourcein the Production of Polyurethane using Toluene Diisocyanate
Maulida Lubis*1 , Mara Bangun Harahap2, Iriany1, Muhammad Hendra S. Ginting1, Iqbal Navissyah Lazuardi1 and Muhammad Amri Prayogo1
1Department of Chemical Engineering, University of Sumatera Utara, Jl. Almamater Kampus USU, Medan, 20155, Indonesia.
2Department of Physics, Faculty of FMIPA, State University of Medan, Medan, 20155, Indonesia.
Corresponding Author E-mail: Maulida@usu.ac.id
DOI : http://dx.doi.org/10.13005/ojc/350126
Article Received on : 28-11-2018
Article Accepted on : 30-12-2018
Article Published : 13 Feb 2019
Cooking oil waste that has been disposed could contamine the environment. However, if it is processed well, it can potentially become a raw material of polyurethane. The aim of this study was to determine the best polyurethane on the tensile strength, impact strength, elongation at break, water absorption, characterization of Fourier Transform Infra-Red (FTIR) and the characterization of Scanning Electron Microscopy (SEM). The variables used in this study were ambient process temperature with 440 rpm stirring speed, 1-minute stirring time, the ratio of polyoland WCO was 7:3 (% w/w), and the ratio of Toluene Diisocyanate (TDI) and WCO was 1:1; 1:2; 1:3; 1:4 (% w/w). The results obtained from the analysis of the best tensile strength against the polyurethane synthetic was in the 1:1 ratio of mixed variations between oil and TDI with a value of 0.403 MPa. The best impact strength was in the ratio of mixed variations between oil and TDI with 1:4 (% w/w) with a value of 600.975 J/m2. The best elongation at break against polyurethane foam synthetic was in the 1:3 ratio of mixture variations of oil and TDI with a value of 4.506%.
KEYWORDS:Cooking Oil Waste; Polyol; Polyurethane; Tensile Strength; Toluene Diisocyanate
Download this article as:| Copy the following to cite this article: Lubis M, Harahap M. B, Iriany I, Ginting M. H. S, Lazuardi I. N, Prayogo M. A. The Utilization of Waste Cooking Oil (WCO) as a Mixture of Polyol Sourcein the Production of Polyurethane using Toluene Diisocyanate. Orient J Chem 2019;35(1). |
| Copy the following to cite this URL: Lubis M, Harahap M. B, Iriany I, Ginting M. H. S, Lazuardi I. N, Prayogo M. A. The Utilization of Waste Cooking Oil (WCO) as a Mixture of Polyol Sourcein the Production of Polyurethane using Toluene Diisocyanate. Orient J Chem 2019;35(1). Available from: https://bit.ly/2WUwtKV |
Introduction
Cooking oil waste (COW) is a waste derived from various types of cooking oil, such as corn oil, vegetable oil, cumin oil, and other types of oil that contain much saturated fatty acids. Today, much COW has been disposes to the environment which result in a contaminated environment. Therefore, it is necessary to process COW to reduce environmental pollution. COW contains Poly Ethylene Terephtaleate (PET) compounds which can produce polyol. Polyol is an alcohol compound which has more than one -OH groups and is used as a raw material in the production of polyurethane.1
Palm oil is a good source of plant-based polyols to replace conventional polyetherpolyurethane because it has low saturation level.3,7 The source of polyol in COW has a hydroxyl value which is relatively very low; therefore, it is necessary for the addition of a source of polyol, namely Polyol FF 7119-2. Polyurethane is polymeric materials characterized with the presence of urethane functional groups (-NHCOO-) from the reaction of isocyanates and compounds which contain hydroxyl groups.3
COW with the addition of polyols contains hydroxyl groups as the source of polyol. Therefore, it can be used as the polyol source in the production of polyurethane.4 Nowadays, cooking oil in Indonesia is generally one of palm oil derivative products. Indonesia is known as the second largest producer of palm oil after Malaysia with the number of production of 13.6 million tons in 2005.5
Materials and Methods
Raw materials used in the research were COW obtained from frying waste of Giant Fried Chicken (GFC), polyol and toluene diisocyanate from CV. Indo Jaya, Belawan, Medan.
The preparation procedure of COW was COW was filtered, so that it was separated from mixed solids. After that, it was analyzed with GCMS at the Central Research Laboratory of Palm Oil, Medan.
The production procedure of polyurethane6 was to prepare COW and TDI. Firstly, the COW and TDI were mixed with a ratio of 3:7 (% w/w), then the mixture was heated while being stirred at a speed of 40 rpm above the hotplate until the temperature of 90°C. Afterwards, the mixture was cooled in an open air until the ambient temperature. Next, the mixture was combined with TDI with a ratio of 1:1; 1:2; 1:3; 1:4 (% w/w) into a 500 ml of beaker glass. After the mixture was stirred rapidly for 1 minute at ambient temperature, the mixture was formed in the mold and allowed to stand for 1 day. The polyurethane matrix was analyzed with FTIR test, SEM test, ASTM D 3039 of the tensile strength test, ASTM D 4812 – 11 of the impact test, ASTM D 3039 of the elongation at break test, and ASTM D 570 of the water absorption test.
Results and Discussion
The Characterization Result of Polyol and COW
The result obtained was a homogeneous mixture of compounds with no separate parts, and no change in color.
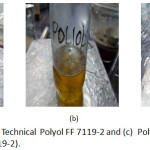 |
Figure 1: (a) COW, (b) Technical Polyol FF 7119-2 and (c) Polyol Mixture (COW and Technical PolyolFF 7119-2). |
The characterization was conducted using Gas Chromatography Mass Scpectroschopy (GC-MS) test at Central Research Laboratory of Palm Oil, North Sumatra. The characterization results of COW are presented in Table 1 and polyols in Table 2 below.
Table 1 : The characterization results of GCMS COW.
| Parameter | Percentage (%) |
| Methyl Laurate | 0,55 |
| Methyl Myristate | 1,35 |
| Methyl Palmitate | 31,79 |
| Methyl Palmitoleate | 2,45 |
| Methyl Stearate | 8,36 |
| Methyl Octadec -9- Enoate | 39,45 |
| Methyl Linoleate | 15,13 |
| Arachidic Acid Methyl Ester | 0,73 |
| Methyl 11-Eicosenoate | 0,18 |
Table 2: The Characterization results of GCMS Polyol.
| Compound | Percentage (%) |
| Metil 3-acetylpropanoate | 3,79 |
| Methyl palmitate | 53,41 |
| Methyl heptadecanoate | 3,74 |
| Methyl oleate | 33,74 |
| Octadeca-9,12-Dienoic Acid Methyl Ester | 5,31 |
The Characterization Result of Fourier TransformInfra Red (FTIR) Polyurethane
This characterization was aimed to investigate and analyse the change in functional groups and spectrum groups which were formed. The following is the results of FT-IR polyurethane.
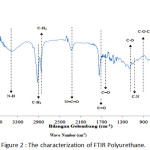 |
Figure 2: The characterization of FTIR Polyurethane. |
Figure 2 above is the result of reading by an FT-IR device of a bagasse fiber, polyurethane. The readable wavelength was adjusted to the frequency of the available wave numbers to identify the functional groups contained in the three materials.
Table 3: The Characteristics of FTIR Polyurethaneand Polyurethane Composite.
| Group | Vibration Form | Frequency of Wave Numbers | The Peak Number of Polyurethane Wave |
| N-H | AromaticAmine (stretch) | 3500-3100 | 3402.43 |
| C-H | Methyl CH3(stretch) | 3000-2850 | 2924.08 |
| Methylene CH2 (stretch) | 2935-2845 | 2924.08 | |
| N=C=O | Isocyanate | 2276-2240 | 2279.86 |
| C=O | Aromatic Ring (stretch) | 1800-1650 | 1743.64 |
| C=C | Aromatic Ring(stretch) | 1680-1620 | 1643.45 |
| C-O | Alcohol(stretching) | 1320-1210 | 1234.44 |
| C-N | Aromatic Amine | 1360-1150 | 1165 |
| C-O-C | Ether (C-O stretch) | 1150-1050 | 1095.56 |
Figure 2 is the result of reading by FT-IR device of polyurethane. The readable wavelength was adjusted to the frequency of the available wave numbers to identify the functional groups contained in the polyurethane.
The presence of Aromatic Amine group (N-H) was shown in 3402.43 cm-1 in polyurethane. The presence of this group indicated the presence of urethane bonds.8 The presence of this absorption related to the reading of the Aromatic Ring group range C=O at 1743.64 cm-1 with the hydrogen bonds with it. The C=O group caused the deformation of the N-H group by absorbing the hydrogen bonds.9
The absorption number 2924.08 cm-1 showed the presence of C-H groups (methyl C-H3 and methylene C-H2). This group refers to the existence of a long chain of inner urethane compounds derived from a polyol mixture.8
The wave number 2279.86 cm-1 indicated the presence of an isocyanate group N=C=O which referred to the remaining substance of the reactant used (TDI) which did not react with the polyol.10
Based on the reading of the absorption number at 1743.64 cm-1, the presence of Aromatic Ring group (Amida I) N-C=O indicated the presence of urethane group in polyurethane.9
The absorption number at 1643.45 cm-1 showed the existence of an Aromatic Ring-conjugated C=C group in polyurethane. In the absorption number of 1234.44 cm-1, there was an alcohol group (C-O) which indicated the presence of alcohol correlated with the ether group in polyurethane.11,8
The absorption number at 1161.14 cm-1 indicated the presence of Amide II (C-N) and urethane (N-H) groups. The existence of C-N bonds and N-H bonds showed an interaction between the C-N aromatic amine compound and the N-H urethane group forming a urethane bond.11,8
The Effect of Mixed Variations of Oil (COW/Polyol) and TDI on Mechanical Properties of Polyurethane
The Tensile Strength of Polyurethane
The following graph shows the effect of mixed variations of COW and polyol with TDI on the tensile strength of polyurethane.
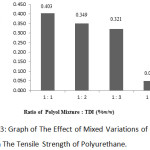 |
Figure 3: Graph of The Effect of Mixed Variations of Oil and TDI on The Tensile Strength of Polyurethane. |
According to the graph, the largest tensile strength obtained was at the 1:1 variation with 0.403 MPa and the lowest tensile strength was at 1:4 variation with 0.050 MPa.
The greater the ratio between TDI and polyol would result in the decreasing of the tensile strength of polyurethane. This is because if more TDI is added to the mixture, the required amount of polyol will also increase. In other words, the resulting product will be fewer because of the unbalanced stoichiometric condition in the system reaction. This may lead to the formation of microdomain urea or a polyurea sphere which is rigid and promotes cohesive forces through hydrogen bonds to capture the movement of the soft segments12. Increasing the number of TDI causes an increasing level of hard segments and the formation of a growing urea chain. As a result, the cohesion energy increases, the resulting polyurethane becomes more rigid and brittle; thus, the tensile strength value of the polyurethane is reduced.13
The Elongation at Break of Polyurethane
The graph below shows the effect of mixed variations of COW and polyol with TDI on the elongation at break of polyurethane.
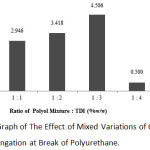 |
Figure 4: Graph of The Effect of Mixed Variations of Oil and TDI on The Elongation at Break of Polyurethane. |
According to the above graph, the highest value of elongation at break was in the 1:3 ratio in the mixture of polyol and TDI with 4.506%, and the lowest value of elongation at break was at 1:4 ratio with 0.500%.
Based on the above graph, it can be concluded that the increasing ratio of the polyol mixture with TDI will further increase the value of elongation at break.At the 1:1 ratio, the value of elongation at break was 2.946%, then this value increased at the 1:2 ratio with 3.418%. The value of elongation at break increased again at the 1:3 ratio with 4.506%. However, there was a sharp decline in the value of elongation at break at the 1:4 ratio with 0.5%.
There might be several things causing the increase at the 1:1 to 1:3 ratio variation. If the ratio of the polyol mixture and TDI increases, it leads to an increase in the hard segment content in the polyurethane. Then, it will form urea bonds which can increase cohesion energy and the value of elongation at break.13The cohesion energy is the energy produced from intermolecular interactions in polyurethane foam.14
On the other hand, the significant decrease at the 1:4 ratio was due to the increase in cross-link density resulting in a rigid foam which reduces the value of elongation at break.15,16 In addition, according to Thanapon et al., the increasing ratio of polyol and added TDI will reduce the length of the soft segment of the polyurethane, and this can decrease the value of elongatin at break12.
During the test to obtain the value of elongation at break, the product used exhibited a very fragile nature at the center and hard at the edges. The test used the center of the product; thus, in the binding process to the test equipment, the product started to break when clamped into the equipment.
The Modulus of Elasticity of Polyurethane
The following graph shows the effect of mixed variations of polyol and TDI on the modulus of elasticity of polyurethane.
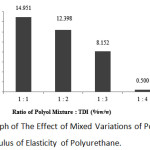 |
Figure 5: Graph of The Effect of Mixed Variations of Polyol and TDI on The Modulus of Elasticity of Polyurethane. |
According to the graph, the highest value of modulus of elasticity was obtained at 1:1 ratio with 14.951 MPa, and the lowest value of modulus of elasticity was at the 1:4 ratio with 0.500 MPa.
It can be concluded from the graph above that the greater the ratio of oil mixture and toluene diisocyanatae, the value of modulus of elasticity decreases. At the 1:1 ratio, the value of modulus of elasticity was 14.951 MPa, at the 1:2 variation was 12.398 MPa, at the 1:3 variation was 8.152 MPa, and at the 1:4 variation was 0.500 MPa.
The increasing ratio of TDI to the polyol would result in the decreasing value of modulus of elasticity of the polyurethane. This is because if more TDI is added to the mixture, the required amount of polyol will increase. In other words, the resulting product will be fewer due to the system reaction is in unbalanced stoichiometric condition and the resulting reaction will be less.12
In addition, the decrease in the value of the modulus of elasticity might be due to the increasing ratio of TDI to polyol, and the more numbers of hard segmentand cross-link density. This will produce polyurethane with increased hardness but decreased elasticity. The excessive addition of TDI also produces CO2 gas in the polymerization reaction of polyurethane. This gas causes the emergence of voids or empty cavities in the product. As a result, the resulting polyurethane becomes brittle and less elastic.16
On the other hand, the significant decrease at the 1:4 ratio was due to an increase in the cross-link density resulting in a rigid foam; thus, it reduces the value of the modulus of elasticity.15,16 The results obtained were hard on the edges of the product and very fragile at the center. The testing used the center of the product; thus, in the binding process to the test equipment, the product started to break when clamped into the equipment.
The Impact Strength of Polyurethane
The graph below shows the effect of mixed variations of oil and (COW/polyol) and TDI on the impact strength of polyurethane.
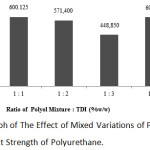 |
Figure 6: Graph of The Effect of Mixed Variations of Polyol and TDI on The Impact Strength of Polyurethane. |
It can be noted from the graph above that the strongest impact strength was at the 1:4 ratio of mixed oil and TDI with the value of 600.975 J/m2 while the weakest impact strength was at the 1:3 ratio of polyurethane with 448.85 J/m2. In this study, the 1:4 ratio was not used as a benchmarck because the polyurethane product at the 1:4 ratio had a high fragility; thus, in the clamping process to the equipment, the product has broken. Therefore, the 1:1 ratio of polyurethane was used as an option to produce polyurethane composites filled with bagasse fibers.
The greater the ratio of TDI to the oil mixture, the impact strength value of the resulting product will decrease. This is due to the increase addition of TDI will result in an increase in the number of isocyanate groups (NCO) in polyurethanes and reduce the amount of reacting polyols. The resulting reactions will be even less due to the inequality of the amount of isocyanate; thus, the resulting polyurethane will be also less.12
Another cause of the decrease in the impact strength value is the formation of CO2 gas in the polymerization reaction of polyurethane due to the excessive addition of TDI. This gas results in the emergence of empty cavities; thus, it increases the fragility and decreases the value of its impact strength.16
At the 1:4 variation, the polymerization reaction of polyurethane occurs due to the presence of hydroxyl groups in the polyol and isocyanate groups in TDI.17 However, if an excessive amount of TDI is added, the resulting polyurethane will have a fragile nature because of the less amount of resulting polyurethane.12 On the other hand, the cause of the increase in the impact strength at the 1:4 ratio of mixed variation of oil and TDI was because the edge of the product used was hard during the test; thus, the product has not broken yet when clamped to the testing equipment.
Water Absorption of Polyurethane
The following graph illustrates the effect of mixed variations of oil (COW and polyol) and TDI on the water absorption of polyurethane.
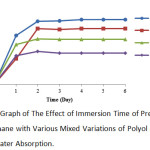 |
Figure 7: Graph of The Effect of Immersion Time of Pre-Polymer Polyurethane with Various Mixed Variations of Polyol and TDI on Water Absorption. |
According to the above graph, it can be noted that the highest value of water absorption was at 1:1 variation with 20.54% and the lowest water absorption was at 1:4 variation with 9.91%. The results have explained the effect of mixed variations of oil and TDI on the water absorption of polyurethane. If TDI used is increased, it will decrease the nature of water absorption of the resulting polyurethane. In the FTIR result performed by T. Gurunathan, the research results showed the presence of free NH group in the NH strain and free NCO group in the NCO strain. The free NH group and the free NCO group can absorb water.17
The greater the added TDI ratio will result in less free NCO group resulted and less water being absorbed. In the water absorption process, water does not react to the free NCO group but is only attached to the surface. The effect of steric hindrance on the addition of polyols will result in the emergence of the structure of the free NCO group.17 The free NCO group (an isocyanate group) may react with water forming a polyurea sphere.47 This results in the formation of more crosslinks.17
Scanning Electron Microscope (SEM) of Polyurethane
The characterization result of SEM of polyurethane with the 1:1 ratio variation of polyol mixture and TDI is shown in Figure 3.8 below.
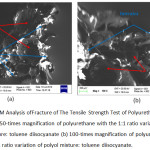 |
Figure 8: SEM Analysis ofFracture of The Tensile Strength Test of Polyurethane Product (a) 50-times magnification of polyurethane with the 1:1 ratio variation of polyol mixture: toluene diisocyanate (b) 100-times magnification of polyurethane with the 1:1 ratio variation of polyol mixture: toluene diisocyanate. |
In Figure 8 (a) and (b), there are foam cavities resulting from the interaction of hydroxyl group from the mixture of COW and polyol with isocyanate group of TDI. The reaction was quite good, and it can be seen from the bonds forming a unity on the foam’s fracture. The presence of cavities in foam indicates the presence of CO2 gas from the interaction of hydroxyl and isocyanate groups. On the other hand, the rough and uneven surfaces were the ends of the practure. Polyurethane is a polymer produced from a mixture of a polyol source with an isocyanate group forming a urethane bond. Isocyanate is highly reactive, so when mixed with polyol will result in spontaneous reaction of polymerization.2
It is important to remember that the polyurethane reaction can run spontaneously with the help of stirring.6 The resulting polyurethane product is a type of rigid foam, a foam which tends to have stiffness nature.
Conclusion
The greater the weight ratio of diisocyanate used will result in various nature and characterizations. The characterization of FTIR obtained N-H group (Aromatic Amine) which stated the presence of urethane group. The best mechanical properties (the tensile strength, the elongation at break, and the modulus of elasticity) were obtained at the 1:1 (gr/gr) variation of Polyol and Toluen Diisocyanate. The best impact strength was obtained at 1:4 variation and the water absorption was obtained at the 1:3 variation. In the SEM characterization, the reaction obtained was quite good which can be seen from the bonds forming a unity of the foam’s fracture. Waste cooking oil can used as mixture of polyol sourcein in production of polyurethane very well.
Acknowledgemnts
The authors would like to thank to University of Sumatera Utara for facilitated this research and also for administrative services.
References
- Suzana M. Cakić, Ivan S. Ristić, Milena M. Cincović, Dragan T. Stojiljković, Csanádi J. János, Cvetinov J. Miroslav, Jakov V. Stamenković. Journal of Progress in Organic Coatings. 2015. 78. 357-368.
CrossRef - Thomas F. Garisson and Michael P. Kesseler. Journal of Bio-Based Plant Oil, Polimer and Composites. 2015. 38-49.
- Deni Reflianto Manik. Thesis in University of Sumatera Utara. 2014.
- Faleh Setia Budi, Didi Dwi Anggoro, and Agus Suprihanto. Seminar Nasional MAKSI. 2009. 1-12.
- Nur Anna Tsaniyah and Teguh Baruji. Essay in Chemical Engineering, University of Semarang. 2008.
- Sumalai Skrikumlaithong, Chulaporn Kuwaranancharoen, Narongdej Asa. Journal of Recent Advances in Environmentally Compatible Polymer. 2001. 197-204
CrossRef - Nahlom Dahlan Marpaung. Thesis, University of Sumatera Utara. 2011.
- John Coates. Encyclodepia of Analytical Chemistry. 2000. 10815-10937
- Silva M. C. dan G. G. Silva. Journal of Wiley InterScience. 2004
- Claudia Merlini, Valdir Soldi dan Guilherme M.O. Barra. Journal of Polymer Testing. 2011. 30, 833 – 840
CrossRef - Anna Bryskiewicz, Milena Zieleniewska, Katarzyna Przyjemska, Piotr Chojnacki, Joanna Ryszkowska. Journal of Polymer Degradation and Stability. 2015. 132, 32-40
CrossRef - Thanapon Kattiyaboot and Chanchai Thongpin. Journal of Energy Procedia. 2016. 89, 177 – 185
CrossRef - Xin Lui, Kai Xu, Huan Liu, Hualun Cai, Jiangxun Su, Zien Fu, Ying Gua, Mingcai Chen. Journal of Progress in Organic Coatings. 2011. 72, 612 – 620.
CrossRef - Hui Du, Yuhua Zhao, Qifeng Li, Junwei Wang, Maoqing Kang, Xinkui Wang, Hongwei Xiang. Journal of Applied Polymer Science. 2016. 110, 1396-1402
CrossRef - Sylwia Dworakowska, Dariusz Bogdal, Aleksander Prociak. Journal of Polymers. 2012. 4, 1462-1477.
CrossRef - Tipeng Wang, Lianhui Zhang, Dong Li, Jun Yin, Sha Wu,Zhihuai Mao. Journal of Bioresource Technology. 2008. 99, 2265-2268.
CrossRef - Gurunathan T, Smita Mohanty, Sanjay K. Nayak. Journal of Progress in Organic Coatings. 2015. 80, 39-48.
CrossRef

This work is licensed under a Creative Commons Attribution 4.0 International License.
![]()
A New Edition of Web of Science
Journal Impact Factor
2022: 0.5
Five Year: 0.8
Journal is Indexed in

Cabells Whitelist
![]()


