Synthesis and Characterization of Al2o3-Doped Lafeo3 Thick Film Ceramics for Ethanol Gas Sensing Application
Endi Suhendi*1, Neng Astri Lidiawati1, Dani Gustaman Syarif2 and Andhy Setiawan1
1Physics Department, Universitas Pendidikan Indonesia, Jl. Dr. Setiabudhi 229, Bandung (40154), Indonesia.
2PSTNT-BATAN, Jl. Tamansari 71, Bandung (40132), Indonesia.
Corresponding Author E-mail: endis@upi.edu
DOI : http://dx.doi.org/10.13005/ojc/350134
Article Received on : 29-12-2018
Article Accepted on : 09-02-2019
Article Published : 26 Feb 2019
Preparation and characterization of Al2O3-dopped LaFeO3 thick film ceramics for ethanol gas sensor applications has been conducted. LaFeO3 ceramics were made by co-precipitation method with doping variation of Al2O3 0% and 3.75 % mole of the main ingredients LaFeO3 (La2O3 and Fe2O3). Screen printing technique was employed to make thick film ceramics of LaFeO3 and Al2O3-dopped LaFeO3. The ceramics were calcined at temperature of 600°C. The analysis results of the characteristics of crystals using X-Ray Difraction (XRD) showed that the made ceramics made had cubic phase with a lattice parameter =a=b=c=39.52nm. The addition of 3.75% mole of Al2O3 did not change the crystal phase and lattice parameter values of LaFeO3. The crystallite size of LaFeO3 was 52.17nm while the crystallite size of Al2O3-doped LaFeO3 was 44.52nm. The analysis results of morphological structure ceramics of LaFeO3 and Al2O3-doped LaFeO3 using Scanning Electron Microscopy (SEM) possessed a grain size of each 0:40 μm and 0.25μm. The electrical characterization results of LaFeO3thick film ceramics indicated the sensitivity of the sensor increased along with the addition of ethanol gas concentration. The maximum sensitivity value of LaFeO3thick film ceramics ceramic thick film LaFeO3 and Al2O3-doped LaFeO3 at 300ppm was 4.34 at 330°C and 6.08 at 350°C.The thick film ceramics with the addition of 3.75% mole of Al2O3 has a higher sensitivity and potential to be used as ethanol gas sensor.
KEYWORDS:Al2O3-Doped LaFeO3; Co-Precipitation; Ethanol Gas Sensor; Film Thickness; LaFeO3; Screen Printing
Download this article as:| Copy the following to cite this article: Suhendi E, Lidiawati N. A, Syarif D. G, Setiawan A. Synthesis and Characterization of Al2o3-Doped Lafeo3 Thick Film Ceramics for Ethanol Gas Sensing Application. Orient J Chem 2019;35(1). |
| Copy the following to cite this URL: Suhendi E, Lidiawati N. A, Syarif D. G, Setiawan A. Synthesis and Characterization of Al2o3-Doped Lafeo3 Thick Film Ceramics for Ethanol Gas Sensing Application. Orient J Chem 2019;35(1). Available from: https://bit.ly/2Nvxl4d |
Introduction
Gas sensors are electro-chemical sensors which provide an electrical signal in response to chemical interaction with the gas.1 A gas sensor enables to detect environmental changes by changing the amount of chemical into electrical quantities.2,3 Ethanol gas sensor (C2 H6O) is one of the gas sensors needed for daily activities such as in the perfume industry,4 food and beverages.5
Perovskite-type oxides with an ABO3 perovskite structure (A: alkali metal cations or alkaline-earth metal; B: transition metal cations) has been widely used as raw material for gas sensor for it has high temperature stability and selectivity to different gases.6,7,8 The example of perovskite-type oxides is lanthanum ferrite (LaFeO3) which is derived from synthesis of La2O3 and Fe2O3. Metal oxides can be obtained from purified yarosit mineral. This yarosit mineral are easily found in Indonesia, on the north coast of the Java, Sumatra, Kalimantan and Bangka Island.9
The purified yarosit mineral contains Fe2O3 amounting to 91.30% by weight, 3.30% of Al2O3, 2.05% of SiO2, 3.02% of TiO2, 0.16% of CaO and 0.12% of MnO [10]. Since it has a large content of iron, the purified yarosit mineral has potential as an industrial material that is used as the base material for thick film ceramics to apply gas sensors. Research on the LaFeO3 ethanol gas sensor with Fe2O3 as the basic materials, the yarosit purification result has been performed and the results show that the material is sensitive to the presence of ethanol gas .5.11
The effect of each ingredient contained in yarosit purification result has not been recognized. To determine the effect of the minerals, the addition of purified yarosit Al2O3 was done as much as 3.75% mole or equal to 1.6% by weight of the main ingredient of LaFeO3. This concentration is a concentration below the concentration of Al2O3 contained in yarosit mineral purification results. The materials used in the manufacture of Al2O3-dopped LaFeO3 are pure materials so that there are no impurities other than in ceramics. Crystal characteristics, morphology and electrical characteristics of thick film ceramics will be analyzed and compared with Al2O3-dopped LaFeO3. If the addition of 3.75% mole of Al2O3 shows a positive influence on LaFeO3, the content of Al2O3 in the purified yarosit shall not be eliminated so it will reduce the cost of the purification process.
Materials and Methods
Materials
The materials used in this study are, Lanthanum (III) chloride heptahydrate (Iron, (III) oxide (Fe2O3) and aluminum chloride (LaCl3). These materials are determined severity based chemical calculations. The powder of LaFeO3 is synthesized from powder and mole ratio of 1: 1. The powder of Al2O3-dopped LaFeO3 was synthesizedfrom LaCl3, 7H2O3 and laCl3 comparing with each mole were 13:13;1 respectively.
Preparation of Powder
LaFeO3 and Al2O3-dopped LaFeO3 powder were made by using co-precipitation method. First, all ingredients were dissolved with each solvent. LaCl3, 7H2O, and AlO3 were dissolved by using distilled water (aquades) and Fe2O3 was dissolved with HCl 10 M. After each ingredient was dissolved, all solution was mixed and was added by NH4OH solution so that the precipitate of LaFeO3 and Al2O3-dopped LaFeO3 was formed. The precipitate was dried at a temperature of 100°C and was calcined at a temperature of 800°C for 2 hours. The results of calcination were crushed and screened to the same nano-sized powder.
Preparation Thick Film
Each LaFeO3 and Al2O3-dopped LaFeO3 powder was mixed with Organic Vehicle (OV) with a ratio of 70% and 30% in order to form a paste. The pasta was coated on a substrate of alumina which has been coated with silver using screen printing method and baked at a temperature of 600°C for 2 hours to produce LaFeO3 and Al2O3-dopped LaFeO3 thick film ceramics.
Characterization of Thick Film
Crystal characteristics of LaFeO3 and Al2O3-dopped LaFeO3 thick film ceramics were analyzed using X-Ray Difractrometer (XRD PRO series, λ = 1.540598Å, PAN), thick film ceramic surface morphology was analyzed using Scanning Electron Microscope (SEM, JEOL-6360LA) and electrical characteristics of thick film ceramics were measured by using a set of tools chamber gas. The measurement of the electrical properties was done by heating the thick film ceramics from room temperature to a temperature of 360°C. When the resistance value was read, every increase in temperature of 5°C, the temperature and the resistance value were recorded. Electrical characteristic testing was done without using gas (ambient state) and using ethanol gas at a concentration of 100 ppm, 200 ppm to 300 ppm.
Results and Discussion
Characteristics of Crystals
Graph of the XRD LaFeO3 and Al2O3-dopped LaFeO3 thick film ceramics is shown in Figure 1. From the graph it can be seen the diffraction angle and orientation of the area corresponding to the database crystallographic open database (COD) No.96-154-2033. The formed phase crystals are the same phase that is cubic with lattice parameters a = b = c = 3,926Å. It can be seen from the graph that the relationship between the intensity and 2θ had the same diffraction pattern. The addition of 3.75% mole of Al2O3 did not change the phase and the lattice parameter of LaFeO3 thick film ceramics.
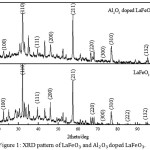 |
Figure 1: XRD pattern of LaFeO3 and Al2O3 dopped LaFeO3 |
The average size of the crystals can be calculated using the Debye-Scherrer equation as follows7:
![]()
D is the size of the crystal in the (nm), λ is the wavelength used in the test XRD (nm), and B is the peak half width in radians, and θ is the angle position crests. The average of crystallite size of LaFeO3 and Al2O3-dopped LaFeO3 thick film ceramics are respectively 52.17nm and 44.52nm. Crystallite sizes shrink when added to. doping.
The Surface Morphology
SEM test results of LaFeO3 and Al2O3-dopped LaFeO3 thick film ceramics can be seen in Figure 2.
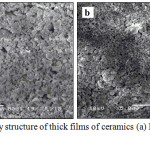 |
Figure 2: Morphology structure of thick films of ceramics (a) LaFeO3 and (b) Al2O3-doped LaFeO3. |
The effect of the addition can be seen from the grain size of each ingredient. The surface of LaFeO3 and Al2O3-dopped LaFeO3 thick film ceramics has almost the same (uniform) grain sizes with the size 0.40 μm and 0.25 μm each. The grain size decreases when added by Al2O3. This is due to the addition of 3.75% mole of Al2O3 causing the particles of Al2O3 were segregated at the border of the grain so that the grain size of can be reduced resulting in contact among the grains become mutually bounding. Figure 2 also shows the pores of La doped by Al2O3 that seem smaller and few.
Electrical Properties
Figure 3 shows a graph of the temperature with a thick film ceramic resistance value. The resistance value decreases as the operating temperature increases. This is in accordance with semiconductor characteristic that is the semiconductor is lowering barriers exponentially when the ambient temperature increases.12
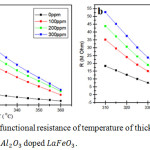 |
Figure 3: Graph of functional resistance of temperature of thick films ceramics (a) LaFeO3 and (b) Al2O3 doped LaFeO3. |
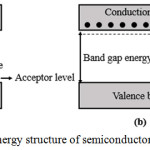 |
Figure 4: The band gap energy structure of semiconductor (a) p-type and (b) n-type. |
For the p-type semiconductor, at low temperatures electrons in the valence band will move to the level of the acceptor producing holes in the valence band, whereas the conduction band electrons are not free because it requires a fairly high energy (thermal energy). Concentration of electric charge carriers was unbalanced, the amount of holes are much larger than free electrons. For the n-type semiconductor, at low temperatures, the electrons at donor level can be to the level of conduction into free electrons, while the electrons in the valence band cannot move into the conduction band since it requires considerable energy. In these circumstances, the concentration of electric charge was not balanced; the amounts of free electrons are much larger than the hole. Along with the increase of temperature on semiconductor material the chance of occurrence process of atom ionization of semiconductor crystal compiler will increase, thus there will be electrons at valence band which moved to conduction band so the free electron concentration will increase as well. The process of electron excitation to the conduction band will leave a hole in the valence band.13 The more electrons move to the conduction band, the easier thick film ceramics in conducting the electric current so that the resistance value will be smaller.
The Sensitivity and the Sensor Mechanism
Thick film ceramic sensitivity values are calculated using equation (2)14:
![]()
where S is the sensitivity of the sensor, Rg, is the resistance when the gas contained ethanol (MΩ), and Rg, is the resistance at ambient circumstances (MΩ).
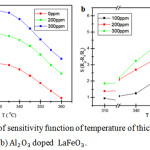 |
Figure 5: Graph of sensitivity function of temperature of thick film ceramics (a) LaFeO3 and (b) Al2O3 doped LaFeO3. |
At the same temperature, the resistance value increases along with increasing the concentration of ethanol gas. Since ethanol gas is a reducing gas14,15 it is known that LaFeO3 and Al2O3-dopped LaFeO3 thick film ceramics has the characteristics as a p-type semiconductor (hole majority carrier) for materials with excess holes will react towards reduction with ethanol gas resulting in decreasing the gas flow characterized by an increased resistance of the material. The increase of the value of this resistance occurs because the more gas is adsorbed, the number of atoms / ions of oxygen in the thick film ceramics increases and the number of electrons decreases. The more the concentration of ethanol gas, the higher the potential barrier which were formed so the electron is hard to be excited from the valence band to the conduction band.16,17
The influence of operating temperature on the sensitivity of LaFeO3 and Al2O3-dopped LaFeO3 thick film ceramics at 100, 200 and 300ppm ethanol gas was shown in Figure 5 (a) and (b). The gas response increased along with increasing temperature of operation and achieved maximum sensitivity at the operating temperature 330°C for LaFeO3 thick film ceramics and 350°C for Al2O3-dopped LaFeO3 and then decreased along with increasing operating temperature.
At high temperatures the oxygen molecule was adsorbed the surface of thick film. The order of the processes involved in the absorption of oxygen can be described by the following equation15:
O2(gas) ↔ O2(ads) (3)
O2(ads) + e¯ ↔ O2¯ (ads) (4)
O2¯ (ads) + e¯ ↔ 20¯ (lattice) (5)
in this state the electrons present in the valence band obtain a number of thermal energy that can be excited into the conduction band and leave holes in the valence band (Figure 6 (a)).
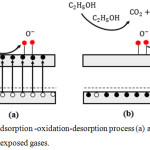 |
Figure 6: Adsorption -oxidation-desorption process (a) ambient and (b) ethanol exposed gases. |
In Figure 6 (a) the oxygen molecules were adsorbed on the surface of the thick film ceramics will be ionized because it binds to electrons in the conduction band that are shown by equations 4 and 5. In addition to the formation of ion O¯ this absorption of oxygen causes forming a depletion layer around the grain boundaries. Depletion layer thickness is determined by the amount of oxygen and intrinsic electrons contained in the material surface. Layer depletion at grain boundaries generate potential barrier so that the grain boundaries impede the movement of electrons.17
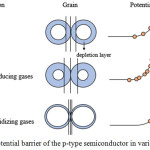 |
Figure 7: The potential barrier of the p-type semiconductor in various condition. |
At the time of LaFeO3 and Al2O3-dopped LaFeO3 thick film ceramics exposure to ethanol gas, the ethanol gas molecules will react with oxygen gas molecules on the surface of thick film ceramics that has been ionized into O¯ and O2¯ produced 2CO2 and 3H2O in accordance with Figure 6 (b). The mechanism of the gas sensor is basically an oxidation-reduction reaction on the surface of the material. O2¯ was absorbed accelerating this following reaction14:
C2H5OH + 6On- → 2CO2 + 3H2O +6ne– (6)
This reaction caused the increase in resistance value that was indicated by the higher potential barrier (Figure 7 (b)) as the detached electrons return to the valence band so that the number of holes in the valence band was reduced.14,15
Acknowledgments
This work was financially supported by “Hibah Penelitian Terapan Unggulan Perguruan Tinggi” Research Grants in the fiscal year 2018.
Conclusion
The powder of LaFeO3 and Al2O3-dopped LaFeO3 has been made by employing co-precipitation method. Thick film ceramics were generated through screen printing method. The XRD results showed LaFeO3 and Al2O3-dopped LaFeO3 thick film ceramicshas a cubic phase with a lattice parameter a = b = c = 39.52nm. The crystallite size before and after the addition of doping was shrunk from 52.17nm to 44.52nm. The addition of Al2O3 minimized the size of grain from 0:40 μm and 0.25 μm, increased the value of electric resistance and increase the operating temperature. Gas sensors doped by Al2O3have a higher sensitivity of the gas sensor without the addition of doping.
References
- Yadav, AK; Singh, RK; Singh, P. Sensors and Actuators B: Chemical. 2016, 229, 25-30.
CrossRef - Hiskia. BATAN. 2007, 7-18.
CrossRef - Sujitno, T., Atmono, T., Sayono, S., & Susita, L. BATAN. 2006, 9(2).
CrossRef - Rahimah S.; Sharif DG; Suhendi E. BATAN. 2011, 329-322.
- Suhendi, E.; Witra; Hasanah, L.; Sharif, DG AIP. 2017, 1848.
- Cyza, A .; Kopia, A.; Cieniek, lbs.; Kusiński, J. Materials Today. 2016, 3(8), 2707-2712.
CrossRef - Haron, W.; Wisitsoraat, A.; Wongnawa, S. Prepared Oxide Nanocrystalline perovskite LaFeO3 at Lower Temperature with Improved Ethanol Gas Sensoring. ICBNE. 2015, 10-14.
- Khetre, SM; Chopade, AU; Khilare, CJ; Kulal, SR.; Jadhav, HV; Jagadale, PN; Bamane, SR, J of Shivaji Union (Sci & Tech). 2014, 41(2), 250-5347.
- Taufik, D.; Sharif, DG; Karim, S. BATAN. 2007.
- Suhendi, E.; Novia, H.; Sharif, DG; Prajitno, D. H, Proceedings of the National Seminar on Research, Education and Application of Mathematics, Faculty of Science, University of Yogyakarta, 2010.
- Ariyani, NI; Sharif, DG; Suhendi, E. IOP. 2018, 384.
- Yacoobi, BG Plenum. 2003.
- Barsoum, MW Institute of Physics. 2003.
- Thuy, NT; Minh, DL; Giang, HT; Toan, NN Hindawi. 2014.
CrossRef - Benali, A.; Azizi, S.; Bejar, M.; Dhahri, E .; Graça, MFP Ceramics International. 2014, 40(9), 14367-14373.
- Shankar, P.; Rayappan, JBB Sci. Lett. J, 2015. 4, 126.
- Balaguru, RJB.; Jeyaprakash, BG Tamil Nadu. 2012.

This work is licensed under a Creative Commons Attribution 4.0 International License.
![]()
A New Edition of Web of Science
Journal Impact Factor
2022: 0.5
Five Year: 0.8
Journal is Indexed in

Cabells Whitelist
![]()


