Some Novel Antibacterial Macrocyclic Complexes for Gram +ve and Gram -ve Bacteria
Sangeeta Sharma*1 , Rimpi Mehani Ne’e Chopra2 and Veenu Chugh3
1Department of Applied Sciences, Shaheed Bhagat Singh State Technical Campus, Ferozepur, Punjab, India.
2Department of Chemistry, Ramgarhia Girls College Miller Ganj, Ludhiana, Punjab, India.
3PTU Jalandhar and Department of Chemistry, Dasmesh Girls College, Badal, Sri Muktsar Sahib, Punjab, India.
Corresponding Author E-mail: sangeetassharma70@gmail.com
DOI : http://dx.doi.org/10.13005/ojc/350138
Article Received on : 05-11-2018
Article Accepted on : 01-01-2019
Article Published : 07 Feb 2019
The synthesis, characterization and antimicrobial properties of some novel macro-cyclic complexes with molecular formula [M (C22H16N4O2) X] X2 have been discussed here, where M= Fe (III), Co (III) and Cr (III) and X is either bromine or chlorine. These complexes were prepared by template condensation of Ethylenediamine and 2, 2-dihydroxyindane-1, 3-dione using salts of trivalent metal. The complexes were characterised by physico-chemical techniques such as elemental analysis, molar conductivity, electronic spectra, magnetic moments, mass spectra and IR spectra at CFL,SAIF, Panjab University, Chandigarh. X-ray diffraction data obtained indicates the square pyramidal geometry of Cr(III), Cu (III) and Fe (III) macrocyclic complexes. Thermal stability was determined using the thermogravimetric studies. Agar well diffusion technique was used to check the antimicrobial properties of the prepared macro-cyclic complexes against two Gram +ve Bacteria and two Gram -ve Bacteria. The antimicrobial data on comparison with standard antibiotics such as streptomycin and chloramphenicol supports the antimicrobial behaviour of the above reported cobalt bromide and chromium chloride complexes.
KEYWORDS:Bromide; Chromium; Schiff’s Base; Thermogravimetric
Download this article as:| Copy the following to cite this article: Sharma S, Chopra R. M. N, Chugh V. Some Novel Antibacterial Macrocyclic Complexes for Gram +ve and Gram -ve Bacteria. Orient J Chem 2019;35(1). |
| Copy the following to cite this URL: Sharma S, Chopra R. M. N, Chugh V. Some Novel Antibacterial Macrocyclic Complexes for Gram +ve and Gram -ve Bacteria. Orient J Chem 2019;35(1). Available from: https://bit.ly/2SxAANr |
Introduction
Macrocyclic chemistry has been the subject of extensive research for chemists because of its importance in bioinorganic as well as in natural chemistry. Synthetically prepared macrocyclic compounds resemble some of the natural proteins like hemerythrin and enzymes; Macrocyclic complexes have remarkable kinetic and thermodynamic stability. Many macrocyclic complexes are biologically active compounds such as Chlorophyll, Heme and vitamin B12 and hence they are of special interest. Many years of research has lead to publishing of several papers reporting their uses as dyes and pigments, MRI contrast agents, pharmacological properties1-5such as antitumor, antifungal, ant fertility, antiviral, anticancer and other biological activities.6-8 Schiff’s base is the first synthetic macrocycle used in chemical reactions as catalyst.9-12 Macrocyclic chemistry has greater contribution to green chemistry being used in nuclear waste cleanup such as 137Cs & 90Sr. Mostly, template method is used for synthesizing macrocyclic complexes by condensation of carbonyl and diamine in which metal ion act as templating agent. The aim of our research is to synthesize new macrocyclic complexes and characterise them via atomic absorption,XRD, IR, ESR, MASS, NMR spectroscopies. In the search of new and effective antimicrobial drugs, the synthesized complexes have been screened against two Gram +ve (B.subtilius and B.thermophilus) and Two Gram -ve Bacteria (E.coli and Pseudomonas putida).
Experimental
New Macro-cyclic complexes were synthesised by refluxing of Ethylenediamine & 2, 2-dihydroxyindane-1, 3-dione (Ninhydrin) using metal (III) ions. Solution of the metal ion (5mmol) was made by slowly adding methanol to it. A hot methanolic solution of 2, 2 dihydroxyindane-1, 3-dione (10mmol) was poured in round bottom flask and mixed with the metal ion solution (~50cm3). This mixture was kept for refluxing for 30 min. Then, Ethylenediamine solution (10 mmol) was added. Further, refluxing for 8 to 10 hours was continued which depends upon the type of metal ions used. After concentrating the resulting reaction mixture, it was allowed to stand for crystallization in dessiccator for two days. The filtration of the product was done followed by its washing with methanol and drying thoroughly. With the help of TLC, the purity of the synthesized macrocyclic complexes was checked. The complexes formed were soluble only in Dimethylformamide or Dimethylsulfoxide solvents. All the complexes were found to be decomposed above 210°C to moist mass and did not show a sharp melting point.
 |
Scheme 1 |
The synthesis route for the ligand is via template synthesis i.e. the cyclization takes place in the presence of the metal. The generation of the cyclic product is influenced by the presence of metal ion.
Results and Discussion
All the complexes formed, were coloured solids, non-hygroscopic in nature, stable in air and were not soluble in most of the organic solvents except in Dimethyl form amide or Dimethylsulfoxide. The percentage of metal present in all the complexes was calculated volumetrically by titrating the solution against 0.1M EDTA using Eriochorme Black- T, Xylenol orange as indicators. A calculated amount of the synthesized complex was heated in presence of a very small amount of conc. HCl followed by repeatedly with conc.HNO3 to decompose the organic content. Then the product was dissolved in doubly distilled H2O or dil. HCl was added to make the solution upto the known volume. The metals present in the synthesized complexes were estimated by standard methods reported in literature. Throughout the investigations, organic compounds, solvents and trivalent metal salts used were of Analytical Grade. Solvents used in the experiment were purified and dried thoroughly by reported standard methods as per requirement.
The data shown in the table-1 & 2 gives the formulae for macro-cyclic complexes as [M (C22H16N4O2) X]X2 where M= Fe (III), Co (III) and Cr (III) and X is either bromine or chlorine. All the complexes were found to be conducting by molar conductance method. Their conductivity measurements were found to be in the range of 125-180 ohm-1 cm2 mol-1. This indicates that the ratio of cation to anion is 1:2.13 The molar conductance of macrocyclic complexes were measured in Dimethyl sulfoxide solution at room temp. Digital conductivity meter with dip type cell was used (HPG System, G3001).
Table 1: Shows data of elemental analysis of chromium (III), iron (III) and cobalt (III) complexes.
| S.no. | Complexes | Found (cal %) | ||||
| Metal | Carbon | Hydrogen | Nitrogen | Mol. Wt. | ||
| 1 | [Cr(C22H16N4O2)Cl]Cl2 | 9.68 (9.70) | 50.1(50.23) | 3.01(3.04) | 10.1(10.65) | 525.5 |
| 2 | [Cr(C22H16N4O2)Br]Br2 | 7.71 (7.74) | 39.8(40.10) | 2.1 (2.43) | 8.2(8.5) | 659 |
| 3 | [Fe(C22H16N4O2)Cl]Cl2 | 10.51(10.54) | 49.1(49.76) | 2.99 (3.02) | 10.3(10.56) | 530.5 |
| 4 | [Fe(C22H16N4O2)Br]Br2 | 8.39 (8.42) | 39.4(39.75) | 2.39(2.41) | 8.1(8.43) | 664 |
| 5 | [Co(C22H16N4O2)Cl]Cl2 | 10.38(10.49) | 49.0(49.75) | 2.90(2.99) | 10.52(10.42) | 533.5 |
| 6 | [Co(C22H16N4O2)Br]Br2 | 8.48 (8.59) | 38.9(39.58) | 2.2(2.39) | 8.31(8.39) | 667 |
Table 2: Shows data of %age yield and magnetic moment of chromium (III), iron (III) and cobalt (III) complexes.
| S.no | Complexes | Colour | Λm | Yield % | µeff |
| 1 | [Cr(C22H16N4O2)Cl]Cl2 | shiny orange powder | 100 | 42 | 4.16 |
| 2 | [Cr(C22H16N4O2)Br]Br2 | dark red powder | 102 | 44 | 4.46 |
| 3 | [Fe(C22H16N4O2)Cl]Cl2 | shiny blackish grey | 115 | 42 | 5.72 |
| 4 | [Fe(C22H16N4O2)Br]Br2 | Black powder | 112 | 45 | 5.91 |
| 5 | [Co(C22H16N4O2)Cl]Cl2 | shiny black powder | 88 | 43 | 5.70 |
| 6 | [Co(C22H16N4O2)Br]Br2 | blackish grey powder | 84 | 46 | 5.81 |
IR Spectra
Comparison of Infrared spectrum of the free ligand was done with that of complexes of chromium (III), iron (III) and cobalt (III) just to know the bonding mode of ligand to metal. The IR spectra of ethylenediamine showed two bands at the range ~3500 and 3400 cm-1 which confirmed free NH2 group. These peaks were not found in Infra red spectra of all synthesized complexes showing absence of free amino groups. The origin of an extra strong band at ~1650 cm-1 shows the condensation of CO group of ninhydrin & -NH2 group of ethylenediamine, confirming –C=N– of macro-cyclic structure. A strong band appeared at ~1720 cm-1 due to >C=O group which was formed on dehydration, due to heating, of 2,2-geminal OH groups of ninhydrin.14,15 The bands shown in the region 1350-1000 cm-1 are due to -CN- stretching vibrations. The low value of -CN stretching frequency suggests the involvement of nitrogen of azomethine towards metal atom coordination. The IR spectra of all the synthesized metal complexes showed bands around ~487 cm-1, ~608 cm-1, ~766cm-1 and 1008cm-1 which corresponds to out of the plane v(C-C), in the plane v(C-C), out of the plane v(C-H) and in the plane v(C-H) respectively16. The bands at ~1385 and ~1500 cm-1 can be assigned to >C=C< skeleton of the benzenoid rings. Bands which appeared in the range 300-500 cm-1may be designated to M-X vibrations.16
Mass Spectra
The mass spectrum showed the final peaks at 454.5, 498, 459.5, 505, 464.5, 506 for Cr(III) , Fe(III) and Cr(III) respectively which coincides with that parent peak such as [M]+. The presence of one halogen (Cl/Br) in the complexes was confirmed from the recorded molecular ion peaks [M]+ & [M+2]+ which are obtained for various complexes. The major peaks are as follows:
[Cr(C22H16N4O2)Cl]+ = 454.5 & 456.5 , [Cr(C22H16N4O2)Br]+ = 498 & 500,
[Fe(C22H16N4O2)Cl]+ = 459.5 & 461.5, [Fe(C22H16N4O2)Br]+ = 505 & 507,
[Co(C22H16N4O2)Cl]+ = 464.5 & 466.5 , [Co(C22H16N4O2)Br]+ = 506 & 508.
Electronic Spectra and Magnetic Moment
Electronic spectra arise due to the absorption of electromagnetic radiation in UV/Visible region of the electromagnetic spectrum leading to d-d electronic transitions within a metal-ligand coordinated complex. The d orbital are not degenerate, they are split into micro states, represented by term symbols 4B1, 4Ea, 4A2 etc. If the different excited vibrational energy levels (micro states) are shown as υ1, υ2 and so on, the ground state shown as υ0, the fine structure in main peak of spectrum is designated to υ0 → υ0, υ0 → υ1 and υ0 → υ2 vibrational energy states. Further, the υ0 → υ0 transition is found to be lowest energy transition with longest wave length. Nephelauxetic Ratio, β, measures the ionic character of the complex. β = B/Bo Where B is the Racah parameter and is a measure of inter-electron repulsion within the whole coordinated ion and Bo is the value of Racah parameter when the ion is not coordinated e.g. in free state. The smaller values for β indicate more covalent character or less ionic character. The valve of β is always less than one for the compounds having covalent bonding and β is equal to one for completely ionic compounds.12
To get information about the oxidation state and stereo-chemistry of central metal ions in the coordination complexes, magnetic moments are generally used in conjunction with the electronic spectra. The numbers of unpaired electrons are indicated by the magnetic moment measurements.
Cr (III) Complexes
The value of effective magnetic moment was found to be in the range between 4.12-4.46 B.M which is near to the expected values of three unpaired electrons18 in central metal ion of chromium.18 thus the electronic configuration in case of chromium in synthesized complexes is 3d3 4s0. The electronic spectrum of chromium complex taken in DMSO shows bands at 9100-9300 cm-1(v1), 13000-13300 cm-1 (v2),17550-18330 cm-1(v3) The spectra don’t resemble with the spectra of four or six coordinated complexes. Hence the proposed geometry is square pyramidal, the structure of which has already been confirmed through X-ray measurements in literature and various analytical methods.18 Thus, assuming the symmetry C4V19 for these complexes,20,21 the different spectral bands can be designated as: 4B1 → 4Ea, 4B1 → 4B2, 4B1 → 4A2 and 4B1 → 4Eb.
Fe(III) Complexes
The magnetic moments in case of iron(III) complexes in the range 5.7 – 5.9 B.M indicate high spin value19, 21 and show the presence of five unpaired electrons. Electronic spectra done in Dimethyl sulphoxide show the bands at 9830-9980 cm-1 (v1) , 15500-15580 cm-1 (v2) and 27500-27700 cm-1(v3) which favours with square pyramidal geometry of Fe(III) complexes.18 Different bands are shown as: dxy → dxz, dyz, dxy → dz2. It was difficult to assign accurately all the bands due to interactions of metal ligand л-bonding systems that lifted the degeneracy of dxz and dyz pairs.
Co (III) Complexes
The magnetic moments of cobalt complexes were found to be of 5.7 B.M indicating the presence of high-spin cobalt (III)22 ions as the central metal. The electronic configuration hence supported was 3d6 4s0. It has four unpaired e–. The electronic-spectra done in DMSO, shows the bands at 18000-18200 cm-1, 22900 cm-1 and 39000 cm-1. It has strong absorption band at 18000 cm-1 due to ligand-field transition. It possibly may be due to electron-transfer band,23 supporting square pyramidal geometry.
Thermo-Gravimetric Analyses (TGA)
Thermo-gravimetric Analysis is the technique by which mass of a substance can be monitored as the function of time or temperature. TGA is also done to find out the thermal stability of the complexes. There is no observed mass change with the rise in temperature, if the synthesized complexes are thermally stable. TGA also gives the maximum temperature up to which the complexes are stable. The TGA thermo-grams of Cr(III), cobalt (III) and Fe(III) complex derived from Ethylenediamine & 2,2-dihydroxyindane-1,3-dione(Ninhydrin) were recorded in the dynamic nitrogen atmosphere in the the temperature range of 10-500°C at heating rate of about 10°C min-1. TGA thermo-grams for all complexes depicted two stages of the thermal-decomposition. The thermal-degradation of metal complexes is generally exothermic event because there are two observed exothermic humps which correspond to two thermal decomposition stages. The first step occurs in the temperature range of 210-250°C. The second step occurs in the temperature range of 250-500°C which corresponds to the decomposition of the organic moiety (remaining). The first decomposition step of all the complexes indicates the removal of co-ordinated Cl– ions followed by decomposition of organic moiety having final residues in the form of oxide of metals.
X-ray Diffraction Study
X-ray diffractogram was obtained from SAIF, CFL, Panjab University, Chandigarh. These refractograms were recorded on XPERT-PRO diffractometer using 0-80°C scanning range and CU as X-ray source. Results reveal the amorphous nature of the complexes. From these results Miller indices (hkl),24 Unit cell parameter and unit cell volume has been calculated. (Shown in table 3) The unit cell of Fe (III) yielded lattice constants a=10.4180 A0,b=10.7290 A0 and c=20.5610 A0 and volume=2266.88 pm3, unit cell of Cr (III) yielded lattice constants a=11.5000 A0 ,b=11.5000 A0 and c = 15.5200 A0 and volume = 1777.53 pm3 and unit cell of Co (III) gives lattice constants a=11.8038 A0, b = 11. 8038 A0 and c= 16.096 A0 and volume= 1942.19 pm3. This data is found to be in good agreements with condition a≠b≠c and α=γ=90°≠β for monoclinic system of Fe(III) complexes and condition c¹a=b and α=β≠γ for hexagonal system of C0(III) and Cr(III).The number of the molecules was found to be four for Fe(III), Co(III) and Cr(III) by using equation ρ = ρ M/NV where ρ = density= Avogadro no. and V= volume of the unit cell.25
Table 3: Unit cell parameter and unit cell volume for the synthesized trivalent complexes as calculated from XRD values.
| Metal | a in A0 | b in A0 | c in A0 | Volume pm3 | Ratio of parameters | Crystal type |
| Fe(III) | 10.4180 | 10.7290 | 20.5610 | 2266.88 | a≠b≠c , α=γ=90°≠β | monoclinic |
| Cr(III) | 11.5000 | 11.5000 | 15.5200 | 1777.53 | c¹a=b , α=β≠γ | hexagonal |
| Co(III) | 11.8038 | 11.8038 | 16.096 | 1942.19 | c¹a=b , α=β≠γ | hexagonal |
The diffractograms Fig 1, 2, 3 depicting 2θ values and relative intensity26 of Fe (III), Co (III) and Cr (III) are shown as:
![Figure 1: X-ray diffractogram of complex [Fe (C22H16N4O2) X]X2 where X= Cl- or Br-.](http://www.orientjchem.org/wp-content/uploads/2019/02/Vol35No1_Som_San_fig1-150x150.jpg) |
Figure 1: X-ray diffractogram of complex [Fe (C22H16N4O2) X]X2 where X= Cl– or Br–. |
![Figure 2: X -ray diffractogram of complex [Co (C22H16N4O2) X]X2 where X= Cl- or Br-.](http://www.orientjchem.org/wp-content/uploads/2019/02/Vol35No1_Som_San_fig2-150x150.jpg) |
Figure 2: X -ray diffractogram of complex [Co (C22H16N4O2) X]X2 where X= Cl– or Br–. |
![Figure 3: X -ray diffractogram of complex [Cr (C22H16N4O2) X]X2 where X= Cl- or Br-.](http://www.orientjchem.org/wp-content/uploads/2019/02/Vol35No1_Som_San_fig3-150x150.jpg) |
Figure 3: X -ray diffractogram of complex [Cr (C22H16N4O2) X]X2 where X= Cl– or Br–.Click here to view figure |
Antibacterial Activities of Trivalent Cobalt, Iron and Chromium Complexes Synthesized from Ethylenediamine and Ninhydrin
Test Pathogen
Two Gram+ve bacteria B. subtilis (MTCC 8509) and B. stearothermophilus (MTCC 8508), two Gram-ve bacteria E. coli (MTCC 51) & P. putida (MTCC 121) were used for anti-bacterial study of the prepared complexes which was obtained by culture collection & gene bank , Institute of Microbial Technology, Chandigarh, India.
In-Vitro Antibacterial Activity
Preparation of Test Samples
Test samples of the synthesized complexes were prepared in DMSO (Dimethylsulphoxide). The concentration ranges from 100 to 1 ppm.
Antimicrobial Technique
In order to assess the antimicrobial activities, Two Gram+ve bacteria ,B. subtilis (MTCC 8509) & B. stearothermophilus (MTCC 8508), two Gram-ve bacteria E. coli (MTCC 51) & P. putida (MTCC 121) were used26-28 for the evaluation of newly prepared complexes by Agar Well Diffusion technique.29 Under aseptic conditions, in to the laminar flow chamber, 20 cc of MHA (Mueller- Hinton-Agar) medium was dispersed into pre-sterilised petri -dishes. Once it solidifies, it was inoculated with microorganism (prepared according to the instructions of MTCC) suspended in peptone water. The media was punched with hole of 6mm diameter and filled with different solutions prepared in different concentration (ppm) and labelled. Streptomycin and chlorampenicol antibiotics were used as positive control for comparison with macrocyclic complexes and DMSO used a negative control. Finally, the petridishes were kept in incubator at 37°C for 24 hours. On the next day, the diameter of one developed around the hole was measured. Each experiment was done in triplicate for the determining MIC (minimum inhibitory concentration). Table 4 gives the range of MIC which was calculated by subtracting the value of diameter of DMSO (negative control) from the diameter of macrocyclic complexes (positive control).
Table 4: Minimum inhibitory concentration (MIC) of metal (III) complexes obtained from Ninhydrin and Ethylenediamine against gram+ve and gram-ve bacteria using Agar dilution assay.
| S.No | COMPLEXES | MIC | |||
| A | B | C | D | ||
| 1 | [Cr(C22H16N4O2)Cl]Cl2 | 32 | >32 | >64 | 32 |
| 2 | [Cr(C22H16N4O2)Br]Br2 | 16 | 02 | >64 | >06 |
| 3 | [Fe(C22H16N4O2)Cl]Cl2 | >64 | 30 | >64 | 64 |
| 4 | [Fe(C22H16N4O2)Br]Br2 | >64 | >64 | 32 | 64 |
| 5 | [Co(C22H16N4O2)Cl]Cl2 | >04 | 08 | 04 | 08 |
| 6 | [Co(C22H16N4O2)Br]Br2 | 08 | 16 | 32 | 116 |
| 7 | Chloramphenicol | 02 | 02 | 06 | 08 |
| 8 | Streptomycin | 02 | 02 | 04 | 04 |
A-B. subtilis (MTCC 8509) B- B. stearothermophilus (MTCC 8508).
C – P. putida (MTCC 121) D – E. coli (MTCC 51).
The comparisons can be shown using bar graphs, where L stands for C22H16N4O2:
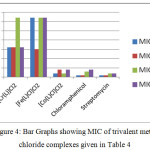 |
Figure 4: Bar Graphs showing MIC of trivalent metal chloride complexes given in Table 4. |
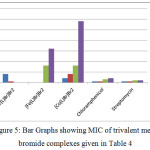 |
Figure 5: Bar Graphs showing MIC of trivalent metal bromide complexes given in Table 4. |
Proposed Structure
On the basis of above reported studies like elemental analysis, conductivity measurements, magnetic moments, IR, NMR, electronic spectra, mass spectra and X-Ray Diffraction studies, a square pyramidal geometry may be proposed for all the synthesized trivalent macrocyclic metal complexes as shown in fig.6.
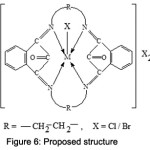 |
Figure 6: Proposed structure. |
Conclusion
The complexes formed are only soluble in Dimethylformamide and Dimethyl sulphoxide. The insolubility of these complexes in other organic solvents as compared to the fragments, have been an important character which helped to remove the by- products and extract these complexes in pure form.
The NMR spectrum of these synthesized macrocyclic metal complexes could not be obtained as these do not form a clear solution due to the presence of the transition metal. Instead, the structure of the ligand was confirmed separately to ensure cyclization and then the macrocyclic metal complexes were prepared by template method. A square pyramidal geometry of complexes is proposed for all trivalent macro-cyclic metal complexes.
Macrocyclic complexes of trivalent cobalt as chlorides show comparable anti microbial activities to the standards. The complexes of trivalent chromium as bromides show antimicrobial activities for the Gram+ve bacteria, B. stearothermophilus (MTCC 8508) and Gram-ve bacteria, E. coli (MTCC 51). Their MIC values are close to the standard antibiotics.
Acknowledgements
The authors are thankful to Punjab Technical University Jalandhar, Director, SBS State Technical Campus, Ferozepur and Director (SAIF) Punjab University Chandigarh for providing the required technical support for analysis.
References
- Healy M De S; Rest A J.; “Advances in inorganic chemistry and radiochemistry”. 1978, 21.
- Lindoy, L. F,; “The chemistry of macrocyclic ligand complexes”, Cambridge University press, New York. 1989.
- Fox, O D,; Drew, M. G. B,;Wilkinson, E J S,; Beer, O P,; Chem Commun. 2000, 319.
- Tarafdar, M T H,; Saravanan N,; Crouse, K A,; Transition Met Chem, 2001, 26, 613.
- Ali, M A,; Haroon, C M,; Nazimudin M,; Majumdar, S M M,; Tarafdar M T H, Khair, M A, Transition Met Chem. 1992,17, 133.
- Al,i M A,; Haroon, C M,; Nazimudin, M,; Majumdar S M M,; Tarafdar M T H,; Khair M A,; Indian J Chem. 1988, 27A, 1064.
- Hufford, C, D,; Clark, A. M,; “Studies in Natural Product Chemistry,” ed Atta-Ur Rahman, Elsevier. 1988, 2, 421.
- Singh, D. P,; Kumar, K,; Sharma, C,; Eur J Med Chem. 2009, 44, 3299.
- Singh, D. P,; Mehani née Chopra Rimpi,; Pesticide-Biochemistry and Physiology. 2010, 98, 110–114.
- Singh, D. P,; Mehani née Chopra Rimpi,; Asian J Chem. 2010, 22, 6252-6256.
- Singh, D. P,; Kumar, K,; Mehani née Chopra Rimpi,; Spectrochimica Acta Part A: Molecular and Bimolecular Spectroscopy. 2011, 78, 629-634.
- Hamdi, N., Medyouni, R., Sulaiman Al-Ayed, A., Mansour, L., & Romerosa, A. Journal of Heterocyclic Chemistry. 2017, 2342-2351.
- Geary W J,; Coord. Chem. Rev. 1971, 7, 81.
- Balasubramanian, S,; Krishnan, C. N,; Indian J Chem. 1985, 24A, 608.
- Gupta, L. K,; Chandra, S,; Transition Met Chem. 2006, 31, 368.
- Teotia, M. P,; Gurtu, J. N.; & Rana, V. B,; Indian J Chem. 1980, 19A, 133.
- Ferraro, J. R,; “Low frequency Vibrations of Inorganic and Co-Ordination Compounds”, Part B, (5th Edition,Wiley Interscience, New York. 1997.
- Chandra, S,; Gupta, K,; Transition Met Chem. 2002, 27, 196.
- Figgis, B. N,; “The Magnetic Properties of the Complex Ions. Introduction to ligand fields”, Ist Ed., Wiley Interscience: New York. 1996, 272-281.
- Wood, J. S,; Prog Inorg Chem. 1972, 16, 227.
- Mehani née Chopra Rimpi, Rasayan J. Chem., 2018, 11, 694–701.
- Lever, A. B. P,; ”Inorganic Electronic Spectroscopy”, 2nd Ed., Elsevier, Amsterdom. 1984.
- Jensen, K. A,; Jorgensen, C. K,; Acte Chem Scand. 1965, 19, 451.
- McFarland J,; “The Nephelometer: an instrument for estimating the number of bacteria in suspensions used for calculating the opsonic index and for vaccines.” J Am Med Assoc. 1907, 49, 1176.
- Saxena, N,; Juneja, H. D. & Munshi, K. N,; J Indian Chem Soc. 1993, 70, 943.
- Suryawanshi, D. D,; Gaikwad, S. T,; & Rajbhoj, A. S,; Chemical Science Tranction. 2014, 3(1), 117-122.
- Bhattacharya, K. C,; “An elementary Physics for Indian School”, the Indian` Press Ltd. Allahabad. 1934, 105.
- Sakr, S.H.; Elshafie, H.S.; Camele, I.; Sadeek, S.A. Molecules. 2018, 23, 1182.
- Singh, D. P., Grover, V., Rathi, P., & Jain, K. 2017, 10, S1795–S1801.

This work is licensed under a Creative Commons Attribution 4.0 International License.
![]()
A New Edition of Web of Science
Journal Impact Factor
2022: 0.5
Five Year: 0.8
Journal is Indexed in

Cabells Whitelist
![]()


