Rosella (Hibiscus sabdariffa) Flowers as Alternative Indicators of Blue and Red Litmus
Siti Nuryanti1 , Dwi Juli Puspitasari*2 and Supriadi1
1Faculty of Teacher Training and Education, Tadulako Universty, Palu 94118, Indonesia.
2Faculty of Mathematics and Natural Sciences, Tadulako University, Palu 94118, Indonesia.
Corresponding Author E-mail: dwijulipuspitasari@gmail.com
DOI : http://dx.doi.org/10.13005/ojc/350163
Article Received on : 15-08-2018
Article Accepted on : 31-01-2018
Article Published : 22 Feb 2019
The red and blue litmus indicators are an indispensable indicator for practicum in secondary school and higher education. The research has been done to make alternative indicator of litmus with rosella flower material. The procedures were rosella flowers were extracted, the filtrate was isolated by column chromatography, then the isolated compounds were analyzed using UV-Vis, FTIR, 1-HNMR. The alternative indicator of red litmus is made by acid-activated paper, then the paper was macerated into the isolated compound solution. Meanwhile, The alternative indicators of blue litmus were made by similar to the red litmus, but the paper was activated by base. The comparative indicators were blue and red litmus. The isolated compound which acts as an indicator is a cyanidin-3-glycoside compound. The color change of rosella indicator paper is the same as the comparison indicator.
KEYWORDS:Alternative Indicator; Blue Litmus; Red Litmus; Rosella Flowers
Download this article as:| Copy the following to cite this article: Nuryanti S, Puspitasari D. J, Supriadi S. Rosella (Hibiscus sabdariffa) Flowers as Alternative Indicators of Blue and Red Litmus. Orient J Chem 2019;35(1). |
| Copy the following to cite this URL: Nuryanti S, Puspitasari D. J, Supriadi S. Rosella (Hibiscus sabdariffa) Flowers as Alternative Indicators of Blue and Red Litmus. Orient J Chem 2019;35(1). Available from: https://bit.ly/2GEoCfs |
Introduction
Laboratory experiments are demanded for the implementation of contextual based learning. The Studying process of chemistry need a proof in the laboratory because chemistry is abstract. Understanding of chemical reaction requires a practicum so in the Chemistry course, practicum is an integral part with theory. Studying chemical change requires a verification between theory and real observation in the laboratory. For example, to distinguish an acid or base solution that is both colorless requires an indicator that can distinguish both types of solution.
The acid-base indicators are materials that are practiced in high school of exact department. This indicator gives an indication of whether a compound is acidic or alkaline by giving a different color to a specific pH range. In acid-base titrations, the indicators used are from synthetic compounds. The use of synthetic indicators such as methyl orange, phenolphthalein and litmus become obstacles in the implementation of practicum in high school. The price is expensive because the materials and processes used are synthetic materials.1 Therefore, there is a need to replace indicators of natural materials that are easy to obtain, cultivated, harmless, low cost and environmentally friendly.
Parts of plants such as stems, leaves, fruits, and flowers mostly contain flavonoid group pigments. The pigment is anthocyanin. Some research on the presence of anthocyanin such as in plants Euphorbia mili, Erythrina varigata and Nelumbo nucifera2 Rose (Rosa setigera), Allamanda (Allamanda cathartica), and Hibiscus (Hibiscus rosa-sinensis) flowers3 Wora wori flowers.4 The anthocyanin pigment shows color changes in different pH ranges of red, blue and colorless.5,6,7 Therefore, the colored parts of plant parts which contain anthocyanins can be used as a raw material for making acid-base indicators.8
The color change in acid and base solutions can be a guide in determining whether a material can be an acid-base indicator. From previous research on the isolation of anthocyanin from rosella flowers, roselle flower extract containing anthocyanin that will give red in acid and green in alkaline.7 Based on these, it is very possible that rosella flowers can be used as the basic material of alternative indicator of red and blue litmus paper.
Red and blue indicators are indispensable for practicum in High School. The difficulty of obtaining such indicators leads to limited experimental acid-base experiments, this occurs in schools that are located in rural areas. The benefit of this research is that an indicator of rosella flowers can be used as an alternative of the red and blue litmus. The success of this research can increase the economis value of rosella, because the rosella was a hedge plant yard. The urgent benefit is to assist the ministry education overcome obstacles in implementation of laboratory practicum at high schools in rural areas. Long-term benefits will utilize the natural materials that is easily cultivated and environmental friendly, so that the need for acid-base indicators, especially red and blue litmus indicators for practical implementation on the chemical laboratory can be fulfilled.
Experimental Section
Materials
The Chemicals used in this study were: n-hexane, methanol, ethanol, ethyl acetate, TLC plates, silica gel 60, 70-230 mesh, HCl 1%, 1% NaOH, HCl 1% in methanol (v / v methanol), n-buthanol, distilled water, Whatman paper no. 1, red and blue litmus. Rosella flowers from Petobo Sigi Biromaru, Palu, Central Sulawesi, Indonesia.
Instrumentation
The Instrumens used in this study were: shaker for extraction (IKA® KS 130 basic), rotary evaporator (Buchii R-124), electric bath, dryers, Buchner funnel, analytical balance (METLER AT 200), FT-IR (Shimadzu Prestge- 21), TLC scanner (Camac3), UV-Vis (array Miltonroy 3000), 500 MHz 1 H-NMR 125 MHz (JEOL JNM ECA 500), micro pipettes (SOLOREK Switzerland) and Column chromatography (length 60 cm, diameter 2 cm ).
Procedure
Extraction of Rosella Flowers
Exactly 500 g fresh colored rosella flowers was weighed, cut into small pieces. They were put in a dark colored bottle, after that they were extracted by using solvent that have different polarity. The maceration was done according to the procedure of.7
Activated carbon was washed by demineralized water in the shaker for 30 minutes then filtered and washed again using boiling water for 15 minutes to remove salt on from its the surface of activated carbon. After that, activated carbon filtered and was dried at 105°C for 3 hours. 20 grams of activated carbon were reactivated in 100 mL HCl 5 % for 5 hours at room temperature. The activated carbon was separated and then washed by aqua demineralized until the pH of solution was neutral (pH=7). The activated carbon then redried at 80°C for 48 hours.
Isolation Antosianidin from Rosella Flowers
Isolation of rosella flower extract began with thin layer chromatography (TLC). The procedure and solvent were done as procedure of.7 Furthermore, anthocyanidins was separated by column chromatography. Structure of anthocyanidins was identified by UV-Vis, FT-IR and 1 H-NMR.9
Making Paper Indicators as an Alternative to Litmus
Before papers were tested with acid and base solutions, papers were activated by maceration using acid to adsorb anthocyanin. The procedure was done as procedure of.4
The Trials Indicators as an Alternative To Litmus
The dry blue and red Indicators of rosella flower were dipped in a solution of HCl 1%, respectively. The color of blue indicator turned red but the red indicators were colorless. Using the same procedure, the dry blue and red indicator of rosella flowers were dipped in 1% NaOH. The color of red indicator turned blue but the blue indicator were colorless. The color changes is the same as litmus indicator.
Results and Discussion
Extraction of Rosella Flowers
The red extract was provided by extracting rosella flowers with methanol. After identification with NH3 vapor, the color turn to be blue which indicating that methanol solvent can extract anthocyanins. Based on the trial results, the extract of rosella flower in acid solution is red and blue in base solution.
The UV-Vis Spectrophotometer analysis showed that the maximum wavelength is at (λ max) 519 nm. Anthocyanin has an typical absorption λ max in the region between 465-560 nm.10 The analysis concludes that methanol extract contained anthocyanin. The analysis UV – VIS Spectrophotometer of rosella flower extract is shown in Figure 1.
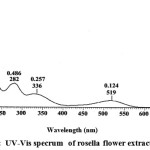 |
Figure 1: UV-Vis specrum of rosella flower extract. |
Isolation Antosianidin From Rosella Flowers
Based on result of column chromatography (CC) with eluent n-butanol : HCl 1% (4 : 1,5), 2 number spot (Rf 0.74), the color of isolate with NH3 vapor was blue. Then the extract was separated and analyzed by UV- Vis resulting the absorption wavelength is at 537 nm. It can be seen qualitatively that the isolation contained anthocyanin.
Based on the FTIR Analysis, the absorption band at 1641.8 cm -1 showed the vibration range of conjugated C-O bond with double bond of carbon-carbon, which is likely refer to C-O bond in purilium ring (C ring). C = C bonds come from the core of benzene that provides an absorption band at 1582.7 cm-1.. The typical absorption bands of C = C bonds likely overlap with the absorption of conjugated C-O, so that this absorption band is stretched. The absorption bands at 1449.5 cm -1 indicates that the nucleus of benzene contains substituents.11
According to 1H-NMR spectrometer analysis, it was obtained 7 types of protons with different chemical environments. Signal (δ 9.0442 ppm, singlet, 1 H) describes proton in C-4 atom on C ring. Signal (δ 8.2890 to 8.2729 ppm, duplet, J = 8.5 Hz, 1 H) and (δ 7.0245 to 7.0174 ppm, duplet, J = 8.5 Hz 1 H) show two aromatic protons of B ring mutually at ortho position, ie C-5 ‘and C-6’ proton, respectively. While signal (δ 8.0515 to 8.0497 ppm, duplet, J = 1.25 Hz, 1 H) is derived from C-2′ proton experiencing meta coupling with C-6′ proton. Furthermore, two singlet peaks of (δ 6.9030 ppm, singlet, 1 H) and (δ 6.5669 ppm, singlet, 1 H) represent two protons in B ring at C-8 and C-6. The presence of sugar group is presented by proton through the absorption of sugar group with integrate 7 protons in chemical shift from 3.9008 to 3.3114 ppm. A proton aromatic ring (H-6 and H-8) gives the signal at δ = 6.80 and 7.10 ppm, while B proton aromatic ring appear at δ = 7.50 to 7.70 ppm.12 Based on anthocyanin identification with color reagent, Pb acetate, UV-Vis, FT-IR, and 1H-NMR, it can be seen that rosella flower extract contain anthocyanin sianidin 3-glucoside (Figure 2).
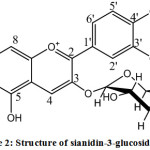 |
Figure 2: Structure of sianidin-3-glucoside (13).
|
Making of Indicator Paper as Alternative Material of Litmus Substitute
Paper was activated with HCl 1% solution, then it macerated with sianidin-3-glycosides solution, the color turned red. This is caused by flavilium cation in the anthocyanin molecule is stable in acid solution.14
The anthocyanin structure (I), red in acidic condition, when the pH is raised (pH <4) will form a colorless carbinolbase (III) and subsequently toutomeri equilibrium forms khalkon (IV). At pH <6, it undergoes a structural change to anhidrobase (II). The expansion of the delocal bond cause a stronger color change in intensity and produce a blue color. The anhydrobase provides absorption at the wavelength region (λ max) 610 nm.3 Changes in the structure of anthocyanin sianidine in various pH ranges are shown in Figure 3.
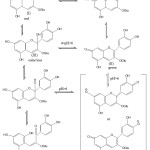 |
Figure 3: Changes structure of anthocyanin sinanidin-3-glukosida in various ranges of pH (11). |
When the red indicator paper was immersed in alkaline solution, H at the OH group in the cation of flavilium formed a quinoid base. The expansion of the delocal bond resulted in a stronger color change in intensity and resulting in a blue color of quinoid or anhydrobase bases. The quinoid or anhydrobase base uptake λ max region at 610 nm (15). The results of the analysis with the UV-Vis spectrophotometer are shown in Figure 4.
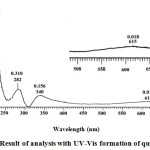 |
Figure 4: Result of analysis with UV-Vis formation of quinoid base. |
Phenolptalein indicator has a characteristic that is a compound that gives a color change to pH change of solution. Color changes can occur through balance process of molecular and ionic forms of indicator compounds. Process of ionic equilibrium change is followed by color change from colorless under acidic conditions to red under alkaline conditions. The shape of structural changes which follows change of color in phenolptalein compound as in Fig. 5.
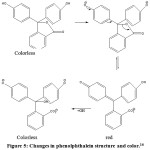 |
Figure 5: Changes in phenolphthalein structure and color.16 |
Paper pH from rosella flowers have advantages compare to wora wori flowers. pH Paper pH from rosella flowers have clearer color change and longer storage time than paper pH from wora wori flowers.
Conclusion
The rosella flowers contain anthocyanins sianidin-3-glucoside which acts as an indicator. The color of compounds turn to be red in acid solution and blue in base solution. The indicator paper is an alternative to litmus that is made from rosella flowers in which they can change color to be red in acid solutions and blue in base solutions. The color change is the same as comparative indicator of red and blue litmus.
Acknowledgements
The author thanks to the Head of the Organic Chemistry Laboratory of University of Gadjah Mada, which has provided facilities for analysis using UV-Vis, FTIR, 1HMNR, the Head of Herbarium Laboratory of Tadulako University Palu, which has helped to identify a rosella plant as a research samples.
References
- Nuryanti, S., Matsjeh,S., Anwar, C., dan Raharjo, T,J., J. Agritech., 2010, 30(3), 178-183.
- Burungale, S. H. and Mali, A. V., J. of Chemical and pharmaceutical Research, 2014, 6(5), 901-903.
- Okoduwa, S. I. R., Lovina O. M., Matthew E. A. and Ameh A. A, J. Biochemistry Research International, 2015, vol. 2015, Article ID 381721, 1-6, http://dx.doi.org/10.1155/2015/381721.
CrossRef - Nuryanti, S., in A. Price (chief ed.), Paper Indicator of Wora-wari Flowers (Hibiscus rosa-sinensis L.), 3 th ICRIEMS (International Conference on Reseach, Implementation, and Education of Mathematics and science), 2016, C.95-98.
- Abbas, S. K., J. of Innovations in Pharmaceuticals and Biological Sciences, 2014, 1(2), 72-76,
- Pimpodkar, N.V., Surve, N.V., Bhise, S. H., J. of Current Pharma Research, 2014, 4(2), 124-127.
- Nuryanti, S., Matsjeh, S., Anwar, C., Raharjo, T,J., and Hamzah, B., Eur. J. Chem, 2013, 4(1), 20-24.
CrossRef - Nuryanti, S., Matsjeh, S., Anwar, C., and Raharjo, T.J., Indonesian Journal of Chemistry, 2012, 12(2), 167-171.
CrossRef - Adje, F., Lozano, Y.F., Meudec, E., Lozano, P., Adima, A., Agbon’zi, G. and Gaydou, E.M., 2008, Molecules, 2008, 13, 1238-1245.
CrossRef - Anderson, Q.M., Fecent, T., Torskangerpoll, K., Forcen, A. and Hauge, U., Phytochem., 2004, 65, 405-410.
CrossRef - Silverstein, R.M., Bassler, G.C. and Morrill, T.C., Spectrometric Identification of Organic Structure Compounds, 5th Edition, John Wiley & Sons, Inc., Singapore, 1991, pp 117-118.
CrossRef - Mabry, TJ, Markham, KR and Thomas, MB, The Systematic Identification of Flavonoids, Springer Verlag, New York, 1970, pp 135-158.
CrossRef - Zhang, Y., Seeram, N.P., Lee, R., Feng, L. And Heber, D., 2008, J.Agric, Food Chem., 2008, 56, 670-675.
CrossRef - Laleh, G.H., Frydoonfar, R., Heldary, R., Jamee and Zare. S., J. Nutr., 2006, 5(1), 90-92.
- Ologundudu, A., Ologundudu, O.A., Ololade, I.A. and Obi, F.O., J. Afr. Biochem., Research, 2009, (4), 140-144.
- Supratman, U., Elucidation of Organic Compound Structure: Spectroscopy Method for Determination of Organic Compound Structure, 2010, Widya Padjajaran, Bandung. p.20.

This work is licensed under a Creative Commons Attribution 4.0 International License.
![]()
A New Edition of Web of Science
Journal Impact Factor
2022: 0.5
Five Year: 0.8
Journal is Indexed in

Cabells Whitelist
![]()


