Recovery of Glutaric acid by Reactive Extraction using Tri-n-Octylamine in Different Biodiesels
Shourabh Singh Raghuwanshi* , Ashwani Kumar Rathore and Sunder Lal Pal
Department of Chemical, Engineering MANIT Bhopal, India.
Corresponding Author E-mail: shourabh.raghuwanshi@gmail.com
DOI : http://dx.doi.org/10.13005/ojc/350144
Download this article as:
![]()
This paper is aimed to recover Glutaric acid from aqueous solution by using Tri-n-Octyl amine in different biodieselsthrough an experimental investigation by reactive extraction. Here Glutaric is extracted by reversible complexion reaction with tri-n-octylamine extractant present in three types of biodiesel- sunflower, sesame and rice bran. The distribution coefficients (KD) for experimental investigation system comes out to be (9.38-25.37) for sunflower biodiesel, (9.61-30.88) for sesame biodiesel and (10.62-29.92) rice bran diesel. The determined loading ratios (Ø) were in the range (0.27-4.05) for sunflower biodiesel, (0.27-4.02) for sesame biodiesel and (0.27-4.05) rice bran biodiesel, indicating overloading of the extractant. A very high average extraction efficiency (%E) is in the range of (90.36-96.20) for sunflower biodiesel, (90.57-96.86) for sesame biodiesel and (91.40-96.30) rice bran biodiesel) were obtained in the present investigation.
KEYWORDS:Batch Process; Diluent; Extractant; Glutaric Acid; Reactive Extraction
Introduction
Glutaric acid is a five-carbon chained naturally occurring white crystalline dicarboxylic acid with pKa1=4.31 and pKa2=5.41. It is also a part of blood and urine. It is used in the production of polyester, polyols, polyamides, ester plasticizers, and corrosion inhibitors as well as the synthesis of pharmaceuticals, surfactants, and metal finishing compound. Industrially it is produced through the ring-opening of butyrolactone followed by hydrolysis, and biologically through microorganisms, it can be via lysine degradation.1-2 Theproduced Glutaric acid needs to be recovered from fermentation broth without killing the microbes. Precipitation is one of the most preferred method for its extraction but has a problem of generated salt disposal. Reactive extraction has shown a lot of in separating carboxylic acid from the fermentation broth or wastewater streams.3-4 Reactive extraction makes use of toxic extractants and diluents to get high extraction efficiency but cannot be useful for in-situ extraction, so there are a need and scope to develop a nontoxic system for recovery of Glutaric acid. One of the way for reducing the toxicity of solvent(extractant+diluent) is to use nontoxic diluent to avoid direct contact of extractant and microorganisms is prevented.Recently a lot of work is available in the literature involving vegetable oils as diluents for the recovery of carboxylic acids using high molecular weight amines or organophosphorus compounds(extractants) but no work is done on the separation of Glutaric acid using natural oils.5-13 The current study focuses on Glutaric acid recovery usingtri-n-octylamine extractant in biodiesels (diluent) to explore the extraction feasibility.
Materials and Methods
Chemicals and Reagents
Glutaric acid (GA) (Assay > 0.99%) and Tri-n-octylamine (TOA) (Assay > 0.95%) were supplied by Sisco Research Laboratories Pvt. Ltd., Mumbai, Maharashtra, Biodiesels (sunflower oil, sesame oil and rice bran oil) were supplied by a local vendor at Bhopal. Phenolphthalein indicator (pH 8.2–10.0) was supplied by Merck life science Pvt. Ltd., Mumbai, India. The sodium hydroxide used in the experiments was of reagent grade, and 0.1 N solution was prepared by dissolving an appropriate amount in de-ionized water. All the chemicals were used without further purification. De-ionized (DI) water was used for all the experiments and standardization of sodium oxide was done by 0.1N oxalic acid.
Method
The extraction experiments were performed by pouringequal volumes of aqueous and organic phases in a conical flask and then shaking at a temperature of 298K in microprocessor controlled shaking incubator. The mixture was shaken for 12 h and then centrifuged at 6000 rpm for 20 minutes to separate the two different phases.Organic phase being lighter is at the top of the aqueous phase. Aqueous phase acid concentration was determined by titration with .1 N NaOH solution after standardization. The acid content in the organic phase was determined by a mass balance.
Theory of Reactive Extraction
The dissociation of weak carboxylic acidslike Glutaric acid is generallyneglected as it is very small for weak acid. The reactive extraction of the Glutaric acid by TOA extractant can be represented as given in equation (1).14
![]()
By the law of mass action, an interaction between the extractant and the extracted species to Extraction equilibrium constant (KS) can be written as:
Ks = [(GH)m .(TOA)p]org. /[GH]m aq. [TOA]porg. (2)
Where [GH]aq represents Glutaric acid(concentration ) in the aqueous phase and [TOA]org., [(GH) m.(TOA)p]org or [GH]org represents concentration of extractants and acid complex in the organic phase and Ks depends upon properties of acids and the solvation(dissolving capacity) of the diluent used.
The extraction efficiency (%E) is defined by following experimentally measured distribution coefficient (KD) as:
% E= KD×100/ (1+ KD) (3)
Prediction of Models of Complexes Based on Øvalues
The Loading ratio (the extent of loading of the organic phase (extractant + diluent) with carboxylic acid) is given below as:
The loading ratio (Ø) can be used to predict the nature of various types of complexes between acid and extractant that can be formed. The possible forms of complexes are (1:1, 2:1 and 3:1) and all depends on the values of Ø. At lowvalues of Ø< 0.5, (1:1) complex is formed. For higher values of Ø> 0.5, the formation of (1:2 and 1:3) complexes is a possibility.
Results and Discussion
The recovery of Glutaric acid from the aqueous solution so far has been studied by using three extractants [Tri-n-Octyl amine(TOA), Tri butyl Phosphate (TBP) and Tridodecylamine (TDDA)] in various diluents. The TOA was chosen for the present studies due to high reactivity and easy availability at low cost. The biodiesels were used in the study as they are nontoxic and has better flow properties as compared to vegetable oils.TOA (Tri-n-Octylamine) was added to the biodiesel oils also to resolve the toxicity issues which is preventing in situ extraction of it from a fermentation broth.
Experiments were performed to extract Glutaric acid by varyinginitial acid concentration and concentration of TOA in biodiesels. The results obtained are given in tables 1-3, and the chemical equilibrium of extraction of glutaric acid using TOA(Tri-n-Octylamine) in biodiesel sunflower oil, sesame oil and rice bran oilrespectively are shown in Fig. 1 – 3. It can be seen that the addition of 10%-30% TOA in sunflower oil biodiesels has a favorable effect on the degree of extraction (E%). Theaverage degree of extraction reaches 91.68%(10% TOA)-95.50% (30% TOA) in sunflower oil biodiesel, 91.19%-10% TOA)-96.35% (30% TOA) in sesame oil biodiesel and 92.00%-10% TOA)-96.30% (30% TOA) in rice bran oil biodiesel. This increase in E% clearly suggests that extractant is highly efficient and diluent is also compatible for extraction (as it is readily solvating the complex formed in the reaction).
Table 1: Extraction equilibrium of Glutaric acid and TOA in sunflower oil at 298 K.
| TOA (v/v%) | [GH]INI. mol/litre | [GH]aq. | [GH]org | KD=[GH.]org./ [GH]aq. | Ave. KD | E%=KD/1+KD*100 | Ave. E% | Ø |
| 10 | 0.2 | 0.01926 | 0.18073 | 9.38 | 11.12 | 90.36 | 91.68 | 0.7926 |
| 10 | 0.4 | 0.03371 | 0.36629 | 10.86 | 91.56 | 1.6065 | ||
| 10 | 0.6 | 0.04816 | 0.55184 | 11.45 | 91.96 | 2.4203 | ||
| 10 | 0.8 | 0.06381 | 0.73618 | 11.53 | 92.01 | 3.2288 | ||
| 10 | 1 | 0.07464 | 0.92535 | 12.39 | 92.53 | 4.0585 | ||
| 20 | 0.2 | 0.01384 | 0.18616 | 13.45 | 15.00 | 93.07 | 93.72 | 0.4064 |
| 20 | 0.4 | 0.02528 | 0.37472 | 14.82 | 93.67 | 0.8181 | ||
| 20 | 0.6 | 0.03708 | 0.56292 | 15.18 | 93.81 | 1.2290 | ||
| 20 | 0.8 | 0.04816 | 0.75184 | 15.61 | 93.97 | 1.6415 | ||
| 20 | 1 | 0.05899 | 0.94100 | 15.95 | 94.10 | 2.0545 | ||
| 30 | 0.2 | 0.01161 | 0.18839 | 16.22 | 21.88 | 94.19 | 95.50 | 0.2746 |
| 30 | 0.4 | 0.01962 | 0.38038 | 19.38 | 95.09 | 0.5544 | ||
| 30 | 0.6 | 0.02383 | 0.57617 | 24.17 | 96.02 | 0.8398 | ||
| 30 | 0.8 | 0.03166 | 0.76834 | 24.26 | 96.04 | 1.1200 | ||
| 30 | 1 | 0.03792 | 0.96204 | 25.37 | 96.20 | 1.4023 |
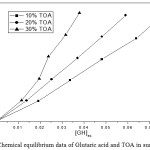 |
Figure 1: Chemical equilibrium data of Glutaric acid and TOA in sunflower oil. |
Table 2: Extraction equilibrium of Glutaric acid and TOA in Sesame oil at 298 K.
| TOA (v/v%) | [GH]INI. mol/liter | [GH]aq. | [GH]org | KD=[GH]org./ [GH]aq. | Ave. KD | E%=KD/1+KD*100 | Ave. E% | Ø |
| 10 | 0.2 | 0.01884 | 0.18116 | 9.61 | 10.40 | 90.57 | 91.19 | 0.7945 |
| 10 | 0.4 | 0.03708 | 0.36292 | 9.78 | 90.72 | 1.5917 | ||
| 10 | 0.6 | 0.05315 | 0.54685 | 10.28 | 91.13 | 2.3984 | ||
| 10 | 0.8 | 0.06622 | 0.73378 | 11.08 | 91.72 | 3.2183 | ||
| 10 | 1 | 0.08145 | 0.91855 | 11.27 | 91.85 | 4.0287 | ||
| 20 | 0.2 | 0.01384 | 0.18616 | 13.45 | 17.93 | 93.07 | 94.56 | 0.4064 |
| 20 | 0.4 | 0.02383 | 0.37617 | 15.78 | 94.04 | 0.8213 | ||
| 20 | 0.6 | 0.03226 | 0.56774 | 17.59 | 94.62 | 1.2396 | ||
| 20 | 0.8 | 0.03612 | 0.76388 | 21.14 | 95.48 | 1.6678 | ||
| 20 | 1 | 0.04406 | 0.95593 | 21.69 | 95.59 | 2.0871 | ||
| 30 | 0.2 | 0.00842 | 0.19157 | 22.75 | 26.83 | 95.78 | 96.35 | 0.2792 |
| 30 | 0.4 | 0.01565 | 0.38434 | 24.55 | 96.08 | 0.5602 | ||
| 30 | 0.6 | 0.02185 | 0.57815 | 26.45 | 96.35 | 0.8427 | ||
| 30 | 0.8 | 0.02618 | 0.77382 | 29.55 | 96.72 | 1.1280 | ||
| 30 | 1 | 0.03136 | 0.96864 | 30.88 | 96.86 | 1.4120 |
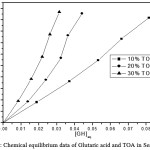 |
Figure 2: Chemical equilibrium data of Glutaric acid and TOA in Sesame oil. |
Table 3: Extraction equilibrium results for Glutaric acid and TOA in ricebran oil at 298 K.
| TOA (v/v%) | [GH]INI. mol/liter | [GH]aq. | [GH]org | KD=[GH.]org./ [GH]aq. | Ave. KD | E%=KD/1+KD*100 | Ave. E% | Ø |
| 10 | 0.2 | 0.01721 | 0.18278 | 10.62 | 11.48 | 91.40 | 92.00 | 0.8016 |
| 10 | 0.4 | 0.03311 | 0.36689 | 11.08 | 91.72 | 1.6091 | ||
| 10 | 0.6 | 0.04816 | 0.55184 | 11.45 | 92.03 | 2.4203 | ||
| 10 | 0.8 | 0.06146 | 0.73853 | 12.01 | 92.36 | 3.2391 | ||
| 10 | 1 | 0.07525 | 0.92475 | 12.28 | 92.53 | 4.0559 | ||
| 20 | 0.2 | 0.01193 | 0.18806 | 15.76 | 18.16 | 94.03 | 94.73 | 0.4106 |
| 20 | 0.4 | 0.02252 | 0.37747 | 16.76 | 94.38 | 0.8241 | ||
| 20 | 0.6 | 0.03369 | 0.56630 | 16.80 | 94.43 | 1.2364 | ||
| 20 | 0.8 | 0.03704 | 0.76295 | 20.59 | 95.40 | 1.6658 | ||
| 20 | 1 | 0.04562 | 0.95437 | 20.92 | 95.43 | 2.0837 | ||
| 30 | 0.2 | 0.00823 | 0.19176 | 23.30 | 26.14 | 95.88 | 96.30 | 0.2795 |
| 30 | 0.4 | 0.01587 | 0.38412 | 24.20 | 96.04 | 0.5599 | ||
| 30 | 0.6 | 0.02210 | 0.57789 | 26.14 | 96.34 | 0.8424 | ||
| 30 | 0.8 | 0.02822 | 0.77177 | 27.34 | 96.50 | 1.1250 | ||
| 30 | 1 | 0.03234 | 0.96766 | 29.92 | 96.77 | 1.4105 |
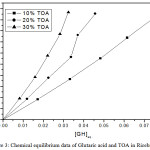 |
Figure 3: Chemical equilibrium data of Glutaric acid and TOA in Ricebran oil. |
The average distribution coefficient also changes from 11.12 (10% TOA)-21.88 (30% TOA) in sunflower oil biodiesel, 10.4 (10% TOA)- 26.83 (30% TOA) in sesame oil biodiesel and 11.48 (10% TOA)- 26.14 (30% TOA) in rice bran oil biodiesel. The average distribution coefficient increases with TOA is in the following order sesame oil biodiesel > rice bran oil biodiesel >sunflower oil biodiesel.
Effect of Extractant on Initial Acid Concentration for Reactive Extraction of Glutaric Acid
Table 1-3 gives the values of extraction efficiency (%E) for the reactive extraction by TOA in biodiesel oils for acid concentrations (0.2,0.4,0.6,0.8 and 1 mols/liter). It is found that the extraction efficiency increases with the increase in TOA concentration for all biodiesel oils at all initial acid concentrations but the increase in efficiency is not large as compared with the increase in the percentage of the extractant. One of the reasons may be due to poor solvation of complex in the diluent.
Extraction Mechanism Based on Loading Values (Ø)
The loading values were found to decrease with the increase in TOA percentage indicating limiting amount of extractant available in the batch extraction system resulted in the overloading of acid molecules. Table 1-3 and Fig. 4-6 shows the effect of loading of the extractant (Z) with the increase in TOA concentration. It is also worth noting that loading values decrease with the increase in TOA concentration for all initial acid concentrations in biodiesel oils. There is a decrease in the values of loading factor decreases due to increase in extractant concentration as now more acid is available for a reaction with acid molecules and but poor solvating resulting in the marginal increase in extraction efficiency.
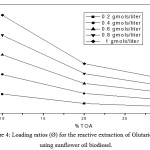 |
Figure 4: Loading ratios (Ø) for the reactive extraction of Glutaric acid using sunflower oil biodiesel. |
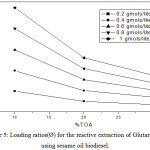 |
Figure 5: Loading ratios (Ø) for the reactive extraction of Glutaric acid using sesame oil biodiesel. |
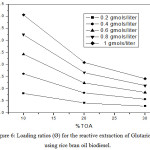 |
Figure 6: Loading ratios (Ø) for the reactive extraction of Glutaric acid using rice bran oil biodiesel. |
Conclusion
The reactive extraction of glutaric acid by using TOA dissolved in biodiesels made from oils of sunflower, rice bran and sesame was investigated. The distribution coefficients (KD), loading factors (Ø), and extraction efficiencies (%E) were obtained for this batch extraction system. The extraction efficiencies obtained by the system of TOA in biodiesels for the extraction of glutaric acid are highest as per values available in the literature. The loading values were higher than 0.5 indicating the formation of higher complexes.
Conflict of Interest
There is no conflict of Interest.
Acknowledgements
Laboratory Facilities provided by Maulana Azad National Institute of Technology (MANIT), Bhopal (India) is greatly acknowledged.
References
- Hong, Y.G.; Moon, Y.M.; Hong, J.W.; No, S.Y.; Choi, T.R.; Jung, H.R.; Yang, S.Y.; Bhatia, S. K.; Ahn, J.O.; Park, K.M.; Yang, Y.H. Enzyme and Microbial Technology, 2018, 118, 57-65.
CrossRef - Athankar, K.K.; Wasewar, K.L.; Varma, M.N.; Shende, D.Z. J Chem Eng Process Technol., 2017, 8(2), 326.
- Pehlivanoğlu, N.; Uslu, H.; Kırbaşlar, Ş.İ. J. Chem. Eng. Data, 2009, 54, 3202–3207.
CrossRef - Uslu, H.; Inci, I. Chem. Eng. Technol., 2009, 32, 1951–1957.
CrossRef - Harington, T.; Hossain, Md. M. Desalination., 2008, 218, 287-296.
CrossRef - Kar, A.; Bagde, A.; Athankar, K.K.; Wasewar, K.L.; Shende, D. Z. Journal of Chemical Technology and Biotechnology., 2017, 92, 2825-2834.
CrossRef - Keshav, A.; Norge, P.; Wasewar, K.L. Applied Biochemistry and Biotechnology., 2012, 167, 197–213.
CrossRef - Keshav, A.; Wasewar, K.L.; Chand, S. Journal of Chemical Technology and Biotechnology., 2009, 84, 484-489 .
CrossRef - Marti, M.E. SUJEST., 2017, 5, 26-37.
CrossRef - Uslu, H.; Gemici, A.; Gok, A; Kirbaslar, I. J Chem Eng Data., 2014, 59(11), 3767-3772.
CrossRef - Waghmare, M.D.; Wasewar, K.L.; Sonawane, S.S.; Shende,D.Z. Industrial and Engineering Chemistry Research., 2011, 50, 13526–13537.
CrossRef - Waghmare, M. D.; Wasewar, K. L.; Sonawane, S. S.; Shende, D. Z. Separation and Purification Technology., 2013, 120, 296-303.
CrossRef - Wasewar, K. L.; Shende, D. Z.; Keshav, A. Journal of Chemical Technology and Biotechnology., 2011, 86, 319-323.
CrossRef - Kertes, A.S.; King, C.J. Biotechnology and Bioengineering., 1986, 28, 269–282.
CrossRef
Accepted on: 01-01-2019


![]()


