Polarographic Performance of Some Azo Derivatives Derived from 2-Amino-4-Hydroxy Pyridine and its Inhibitory Effect on C- Steel Corrosion in Hydrochloric Acid
1Department of Chemistry, Faculty of Science. Benha University, Benha, Egypt.
2Department of Chemistry, Faculty of Applied Science, Umm Al-Qura University, Makkah, Saudi Arabia.
3Department of Chemistry, Faculty of Science, Princess Nourah bint Abdulrahman University. Riyadh, Saudi Arabia.
Corresponding Author E-mail: metwally555@yahoo.com
DOI : http://dx.doi.org/10.13005/ojc/350111
Download this article as:
![]()
The polarographic performance of five azo compounds derived from 2-amino-4-hydroxypyridine was studied in BR buffer series of pH 2-12. The polarograms of all azo compounds in strong acidic solutions gave a single irreversible diffusion-controlled 4-electron wave representing the splitting of the N=N group to the amine stage but in alkaline solutions 2-electron irreversible wave is obtained corresponding to the reduction of the azo center to the hydrazo stage. For NO2 substituted derivative, approximately two equal waves were observed in the acidic solutions, , but in the alkali, the rise of the second wave is approximately twice that of the first wave. The effect of substituents on electrode reaction was investigated and the kinetic parameters were calculated. The mechanistic pathway was proposed and interpreted. The dissociation constants of the tested azo compounds were examined by potentiometric methods and the M-L formation constants of their complexes with some transition metal ions were computed. Application of the investigated azo compounds as inhibitors of dissolution of carbon steel in in 1MHCl solutions was inspected using potentiodynamic polarization technique. The results indicated that these compounds inhibit C-steel corrosion in HCl solutions and the inhibition efficiency reached 81% in presence of 1x10⁻³ M of the inhibitors. The efficiency of the inhibitors follows the following sequence: III> II > I > IV > V This arrangement is consistent with the sequence of the E1/2 and the pka values of these azo compounds.
KEYWORDS:Aminopyridine Azo; Corrosion Inhibitor; Polarography; Potentiometry
Introduction
Azo compounds are among the profoundly classes of organic compounds. Their chromophore is an aromatic system jointed to the azo group and the common auxochromes are NR2, NH2 or OH groups. Azo dye compounds are widely used as chromophoric and chelating agents in analytical and coordination chemistry.1-3 Also, they have very important applications in different fields of biology manufactures such as photo-sensitizers,4,5 and sensors.6,7 On the other hand, pyridine and its derivatives are the important chemical compounds with enormous applications in diverse fields such as medicine and biological activities, for example their uses as anti-microbial, anti-cancer, anti-malarial, anti-oxidant, and enzyme inhibition.8 Therefore, the electrochemistry of these compounds has been the subject of interest of many studies because of the reliable relationship between the biological activities of these compounds and their redox potentials. Moreover, The presence of aromatic rings and functional groups containing nitrogen and oxygen atoms is likely to increase the adsorption of these compounds on the surface of the steel leading to increased inhibition efficiency. These compounds are therefore widely used as inhibitors to prevent corrosion of metals and alloys.9-15
Azo dyes are usually electrochemically active and the redox chemistry of such compounds was investigated mainly using polarography and cyclic voltammetry techniques. These compounds have been reduced to the hydrazo or the amine stages based on the chemical formula of the compound, the nature of the electrolysis medium and the substituent groups in the molecule. Also, the values of the dissociation constant and pH of the solution play a key role in the definition of the electrode reaction mechanism for such compounds.16
Continuing our research on the voltammetry of azo compounds26-33 and the inhibition of dissolution of C- steel in acidic media,33-38 the aim of this study was conducted to follow the electrode reaction mechanistic pathway, evaluation of some electrochemical kinetic parameters and the use of the present pyridine azo compounds to retard the dissolution of C-steel in hydrochloric acid solutions to derive the relationship the correlation between the half-wave potentials, the dissociation constants and the inhibition efficiencies of these compounds.
Experimental
Preparation of Solid Azo Dyes
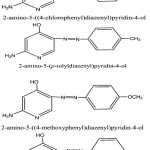
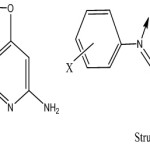
The azo dye compounds were synthesized under investigation by common method applied in preparing azo dye derivatives of aromatic amines.39,40 The aromatic amines involve aniline, p-chloroaniline, m-nitroaniline, p-toludene and p-anisidine, 0.01 mole was converted to the hydrochloride form by adding the least amount of 1:1 HCl and then diluted with distilled water and cooling at – 5°C.Cooled solution of NaNO2 (0.01 mole) is added gradually with continuous flipping to the amine salt. The resulting solution is permitted tostand for 15 minutes with constant flipping until the entire Azo dye is created. Azo compounds gained are filtered, dried and reconstituted in ethanol. The azo dyes were characterized by by elemental analysis of elements, IR and 1Hnmr spectra. The test azo compounds have the following structural formula:
 |
Scheme (A) |
Polarograhpic Measurements
Depolarizer Solutions
Stock solutions of 2×10⁻²M were prepared for each of the azo I-V compounds by dissolving the exact weight of the solid compound in the appropriate volume of ethanol. The required concentration was obtained by accurate dilution.
Universal Buffer Solutions
A 0.4 M of each of phosphoric acid and acetic acid was prepared by precise dilution of a concentrated stock. A 0.4 M of boric acid as prepared by dissolving the appropriate weight of the recrystallized acid in bi-distilled water. A stock acid mixture was prepared by mixing equal volumes of the three acids to obtain a total molarity of the acid mixture of 0.4 M. A series of pH 2.0-12 was prepared as designed by Britton.41 The pH of the buffer solution was checked using a pH meter Hanna instrument model HI 1312.
The Electrolysis Cell
The used cell for polarographic measurements consists of a saturated calomel electrode and a dropping mercury (Hg) as a working electrode. The capillary used has the properties, m = 1.7 mg/sec, t = 3.6 sec at a Hg height (h) = 60 cm.
Instruments
The current-potential curves were registered by a pen recording Sargen=Welech polarography model 400.
Potentiometric Measurements
Preparation of Solutions
A 0.1M of HCl was prepared by diluting an accurate volume of AR concentrated solution of the acid and standardized using a standard 0.1 M solution of Na2CO3 solution. A 1.0 M solution of KCl was prepared by dissolving an accurate weight of KCl in bi-distilled water.
Working Procedure
Three mixtures A, B and C were prepared as follows:
(A) 5 ml of 0.1M HCl + 5 ml of 1.0M KCl.
(B) Mixture of (A) + 5 ml of 0.0004M of ligand (azo compound).
(C) Mixture of (B) + 1 ml of 0.0004M of metal ions dissolved in bi-distilled water.
The three mixtures were then completed to 50 ml with convenient volumes with bi-distilled water and ethanol to obtain 20% (v/v) ethanol aqueous solution, and then titrated with 0.02 M NaOH solution containing 20% (v/v) ethanol using an automatic micro-burette with fixed flipping and measuring the pH after allowing sufficient time for equilibrium attainment.
Corrosion Measurements
Preparation of Inhibitors Solutions
25 ml of 0.005M was prepared for each of the azo I-V compounds by dissolving the exact weight of the solids in absolute ethanol.The desired concentration was obtained by accurate dilution.
Chemical Composition of Carbon Steel(CS)
The chemical composition of CS type L-52 utilized in this work has the following (wt%) ) 0.26 C,1.35Mn, 0.04P,0.03S,.0.02V,0.03Ti ,0.005Nb and the remainder is Fe.
Potentiodynamic Polarization (PDP) Measurements
PDP technique were performed in a three-electrode glass cell. The working electrode was CS of the above composition of 1 cm2 area. A platinum foil of 1 cm2 was used as counter electrode, a saturated calomel electrode (SCE) was used as the reference electrode. The CS electrode was polished with series grades of emery papers reached to 1200 grit size, washed with bi-distilled water and degreased with acetone. The electrochemical measurements were performed out using Mensberger Potentiostat /Galvanostat PS6 with a software PS remote.All the experiments were carried out at a sweep rate of 10 mV/sec.
Results and Discussion
DC-Polarographic Studies
Current-Potential Curves
The dc-polarograms of azo compounds I-V were registered in Britton-Robinson buffer solutions of pH 2-12 containing 10% (v/v) ethanol to insure the complete solubility of the azo compounds in the aqueous medium. The polarograms of the azo compounds I-IV shows a single reduction polarographic wave within the entire pH range. The limiting current (il of the polarographic wave is gradually reduced with rising the pH of the solution. The wave height in the strong acidic solutions (pH 3) is almost twice that obtained in strong alkaline solutions (pH 9). Fig. 1 represents a typical example of the polarograms of the investigated azo compounds. However, for azo compound V (m-NO2), the polarograms within the entire pH range consist of two waves of unequal height (Fig. 2). The behavior of the first wave is similar to that in case of azo compounds I-IV, but for the second wave, the limiting current in strong alkaline solutions is almost equal that observed in strong acidic ones. On plotting the limiting current (iL) versus the pH of the first wave, a Z-shaped curve is obtained (Fig. 3) shows that the number of electrons implicated in the reduction process along the first in acidic solutions is double that contribute in alkaline ones.
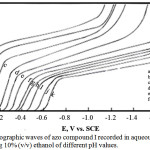 |
Figure 1: DC-polarographic waves of azo compound I recorded in aqueous buffer solutions containing 10% (v/v) ethanol of different pH values. |
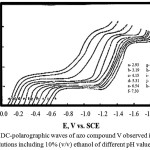 |
Figure 2: DC-polarographic waves of azo compound V observed in aqueous buffer solutions including 10% (v/v) ethanol of different pH values. |
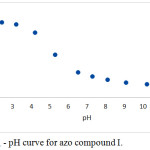 |
Figure 3: iL – pH curve for azo compound I. |
Nature of Polarographic Waves
Nature of polarographic waves was performed by studying the impact of Hg pressure (h) on the limiting current (il) and analysis of the polarographic waves. The effect of (h) on (il) was carried out at diverse pH values illustrated that the reduction process of azo compounds I-V is controlled fundamentally by diffusion. This suggestion is achieved from plotting the relation between the mercury pressure (h) and the limiting current (iL), by plotting (log il) versus (log h ),straight line is obtained42 with slope values ranging between 0.49 and 0.59. The thermodynamic reversibility of electrode processes was tested from the logarithmic analysis of the polarographic waves according to the fundamental equation of Meites.43 The straight lines obtained from plotting Ede versus (id/id-i) have slope values (S1). From these slopes values (Table 1), the transfer coefficient (α) values was calculated and less than 0.5 was found (Table 1) at na = 2.0 in acidic solution and na = 1.0 in alkaline ones (na the number of electrons concerned in the rate-determining step).These results accomplished that the reduction process of all the azo compounds I-V occurred irreversibly. Further inspection of the data of Table 1 indicates that the E1/2 shifted to the more negative potential by rising the pH of the solution indicating that the proton uptake precedes the electron transfer.44 The plots of E1/2 versus pH are straight lines of two segments with slopes (S2). From these slope values (Table 1), the number of protons (ZH+) participating in the rate-determining step was calculated using the equation45:
dE1/2 / d(pH) = [(0.0951) ZH+] / αna (1)
The data obtained revealed that, the rate-determining step of the electrode reaction involves one proton and two electrons in acidic solutions, whereas it involves one proton and one electron in neutral and alkaline ones (Table 1).
Table 1: DC – Polarographic data of azo compounds (I-V) in buffer solutions of various pH values.
|
Compounds. |
pH |
il (μA) |
-E1/2 (V) |
S1(mV) |
S2(mV) |
α |
ZH+ |
δ logi/δ logh |
|
|
na=1 |
na=2 |
||||||||
|
I |
3.2 |
2.40 |
0.11 |
77 |
57 |
0.77 |
0.38 |
0.74 |
0.75 |
|
7.3 |
1.41 |
0.35 |
83 |
57 |
0.71 |
0.35 |
0.67 |
0.69 |
|
|
10.2 |
1.18 |
0.52 |
91 |
57 |
0.65 |
0.32 |
0.63 |
0.63 |
|
|
II |
3.2 |
2.00 |
0.11 |
83 |
70 |
0.53 |
0.26 |
0.53 |
0.56 |
|
7.0 |
1.30 |
0.36 |
82 |
70 |
0.61 |
0.30 |
0.56 |
0.65 |
|
|
10.2 |
1.08 |
0.55 |
91 |
70 |
0.78 |
0.39 |
0.71 |
0.83 |
|
|
III |
3.2 |
1.94 |
0.19 |
67 |
53 |
0.89 |
0.44 |
0.79 |
0.69 |
|
7.3 |
1.32 |
0.41 |
71 |
53 |
0.64 |
0.32 |
0.75 |
0.65 |
|
|
10.2 |
1.05 |
0.60 |
77 |
53 |
0.77 |
0.38 |
0.69 |
0.69 |
|
|
IV |
3.2 |
2.08 |
0.21 |
100 |
62 |
0.71 |
0.35 |
0.62 |
0.64 |
|
7.3 |
1.28 |
0.43 |
95 |
62 |
0.72 |
0.36 |
0.65 |
0.65 |
|
|
10.2 |
1.05 |
0.63 |
75 |
62 |
0.65 |
0.32 |
0.83 |
0.67 |
|
|
V |
3.2 |
2.30a |
0.11 |
76 |
45 |
0.76 |
0.38 |
0.59 |
0.59 |
|
2.30b |
0.99 |
100 |
55 |
0.53 |
0.26 |
0.55 |
0.50 |
||
|
7.3 |
1.60a |
0.35 |
66 |
60 |
0.88 |
0.44 |
0.91 |
0.60 |
|
|
1.50b |
1.33 |
60 |
35 |
0.85 |
0.42 |
0.58 |
0.58 |
||
|
10.2 |
1.30a |
0.53 |
60 |
70 |
0.94 |
0.47 |
1.17 |
0.64 |
|
|
1.30b |
1.38 |
65 |
60 |
0.86 |
0.44 |
0.92 |
0.62 |
||
S1 = 0.0591/ αna S2 = δE1/2/pH ZH+ = S2/S1 (a) 1st wave (b) 2nd wave
Kinetic Parameters
The heterogeneous rate constant, kf,h of the electrode reaction of azo compounds I-V was calculated from dc-polarographic data at different pH values based on Koutecky equation46 which is simplified according to the following equation47:
log k°f,h = log [i / id – i] + log x (2)
In which the intercept x = Do1/2 / 0.87 t1/2. The values required for of the diffusion coefficients of the compounds I-V were computed using Ilkovic equation. From the data given in Table 2 denotes that the heterogeneous rate constant, kof,h, is decreased with increasing the pH of the solution, since the electrode reaction becomes more due to the decrease in hydrogen ions and the irreversibility of the system is increased. Also, the corresponding energy of activation G*, of the electro-reduction process was determined by the next equation.46,47:
ΔG* = 5778.8 (5.097 – log kof,h) (3)
Increase GG * with the pH increase of the median which the irreversibility of the reduction.
Increase of G* with increasing pH of the medium reveals the irreversibility of the reduction process. Rising the pH of the solution required higher energy of activation to achieve reduction process which in turn increases irreversibility.
Table 2: Kinetic parameters obtained from dc-polarography for azo compounds (I-V) at various pH values.
|
Compd. |
pH |
kof,h, cm/s |
∆G*, kJ |
|
I |
3.2 |
5.19×10⁻⁸ |
299.1 |
|
7.3 |
3.24×10⁻¹¹ |
376.5 |
|
|
9.1 |
2.46×10⁻¹² |
412.1 |
|
|
II |
3.2 |
5.45×10⁻⁹ |
322.3 |
|
7.3 |
6.96×10⁻¹³ |
416.7 |
|
|
9.1 |
4.01×10⁻¹³ |
422.5 |
|
|
III |
3.2 |
9.08×10⁻⁸ |
293.2 |
|
7.3 |
9.25×10⁻¹¹ |
365.5 |
|
|
9.1 |
7.27×10⁻¹³ |
416.3 |
|
|
IV |
3.2 |
4.98×10⁻⁸ |
299.5 |
|
7.3 |
8.3×10⁻¹⁰ |
342.4 |
|
|
9.1 |
3.86×10 |
422.9 |
|
|
V |
3.2 |
3.03×10⁻⁹ |
328.8 (a) |
|
4.18×10⁻¹⁵ |
470.4 (b) |
||
|
7.3 |
5.35×10⁻¹³ |
419.5 (a) |
|
|
1.61×10⁻²⁴ |
697.9 (b) | ||
|
9.1 |
2.90×10⁻¹⁶ 3.30×10⁻²⁶ |
510.0 (a) 738.6 (b) |
(a) First wave (b) second wave.
Effect of Substituents in the Phenyl Ring
The influence of inserting different substituents (X) in the para- or meta-position of the phenyl ring on the E1/2 of the polarographic waves of azo compounds I-V was performed by correlation the Hammett substituent constants (ϭ) with the half-wave potential (E1/2). The values of (ϭ) were gained from the tabulation of Ritchie and Sager.48 The plots of E1/2 versus ϭx at pH 3,0 and 9.0 showed linear correlations (Fig. 4) of positive slopes (ρπ,R). In a solution of pH 9.0, the use of ϭNHOH instead of ϭNO2 for linear fit that supports our reaction mechanism of reduction of the NO2 which is suggested below. The overall trend is negative shift of the E1/2 of the azo compound I on introducing electron-donating groups such as p-OCH3 (III)or p-CH3 (IV), where as electron-withdrawing groups such as p-Cl (II) or m-NO2 (V) displayed a positive shift due to decreasing of the basicity of the un-protonated nitrogen atom linked to the aryl moiety. This behavior denotes that groups that donate electrons impede electrode reaction and require higher energy. Moreover, electron-withdrawing substituents facilitate the electrode reaction and therefore the less energy is required.
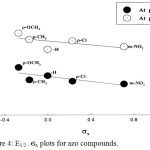 |
Figure 4: E1/2 – ϭx plots for azo compounds. |
Determination of the Total Number of Electrons
To suggest the electrode reaction mechanism, the total number of electrons participate in the reduction process (n) should be determined. This was achieved by using the following methods:
Using Ilkovic Equation
In this method the values of the diffusion coefficients (Do) of azo-I-V compounds were computed in both acidic and alkaline solutions using Stock-Einstein equation49:
Do = 3.22×10⁻⁵ /(Vm)1/3. (4)
The molar volume (Vm) of the investigated azo compounds was used by the simple density bottle method. In this work, 10% (v/v) ethanol was utilized, thus the correct values of Do were calculated in this medium and given in Table 2. On applying Ilkovic equation, the number of electrons transferred in the electro-reduction process of azo compounds I-IV was calculated and found to be 4 electrons in acidic solutions and 2 electrons in alkaline ones. For azo compound V, 8 electrons were transferred in the acidic solutions, whereas 6 electrons were transferred in alkaline ones (Table 3).
Using Controlled Potential Electrolysis (Coulometry)
To compute the total number of electrons involved in the electro-reduction process experimentally, controlled potential coulometry was performed. In this technique, the potential of the working electrode (Hg pool) was adjusted at the current limiting value of the polarographic wave. The buffer current is first measured and cancelled, then the appropriate concentration (1 x 10⁻⁴ M) of the depolarizer (azo dye) is inserted into the electrolysis cell and the electrolysis is continues to complete. The The charge quantity, Q, in coulombs is measured directly from the digital coulometer. The total number of electrons (n) involved in the electro-reduction process is calculated using the equation: Q = nFw/M, in which w is the weight of the azo dye in grams and M its molecular weight. The measurements were done in buffer solutions of pH 3 and 9 for azo compound IV as a typical example and the data obtained are given in Table 3. To verify the electrolysis products, the complete electrolyzed solution of the azo III was concentrated in pH 3.0 to half its volume by evaporation on a water bath and the insulating components were removed by extraction with the ether. TLC revealed from ethereal extract that two points were obtained. When comparing the two spots with the authentic p-anisidine sample, the latter was found to be one of the main electrolysis products, which confirmed the N = N bond cleavages in acidic solutions. On the other hand, on repeating the same experiment in a solution of pH 9 the TLC extract showed one spot only. Based on the foregoing results and in terms of structural genesis, the reduction mechanism could be suggested as shown in Scheme 1.
Table 3: Data of controlled potential electrolysis (coulometry) of 10-4 g of azo compounds (I-V) in buffer solutions of different pH values.
|
Compd. |
M. Wt, g/mol |
pH |
Potential (V) |
Diffusion coefficient, cm2/s |
Q, Coulomb |
Total number of electrons (n) |
|
I |
214.21 |
3.2 10.2 |
0.30 0.80 |
3.6×10⁻⁶ |
0.18062 0.09099 |
4.01 (3.99)* (a)2.02 (2.09)* (b) |
|
II |
248.66 |
3.2 10.2 |
0.20 0.75 |
2.4×10⁻⁶ |
0.159910.07955 | 4.10 (4.13)* (a)2.05 (4.14)* (b) |
|
III |
228.24 |
3.2 10.2 |
0.35 0.75 |
2.0×10⁻⁶ |
0.16402 0.07821 |
3.88 (3.50)* (a)1.85 (1.79)* (b) |
|
IV |
244.00 |
3.2 10.2 |
0.40 0.75 |
2.4×10⁻⁶ |
0.15738 0.07474 |
3.98 (4.08)* (a)1.89 (2.06)* (b) |
|
V |
259.20 |
3.2 |
0.35 1.25 |
3.7×10⁻⁶ |
0.14853 0.14704 |
3.99 (4.03)* (a)3.95 (3.90)* (b) |
| 10.2 |
0.70 1.40 |
0.07371 0.14406 |
1.98 (2.01)* (a)3.87 (3.50)* (b) |
*Total number of electron calculated from Ilkovic equation, (a) 1st wave, (b) 2nd wave.
Mechanism of the Electrode Reaction
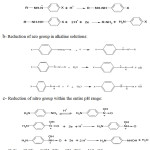 |
Scheme 1 |
Potentiometric Studies
Proton-ligand Dissociation Constants
The values of the acid dissociation constants (pka) of azo-I-V compounds I-V were determined from the titration curves from titrating HCl solution (1×10⁻³ M) with 0.02 M NaOH solution in devoid of and containing the investigated azo compounds (ligands). The titration was performed at ionic strength (µ = 0.1M) adjusted by the addition of KCl solution. The potentiometric curves of the azo I compound are represented in Fig.5A as a typical example. Proton-ligand dissociation constants of the investigate azo compounds were determined using the method of Irving and Rossitti50 as adopted by Fronaeus.51 The average number of protons attached to the ligand molecule (nA) is determined at different pH values applying Fronaeus equation51:
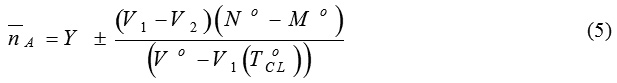
where: Y is the total number of dissociable protons attached to the ligand, No is the molarity of the sodium hydroxide solution, Mo is the molarity of the hydrochloric acid solution, V1 and V2 are the volumes of sodium hydroxide required to reach a definite pH value for the free acid titration curve and for that acid in presence of a ligand, respectively, ToCL is the total concentration of the ligand in molar scale and Vo is the initial volume of the titrated solution (50 ml).
On plotting nA against pH, proton-ligand formation curves are obtained (Fig. 5b). The values of proton-ligand dissociation constants of the azo compounds I-V were obtained by interpolation at half values of nA (i. e, nA = 0.5. 1.5. 2.5). The maximum nA value was found to be one, deonating that the present azo compounds have only one dissociation constant at nA = 0.5 (Table 5). The results obtained revealed that the proton-ligand dissociation constants of the examined azo compounds decreased in order: II > III > IV > I > V and these dissociation constants are affected by the inductive or mesomeric effect of the substituent. In the present study, the p-CH3 and p-OCH3 derivatives (III & IV) have a less acidic character (higher pka values) than the p-Cl and m-NO2 ones (II & V). This is quite reasonable because the electron-donating groups reinforce the electron density by their high positive inductive or mesomeric effect, whereby a strong O-H bond is formed. On the other hand, the electron-with a drawing groups p-Cl and m-NO2 will cause the opposite effect. i. e, higher acidic character (lower pka values).
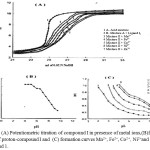 |
Figure 5: (A) Potentiometric titration of compound I in presence of metal ions,(B)formation curves of proton-compound I and (C) formation curves Mn2+, Fe2+, Co2+, Ni2+and Zn2+ with compound 1. |
Determination of the Stability Constants of Metal Complexes
The potentiometric titration of the investigated azo compounds in presence of 10-4 M of Mn2+, Fe2+, Co2+, Ni2+and Zn2+ ions was carried out at ionic strength 0.1M KCl and 10-3 M hydrochloric acid. The pH-metric curves of azo compounds (I) in presence of the metals ions are shown in Fig. 5A. It is clear that the metal – ligand titration curves are well separated from those of the ligand titration curve, indicating that the complexation took place with the release of hydrogen ions. The stability of the metal-ligand constants was assessed from the formation curves. The average number of reagent molecules attached per metal ion, n–, and the free ligand exponent. pL , are computed using the equations51:
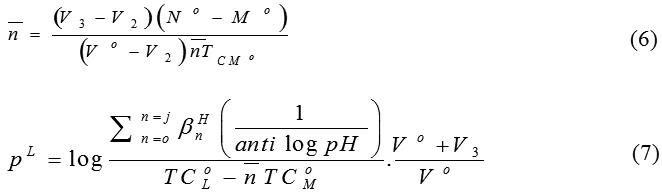
where V3 is the volume of sodium hydroxide needed to reach the same pH in the titration of the complex formation, TCo M is the total metal ion concentration and βH is the overall proton – ligand formation constant. The values of and pL for the investigated compounds were computed at different pH values. The formation curves (Figure omitted for brevity) are constructed on plotting the average number of ligand attached per metal ion
![]()
versus the free ligand exponent (pL)(Fig.5C). In the present study, the maximum
![]()
value was found to be 1.0 confirming the possibility of formation only of ML type of complexes. The values of the step wise stability constants were determined by interpolation of
![]()
values at 0.5 according to the half
![]()
method and summarized in Table (5). For 1:1 ((metal-ligand) complexes, the ligand can react with the metal ions, for example Fe2+ ions via two routes to give structures I and II (scheme II). In structure II six membered ring is formed while in structure I five membered is formed. Since six membered rings are more stable than five membered one , thus the structure II is the more preferable complex formed.
 |
scheme (b) |
Table 4: Proton-ligand dissociation constants and stepwise stability constants of ML complexes of ligands (I-V) in water-ethanol mixture containing 0.1 M KCl.
| Comp. | pka | Mn | Fe | Co | Ni | Zn |
| I | 7.90 | 3.50 | 4.01 | 5.60 | 6.86 | 7.40 |
| II | 8.01 | 4.32 | 5.93 | 6.75 | 7.00 | 7.20 |
| III | 8.12 | 5.64 | 6.40 | 6.91 | 7.20 | 7.42 |
| IV | 8.30 | 3.69 | 5.70 | 5.73 | 6.90 | 6.65 |
| V | 7.75 | 3.32 | 3.70 | 4.60 | 7.00 | 7.81 |
Corrosion Studies
Fig. 6 illustrates the PDP curves of the C- steel in 1 M HCl with and without various concentrations (1×10⁻⁵-1×10⁻³ M) of azo compound (I) as a typical example for this series (not shown) at 25°C. Inspection of Fig. 6 reveals that the inhibitor shifts the anodic curves towards the positive direction and the cathodic curves towards the active one. This behavior suggested the inhibitory action of the azo compounds. Various electrochemical parameters such as the anodic Tafel slopes (βa) and the cathodic Tafel slopes (βc), the corrosion potential (Ecorr), the corrosion current density (Icorr), the percentage inhibition efficiency (IE%) and the surface coverage (q) were computed and given in Table 5. The values of Tafel slopes (βa & βc) are slightly altered by rising the concentration of azo compounds, indicating a mixed type effect on the corrosion mechanism.52 The values of Ecorr is shifted to more active direction but when the concentration of azo compounds increases the values is approximately constant indicating these compounds act as mixed type inhibitors mainly cathodic. The values of Icorr is lowered by rising the concentration of azo compounds .This is proved the inhibiting action of these compounds. The values of IE% and θ of the used azo compounds were computed using the following equation:
% IE = (1 – Iadd / Ifree) x 100 (8)
θ = I – Iadd / Ifree (9)
where, Iadd and Ifree are the corrosion current densities in devoid of and containing the inhibitor, respectively.
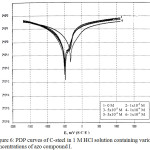 |
Figure 6: PDP curves of C-steel in 1 M HCl solution containing various concentrations of azo compound I. |
Adsorption Isotherm
Azo dyes (I-V) inhibit the corrosion of C- steel in HCl solutions by adsorbing it on the steel surface. Trials were performed to match the values of (θ) to different isotherms such as Langmuir, Temkin, Frumkin and Freundlich. To a large extent, the results were better fitted by applying Langmuir isotherm according to the next equation:
C/ θ = 1/K + C (10)
In which C is the concentration of the inhibitor and K is the equilibrium constant of the adsorption process. The plot of C/ θ against C gives a straight line of intercept 1/K. The plot is shown in Fig. 7. The resulted straight line has almost the unit slope, which indicates that the adsorption of azo dyes (I-V) on the C-steel surface follows Langmuir isotherm. This indicated that ther are no interaction or repulsion forces between the adsorbed molecules.
Table 5: Electrochemical parameters of corrosion of C-steel in 1.0 M HCl solution in absence and presence of azo compounds (I-V), at 25°C.
| Comp. | Concen. | – Ecorr | Icorr | Bc | Ba Rcorr. | %IE | θ | |
| (M) | mV(SCE) | µA/cm2 | mV/dce | mV/dce | Mm/year | |||
| blank | 0.0 | 324 | 0.243 | 178 | 185 | 8.042 | – | – |
| 1×10⁻⁵ | 523 | 0.121 | 172 | 167 | 3.988 | 50 | 0.50 | |
| I | 1×10⁻³ | 543 | 0.089 | 175 | 120 | 2.96 | 63 | 0,63 |
| 563 | 0.063 | 145 | 1365 | 2.083 | 74 | 0.74 | ||
| 1×10⁻⁵ | 485 | 0.085 | 191 | 109 | 3.487 | 65 | 0.57 | |
| II | 1×10⁻⁴ | 495 | 0.063 | 165 | 118 | 2.664 | 74 | 0.67 |
| 1×10⁻³ | 509 | 0.044 | 184 | 109 | 1.693 | 78 | 0.83 | |
| 1×10⁻⁵ | 485 | 0.085 | 191 | 109 | 2.684 | 65 | 0.65 | |
| III | 1×10⁻⁴ | 495 | 0.063 | 165 | 118 | 2.061 | 74 | 0.74 |
| 1×10⁻³ | 512 | 0.044 | 184 | 109 | 1.473 | 81 | 0.81 | |
| 1×10⁻⁵ | 470 | 0.073 | 165 | 122 | 2.403 | 70 | 0.70 | |
| IV | 1×10⁻⁴ | 484 | 0.051 | 158 | 144 | 1.689 | 78 | 0.78 |
| 1×10⁻³ | 499 | 0.032 | 183 | 87 | 0.498 | 86 | 0.86 | |
| 1×10⁻⁵ | 483 | 0.128 | 203 | 130 | 4.245 | 47 | 0.47 | |
| V | 1×10⁻⁴ | 505 | 0.109 | 164 | 139 | 3.543 | 55 | 0.55 |
| 1×10⁻³ | 515 | 0.072 | 166 | 71 | 2.387 | 70 | 0.70 | |
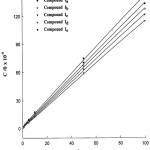 |
Figure 7: Langmuir adsorption isotherms. |
Mechanism of Inhibition
It is generally known that the inhibitory effect of organic compounds containing S, N,or/and O atoms is due to the formation of a co-ordination type bond between the M atom and the lone pair of electrons in in the additive molecule. The tendency to form this type of bond can be enhanced and thus the extent of inhibition by increasing the density of the active electrons in the functional group of the inhibitor.53 In aromatic or heterocyclic ring compounds, the effective electron density in the functional group can be changed by introducing different substituents in the ring that lead to a different molecular structure. The inhibitory effect of the azo test compounds was found to depend on both the nature and the concentration of the inhibitor. The results obtained indicated that inhibition of corrosion is due to adsorption of the inhibitor molecules in the metal/solution interface, thus corrosion inhibition can be interpreted in terms of adsorption properties [54]. However, the efficiency of inhibition of added compounds based on many factors including the number of active absorption centers in the molecule and their charge density, molecular structure, molecular size and mode of adsorption on the surface of the metal.
To give more light on the mechanism of interaction between the azo dye and metal surface, potentiometric measurements were done to calculate the stability constants of the tested inhibitors (azo dyes). It was found that the stability of these azo compounds follows the sequence:
OCH3 > CH3 > H > Cl > NO2
From the above sequence, compounds containing electron-donating groups are more efficient to inhibition than those containing electron withdrawing groups. This behavior can be interpreted by the fact that, the electron donating groups increase the charge density at the azo moiety and consequently the negative charge of the azo dye molecule is increased leading to more adsorption and the surface area covered by inhibitor molecules increases and consequently the inhibition efficiency is increased. This is satisfactory agreed with the data obtained from polarography (Table 1) in which the E1/2 values shifted to negative side in the same order:
OCH3 > CH3 > Cl > H > NO2
This negative shift increases the stability of these compounds to electro-reduction in the same order. This can be ascribed by the relation between the inhibition efficiency and the E1/2 values illustrated in Fig. 8. On the other hand, it was found that the adsorption increases as the pka value of the tested azo dyes is increased, i.e., as the stability of the azo compounds increases (Fig. 9).
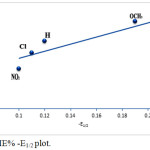 |
Figure 8: IE% -E1/2 plot. |
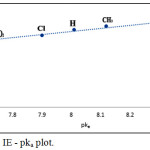 |
Figure 9: % IE – pka plot. |
Conclusion
Azo compounds derived from 2-amino-4-hydroxy pyridine were examined using polarographic measurements. The results mentioned that these compounds were reduced in acidic solutions via a single 4-electron, irreversible diffusion-controlled polarographic wave corresponding to the cleavage of the azo center to the corresponding amine, but in alkaline solutions only saturation of the azo center via two electrons was occurred. The kinetic parameters of the electrode reaction were computeed, and the electrode reaction mechanism was postulated and discussed. The effect of substituents on the reduction process was investigated. The stability of the tested azo compounds (pka) and the formation constants of their complexes were calculated with some transitional metal ions using a potentiometric measurement. Azo compounds were used as effective inhibitors of C-steel corrosion in 1.0M HCl solution using PDP measurements. The results revealed that these compounds inhibit successfully the corrosion of carbon steel and the inhibition efficiency reached a maximum value of 81% depending on the functional groups in the additives.
References
- Menek. N.; Topcu, S.; Ucar, M. Analytical letters. 2001, 34(10), 1733-1740.
- Fraga; S.B.; Goncalves; M. T.;Moura;J. P.; Rani, K. Eureopean. J. Org. Chem. 2004, 8, 1750-1760.
- Shaghaghi; Z. Spectrochim. Acta 2014,131 A ,67-71.
- Ruyffelaere; F.; Nardello,V.; Schmidt, R.; Audry; J. M. J. Photo. and Photobiology A: Chem., 2006, 183(1-2) , 98-105.
- El-Mekawi, D.; Abdel-Mottaleb, M.S. Int.. J. Photoenergy, 2005, 7(2), 95-101.
- Grafe, A.; Haupt, K.; Mohr, G. J. Analytica Chimica Acta. 2006, 565, 42-47.
- Zhang, D.Q.; Zhang, M.; Liu, Z.Q.; Yu, M.X.; Li Fy. ; Yi T. Tetrahedron Letters. 2006, 47, 7093-7096.
- Altaf, A.A; Shahzad, A.; Gul, Z.; Rassol, N.; Badshah, A.; Lal, B.; Khan; E. J. Drug Design and Medicinal Chem. 2015, 1(1), 1-11.
- Pojtanabuntoeng, T.; Salasi, M. Electrochem. Acta. 2017, 258, 442-452.
- Deyab, M.A.; Zaky M.T. ; Nessim M.I. J. Mol. Liq., 2017, 229, 396-404.
- Morales-Gill, P.; Walczak, M.S.; Camargo, C.R.; Cottis, R.A.; Romero, I.M.; Lindsay, R., Corr.Sci. 2015, 101, 47-55.
- Abdallah M.; Hegazy, M.A.; Alfakeer, M; Ahmed, H. Green Chem. Lett.Rev. 2018, 11(4), 457-468.
- Fawzy, A; Abdallah, M.; Alfakeer, M; Ali, H. M. Int. J. Electrochem. Sci., 2019, 14, 2063-2084.
- Abdel Hameed, R. S.; Alfakeer, M; Abdallah, M. Surf. Eng. Appl. Electrochem. 2018, 54(6), 599-506.
- Abdallah, M.; Hatem, M. Altass; AL Jahdaly,B. A.; Salem, M. M. Green Chem. Lett.Rev.2018, 11(3), 189-196
- Kariyajjanavar, P.; Narayana, J.; Nayaka, Y.A; Umanak, M.J. Port. Electrochim., 2010, 28(4), 265-277.
- Tsemeugne, J.; Fonfgo, E.S.; Tamokoy, J.; Tonle, I.; Kengne, I.C; Ngangamy, A.D; Lacmata, S.T.; Rohand, J.; Kuiate, J.R.; Sodengam, B.L. Chem. Cent. J., 2016, 11, 119-132.
- Magool, H.; Ganesh, S.D.;Chandra U.; Kumaraswamy, B.K.; Pal, V.K., Research J.Chem.Sci., 2013, 3(10), 44-50.
- Syamim, Z.N.; Mohamad, Y.H.; Zulkhairi,O. Health and Env. J., 2012, 3(1), 79-83.
- Harisha S., Keshavayya J., Swamy B.E.K., Viswanath C.C, Dyes and Pigments, 2017, 136, 742-753.
- Menek N., Karaman Y., Dyes and Pigments, 2006, 68, 101-108.
- Atia, S.;Boudehane, A.; Zobeldi A.; Douadim, T.; Lounas, A.; Al-Noaimi, M.; Gherraf, N. Res. J.Pharm., Biological and Chem. Sci., 2017, 8(6), 840-847.
- Karamn, Y.; Menek, N.; Bicerand, F.A.;Olmez;H., Int. J. Electrochem. Sci. 2015, 10(4), 3106-3116.
- Karaman, Y.;Menek, N. J. Electrochem. Soc., 2012, 159(10), 805-810.
- Mabrouk, E.M; Felaly, R.N.; El-Mossalamy, E.H. Int. J. Electrochem. Sci., 2016, 11(6), 4892-4908.
- Mabrouk, E.M; Issa, Y. M.; Ghoneim, M. M; Amerah, T. Bull Electrochem., India, 1987, 3, 321-325.
- Ghoneim, M. M; Issa Y. ,M.; Mabrouk, E.M.; Amerah, T. J. Electrochem. Soc., India, 1986, 35, 267-272.
- Killa, H.M.; Mabrouk, E.M.; Abd El-Fattah, A.A.;Yasen, S.A. Analytical Letters, 1991, 24(2), 275-285.
- Mabrouk, E.M.; Killa, H.M.; Abd El Fattah, A.A.; Yasen, S.A. Cz. Chem. Commun., 1992, 57(2), 268-275.
- Mabrouk, E.M.; Ghoneim, M.M.; Issa, Y.M.; Hassanein, A.M. Egypt J.Chem., 1993, 36, 225-236.
- Mohamed, T.Y.; Mabrouk, E.M.; El-Mossalamy, E.H. Mater. Sci. Res. India, 2006, 3(2A), 155- 164.
- Mabrouk, E.M.; Al-Omary, Kh.A.; Al-Omary, A.S.; El-Mossalamy, E.H. J. Adv. in Chem., 2018, 14(1), 6021-6032.
- Abdallah, M.; Altass, H.M.; Al-Jahdaly, B.A.; Salem, M.M. Green Chem. Lett. Rev., 2018, 11(3), 189-196.
- Fawzy, A.; Abdallah, M.; Zaafarany, I.A.; Ahmed, S.A.; Althagafi, I.I. J. Mol. Liquid, 2018, 265, 276–291.
- Abdel Hameed, R.S.; Abdallah, M. Prot. Met. Phys. Chem. Surf., 2018, 54(1), 113-121.
- Fawzy, A.; Zaafarany, I.A.; Ali, H. M.; Abdallah, M. Int. J. Electrochem. Sci., 2018, 13(5), 4575-4600.
- Abdallah, M.; Altass, H.M.; Al-Jahdaly, B. A,; Fouda, A.S. J. Mol. Liquids, 2016, 216, 590-597.
- Al-Jahdaly, B.A.; Althagafi, I.I.; Abdallah, M.; Khairou, K.S.; Ahmed, S.A. J. Mater. Environ. Sci., 2016, 7(5), 1798-1809.
- Vogel, A.I. A Text Book of Practical Organic Chemistry, 3ed Ed., Longman Publisher New York, 1961.
- Savin, S.B.; Gur‘eva, R.F. Talanta, 1987, 34(1), 87-94.
- Britton, H.T.S. “Hydrogen Ions”, 4th Ed., Chapman and Hall, London, 1952, p. 364.
- Heyrovesky, J.; Kuta, J. “Principles of Polarography”, Pubilishing House of the Czech. Acad. Sci., 2nd Ed., 1965, p. 61.
- Meites, L. “Polarographic Techniques”, Interscience Publishers” Inc. New York, 4th Ed., 1955.
- Zuman, P. “The Elucidation of Organic Electrode Process”, Academic Press, New York, 1969.
- Ghoneim, M.M.; Ashy, M.A. Candian J. Chem., 1979, 57(11), 1294-1298.
- Koutecky, J. Coll. Czech. Chem. Comm., 1955, 18, 597-599.
- Issa, I.M.; Tharwat, M. Electrochim. Acta., 1972, 17, 343-347.
- Ritchie, C.R.; Sager, W.F., Progress in Physical Organic Chemistry, Vol. 2m Interscience Publishers Inc., 1964, p. 334.
- Kolthoff, I.M.; lingane, J. Polarography, Theoretical Principles, Instrumentation and Technique,1965,1,58-62.
- Irving, H.M.; Rossotti H.S. J. Chem. Soc., 1954, 2904-2910.
- Izatt, R.M.; Fernelius, W.C.; Hass, C.G.; Block, B.P. J. Phys. Chem., 1955, 59, 170-174.
- Fouda, A.S; Abdallah, M.; El-Badrawy, Z., Afr. J. Pure and Appl.Chem. 2011, 5(8), 224-236.
- Abdallah, M. Mater. Chem. Phys., 2003, 82, 786-792.
- Abdallah, M.; Hegazy, M.A.; Alfakeer, M; Ahmed, H. Green Chem.Lett.Rev., 2018, 11(4), 457-468.
Accepted on: 10-02-2019


![]()


