Performance Evaluation of Sargassum Polycystum C. Agardh Seaweed Extract as Green Inhibitor for Acid Corrosion of Mild Steel
R. Thilagavathi , A. Prithiba and R. Rajalakshmi*
Department of Chemistry , Avinashilingam Institute for Home Science and Higher Education for Women, Coimbatore -641043,Tamil Nadu, India.
Corresponding Author E-mail: rajivardhan@gmail.com
DOI : http://dx.doi.org/10.13005/ojc/350129
Article Received on : 26-12-2018
Article Accepted on : 18-01-2018
Article Published : 15 Feb 2019
The inhibition for the corrosion of mild steel in acid solution by the extract of Sargassum polycystum seaweed was studied using electrochemical technique and mass loss method. The results obtained show that the seaweed extract could serve as an effective inhibitor for the corrosion of mild steel in acidic medium. It was noticed that the inhibitor concentration, immersion time and temperature influenced the IE. The adsorption of the Sargassum polycystum extract molecules onto the metal surface obeyed Langmuir adsorption isotherm. Surface topography studies suggested the protection of MS surface from corrosion by the adsorption of inhibitor molecules onto the MS surface.
KEYWORDS:Corrosion Inhibition; Electrochemical Impedance Spectra; and Potentiodynamic Polarization; Sargassum Polycystum
Download this article as:| Copy the following to cite this article: Thilagavathi R, Prithiba A, Rajalakshmi R. Performance Evaluation of Sargassum Polycystum C. Agardh Seaweed Extract as Green Inhibitor for Acid Corrosion of Mild Steel. Orient J Chem 2019;35(1). |
| Copy the following to cite this URL: Thilagavathi R, Prithiba A, Rajalakshmi R. Performance Evaluation of Sargassum Polycystum C. Agardh Seaweed Extract as Green Inhibitor for Acid Corrosion of Mild Steel. Orient J Chem 2019;35(1). Available from: https://bit.ly/2TUYQH2 |
Introduction
Mineral acids are used in several industrial processes for processing like pickling, acid cleaning, and acid de-scaling etc, Mild steel (MS) is widely used in engineering materials particularly for the structure and automobile applications due to low cost and easy availability.1 MS in acidic environment is severely affected by corrosion and it needs to be protected. Environmental regulations in industrialized countries have forced researchers globally to focus on green technological innovations. Green inhibitors are effective from an ecological and environmental perspective and can play a key role over toxic inhibitors. It is still amazing that the anticorrosion efficiency of green inhibitor is more or less equal to synthetic inhibitors.2 Natural compounds have emerged as effective corrosion inhibitors due to the presence of complex organic compounds and biodegradable nature. Our research group have successfully investigated utilisation of several natural products against corrosion of MS in acidic environment and similar studies are also reported.3-15 Sargassum polycystum C. Agardh is a dark brown colour and combined with rocks. Sargassum polycystum C. Agardh belongs to sargassaceae family. It is available in tropical region of western Pacific, Philippines, China, Japan, Indonesia and Malaysia. Red and brown seaweeds are rich sources of bioactive secondary metabolites. The species of sargassum are found to be rich in bioactive compounds namely vitamins, proteins and minerals etc.16 The current study is focused to examine the inhibitive action of the Sargassum polycystum (SP) seaweed extract as a inhibitor for mild steel in acid medium.
Material and Methods
Material Selection
Weight percentage composition of MS utilised for the present study is as follows: carbon 0.019%, manganese 0.352%, silicon 0.049%, phosphorus 0.019%, sulphur 0.013%, chromium 0.010%, molybdenum 0.008%, nickel 0.010%, Copper 0.026% and iron 99.33%. Electrochemical and mass loss techniques were performed to examine the efficiency of the inhibitor under study. The MS sample size was 1×5 cm2 and ahole was drilled, mechanically polished, degreased, washed with deionised water, then dried carefully and stored in desiccator for the mass loss test [ASTM G1-03].17
Preparation of the Seaweed Extract
Sargassum polycystum (SP) was collected from Mandapam and shade dried. It was authenticated (BSI/SRC/5/23/2016/Tech/729) by Botanical Survey of India, Coimbatore and Tamil Nadu. 25g of the powder was added to 1M HCl solution and refluxed for 3hrs. Thereafter, the mixture was kept overnight for cooling. It was filtered and prepared 500ml solution with 1molar hydrochloric acid solution to obtain 5% inhibitor extract. Further dilutions were prepared from stock solution to attain the desired concentration.
Mass Loss Method
It is the oldest techniques of monitoring corrosion rate. Pre weighed MS coupons were immersed a beaker containing 100 ml of acid taken with and without inhibitor for a particular period of time as per ASTM G 1-2.18 The MS coupons were washed with distilled water and then dried and re-weighed. The experiment was performed in triplicate and average mass loss was recorded. Different parameters namely variation of concentration of the inhibitor from 0.1% to 0.7%, different immersion times such as 1/2h, 1h, 3h, 6h, 12h and 24h and various temperatures of 303K, 323K, 333K, 343K and 353K were analysed to ascertain the efficiency of the inhibitor.
Electrochemical Measurements
Potentiodynamic Polarization Technique
Polarization study was carried out by Biologic EC Lab software version 10.4 electrochemical work station using a three electrode cell assembly. MS was used as working electrode, platinum as counter electrode and saturated calomel electrode as reference electrode. It was conducted at a scanning rate of 2 mV / sec from -0.1 to -1 mV based on the corrosion potential with and without addition of the inhibitor.
Impedance Spectroscopy
AC impedance spectra were recorded in the same instrument used for polarization study using the same type of three electrode cell assembly. In this technique, 5-10 mV of an AC signal 20 kHz to 0.1Hz frequency was applied to the system. Impedance spectra can be presented in the form of Nyquist or Bode plot. From the plots, the Rct and Cdl are obtained.
Surface Analytical Techniques
FT-IR Spectroscopy
FT-IR spectroscopy was performed to acquire knowledge about the functional groups of the SP extract and corrosion product. The frequency range was applied from 4000 to 400 cm-1 using Shimadzu IR Affinity-1S Fourier Transform Infrared Spectrometer.
UV –Visible Spectrophotometer
PC based AU-2701 UV-Vis Double beam spectrophotometer was used to check the possibility of the metal- inhibitor complex formed on the metal surface. It was studied by the prepared metal samples after immersion in acidic medium in the absence and presence of the 0.7% SP extract solution for 3hrs.
Scanning Electron Microscopy and Energy Dispersive X-Ray
JEOL MODEL JSM 6360 SEM instrument was performed to examine the surface protective layer of the metal surface with and without using inhibitor solution. To examine the morphology of the MS specimen SEM image was taken for polished MS specimen, MS in acidic environment and MS sample in an acidic medium containing 0.7% SP inhibitor.
3D Optical Profilometer
Surface profile was studied using 3D Optical Profilometer. The samples of MS after exposure to 1 M HC1 solution with and without addition of the inhibitor solution for 3 hours were examined. 3D photos were taken with 100x magnified surface through operating program on computer.
Phytochemical Screening of SP Extract
HPTLC, FTIR and UV techniques were performed to characterize the SP extract. Standard procedure is used to find the phytochemical constituents present in the SP extract.19
HPTLC Technique
High-performance thin layer chromatography is one of the sophisticated instrumental techniques based on the full capabilities of thin layer chromatography. HPTLC is used for the identification of constituents, identification and determination of impurities and quantitative determination of active substances. CAMAG HPTLC instrument with Win CATS version 1.3.4 software was performed to analyze phytochemical components and its derivatives present in the seaweed extract.
Results and Discussion
Mass Loss Method
Effect of Inhibitor Concentration in 1M HCl
The effect of SP extract on MS corrosion in 1HCl was investigated using mass loss technique. Figure 1 implied the values of corrosion rate and its inhibition efficiency (IE %) of MS corrosion in 1 M HCl with different concentrations of the inhibitor solution. A maximum efficiency of 95 % is obtained at 0.7% inhibitor solution.
Effect of Immersion Time
The time of immersion influenced on MS sample in absence and presence of different concentrations of the inhibitor in acid medium at ambient temperature (303 K) was evaluated. Figure 1 implied the gradual decrease of the corrosion rate with increase concentration of the inhibitor solution. The percentage inhibition efficiency at different concentrations of SP extract has been depicted in Figure 1. The inhibitor was capable of affording a maximum efficiency of 95 % at 12 h of immersion time (0.7 % conc). The results indicated that the inhibitor molecules were able to adsorb on mild steel surface and form a protective film so as to minimize the corrosion.20
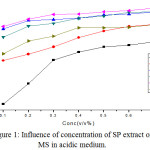 |
Figure 1: Influence of concentration of SP extract on MS in acidic medium. |
Effect of Temperature
The corrosion rate and IE of the MS specimen in absence and presence of SP extract in acidic solution at 303K to 353 K was tabulated in Table 1. The corrosion rate values were found to increase as the temperature of the reacting system increased. The corrosion of MS occurred more rapidly as the temperature increased, reflecting an increased in the corrosion rate with increase temperature. It was observed that when the temperature increased, the reacting molecules collide faster, which leads to increase reactant consumption and product formation. The effectiveness of inhibition efficiency decreased with increase in the corrosion rate.
The impact of SP extract on MS in 1M HCl at various temperatures was tabulated in Table 1. It was noticed that the effectiveness of inhibition process increased with increase inhibitor concentration. The obtained results indicated that the decrease in IE with increase temperature. At higher temperatures, desorption occurred which led to the dissolution of the MS samples in acidic environment with consequent increase in the corrosion rate and a decrease in the effectiveness of inhibition efficacy. This was due to the fact that desorption of the adsorbed film occurred at high temperature.21 From Table 1, it was noticed that the efficiency decreased with increase in temperature but stabilized at 353 K to afford an efficiency of 81% (0.7% conc of inhibition).
Table 1: Variation of IE of SP on MS corrosion as a function of temperature in 1M HCl medium.
| Conc (%v/v) |
303K |
313K |
323K |
333K |
343K |
353K |
||||||
|
CR (mpy) |
IE (%) |
CR (mpy) |
IE (%) |
CR (mpy) |
IE (%) |
CR (mpy) |
IE (%) |
CR (mpy) |
IE (%) |
CR (mpy) |
IE (%) |
|
|
Blank |
2167 |
– |
5775 |
– |
9229 |
– |
14406 |
– |
20991 |
– |
30723 |
– |
|
0.1 |
597 |
72 |
1083 |
81 |
1996 |
78 |
3497 |
76 |
6082 |
71 |
11105 |
64 |
|
0.2 |
495 |
77 |
827 |
86 |
1544 |
83 |
3088 |
79 |
4768 |
77 |
10995 |
64 |
|
0.3 |
375 |
83 |
691 |
88 |
1365 |
85 |
2729 |
81 |
4333 |
79 |
7668 |
75 |
|
0.4 |
333 |
85 |
674 |
88 |
1211 |
87 |
2508 |
83 |
4077 |
81 |
6917 |
78 |
|
0.5 |
307 |
86 |
631 |
89 |
1177 |
87 |
2346 |
84 |
3830 |
82 |
6397 |
79 |
|
0.6 |
299 |
86 |
529 |
91 |
1058 |
89 |
2243 |
84 |
3685 |
82 |
6192 |
80 |
|
0.7 |
282 |
87 |
495 |
91 |
938 |
90 |
1962 |
86 |
3301 |
84 |
5885 |
81 |
Kinetic Parameters
Activation Energy (Ea)
The study of adsorption is very important for the corrosion process. The inhibitor molecule blocked the active sites present in the MS surface which reduced the corrosion reaction. The adsorption behaviour of any inhibitor can be examined by evaluating the kinetics and thermodynamic parameters of the adsorption process. The impact of the temperature on the corrosion rate can be explained by Arrhenius equation:
log CR = log A – Ea/2.303 RT (1)
where CR is corrosion rate (mpy), Ea is an apparent activation energy, R is molar gas constant (8.314 JK−1·mol−1), T is temperature and A is frequency factor. The values of the standard enthalpy and entropy of activation, ΔHa and ΔSa respectively can be calculated by the transition state equation:
log (CR/T )=[ log(R /Nh)+ (ΔSa 2.303R)]+(−ΔHa 2.303R)(1 /T) (2)
where h is Planck’s constant and N is Avogadro number. Arrhenius and transition state plots (Figures 2, 3) were obtained from the linear graph. Ea values were calculated from the slope of the Arrhenius plot (slope = −Ea/2.303R) and the transition plot. The values of ΔHa and ΔSa were obtained from the slope (slope = −ΔHa/2.303R) and intercept (intercept = log(R/Nh) + ΔSa/2.303R) and are tabulated in Table 2. It was mentioned that the Ea values generally increased with lower concentration of the extract and decreased with higher concentration of the inhibitor solution. An increase in Ea value with increase in SP extract concentration was an indication of physical adsorption process which suggested that the IE increased with increase in concentration of the SP extract.22
ΔH and ΔS
The values of enthalpy of activation (ΔHa) and entropy of activation (ΔSa) were calculated from the plots of log CR/T vs. 1/T (Figure 3) and are presented in Table 2. The results implied that ΔHa value was positive with and without addition of the inhibitor solution, which indicated the endothermic nature of the dissolution of steel.23 The ΔSa values were higher in presence of the inhibitor than in its absence which indicated that, the randomness increased on going from reactants to activated complex.24
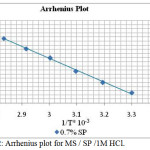 |
Figure 2: Arrhenius plot for MS / SP /1M HCl. |
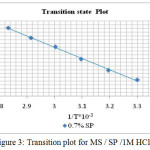 |
Figure 3: Transition plot for MS / SP /1M HCl. |
Table 2: Activation parameters for MS in 1 M HCl with and without addition of different concentrations of SP extract.
|
S. No. |
Conc (%v/v) |
Eα(KJ/mol) |
ΔHα(KJ/mol) |
ΔSα(J/mol) |
|
1 |
Blank |
45.0 |
47.7 |
15.7 |
|
2 |
0.1 |
51.7 |
54.4 |
24.9 |
|
3 |
0.2 |
54.4 |
57.1 |
31.6 |
|
4 |
0.3 |
54.2 |
56.9 |
29.3 |
|
5 |
0.4 |
54.2 |
56.9 |
28.7 |
|
6 |
0.5 |
54.2 |
56.9 |
28.1 |
|
7 |
0.6 |
55.3 |
58.0 |
30.9 |
|
8 |
0.7 |
55.0 |
57.7 |
29.2 |
Adsorption Behaviour
The value of surface coverage of different concentrations of inhibitor obtained from mass loss measurements were used to explain the best isotherm and to find out the adsorption process. Adsorption isotherm is very important for determining the mechanism of organo-electrochemical reactions.25 The most often used isotherm is Langmuir adsorption isotherm.26 The general form of all the isotherms is:
∫(θ,x) exp (2aθ) = KCinh (3)
where ∫(θ,x) is the configurational factor which depends upon the physical model and the assumptions underlying the derivation of the isotherm. θ is the surface coverage degree, C is the inhibitor concentration, a is the lateral interaction term describing the molecular interactions of the adsorption layer and the heterogeneity of the surface, K is the adsorption – desorption equilibrium constant. The adsorption behaviour of various concentration of SP extract in acidic medium was analysed from mass loss study by changing the temperature (303K to 353K).
Langmuir Adsorption Isotherm
Linear plot of log θ / 1- θ Vs log C was obtained with the slope in the range close to unity (Figure 4). This is the indicative of the fact that the bioactive molecules present in the SP extract occupied in the adsorption sites on the metal surface. The slight deviation of the slopes from unity might be due to molecular interaction between SP extract molecules and the metal surface.27
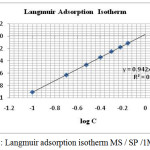 |
Figure 4: Langmuir adsorption isotherm MS / SP /1M HCl. |
Thermodynamic Parameters
The plot obtained for ΔGoads versus T is linear (Figure 5) for MS in 1M HCl using various concentrations of the studied extract. The slope of the straight line is equal to ΔSoads and intercept equal to ΔHoads. Figure 5. showed the dependence of ΔGoads on T, indicated the good relationship among thermodynamic parameters. The ΔGoads values were negative which indicated that the spontaneous nature of the adsorption process.28 In the current investigation, the value of ΔGoads suggested a strong adsorption of SP extract components on MS surface in acid medium. The calculated ΔG°ads values at all studied temperatures are presented in Table 3. Generally, values of ΔG°ads up to -20 kJ mol-1 were consistent with electrostatic interaction between charged molecules and a charged metal (physical adsorption) whereas those more negative than -40 kJ mol-1 involved charge sharing or transfer from the inhibitor molecules to the metal surface and form a co-ordinate type of bond inferring chemical adsorption.29 The calculated ΔG°ads values in the current investigation are in the range of -17.1 to -22.0 kJ mol-1. Hence, it was indicated that the adsorption was a physical adsorption.30 The enthalpy and entropy of adsorption (ΔH°ads and ΔS°ads) were calculated by Gibbs Helmholtz equation.
ΔG = ΔH – TΔS (4)
The plot of ΔG vs. T gave a straight line with intercept ΔH and slope ΔS. The ΔS°ads values were found to be negative which means that the process of adsorption was accompanied by the decreased in entropy which might be due to an orderly arrangement of adsorption of bioactive molecules of SP extract on the metal surface.31
Table 3: Thermodynamic adsorption parameters for MS in 1 M HCl with and without addition of SP extract.
|
Conc (%v/v) |
Free energy of adsorption – ΔG°ads (KJ/mol) |
ΔS°ads J/mol |
ΔH°ads KJ/mol |
|||||
|
303K |
313K |
323K |
333K |
343K |
353K |
|||
|
Blank |
– |
– |
– |
– |
– |
– |
– |
– |
|
0.1 |
19.6 |
21.6 |
21.8 |
22.0 |
22.0 |
21.7 |
-34.0 |
-10.3 |
|
0.2 |
18.5 |
20.6 |
20.8 |
20.6 |
21.0 |
19.7 |
-20.0 |
-13.6 |
|
0.3 |
18.4 |
20.1 |
20.1 |
19.9 |
20.2 |
20.0 |
-23.1 |
-20.4 |
|
0.4 |
18.0 |
19.4 |
19.7 |
19.4 |
19.6 |
19.6 |
-23.7 |
-11.5 |
|
0.5 |
17.7 |
19.0 |
19.1 |
19.0 |
19.1 |
19.2 |
-22.0 |
-11.6 |
|
0.6 |
17.3 |
19.0 |
19.0 |
18.6 |
18.7 |
18.8 |
-17.7 |
-12.8 |
|
0.7 |
17.1 |
18.8 |
18.9 |
18.6 |
18.7 |
18.5 |
-18.3 |
-12.4 |
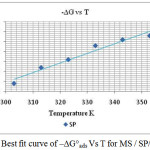 |
Figure 5: Best fit curve of – ΔG°ads Vs T for MS / SP/1M HCl. |
Electrochemical Measurements
Potentiodynamic Polarisation Study
The kinetics of anodic and cathodic reactions occurring on MS electrode in 1M HCl with different SP extract concentrations was investigated by polarization measurements. The electrochemical values derived from the polarisation curves (Figure 6) were tabulated. In acidic solution, anodic reaction is the dissolution of MS in acidic medium and the cathodic reaction is the liberation of hydrogen gas or reduction of oxygen. Since the anodic Tafel slope (ba) and cathodic Tafel slope (bc) of SP was found vary with inhibitor concentration and it showed that the inhibitor affected both oxidation and reduction reactions. Any inhibitor can be differentiated as an anodic/ cathodic inhibitor when the change in the Ecorr value is greater than 85 mV.32 In the present investigation, the Ecorr values were less than 85 mV than the blank value, thus concluding that the inhibitor acts as a mixed-type inhibitor, which means that the addition of SP extract influenced both anodic dissolution of the MS and the cathodic hydrogen evolution reaction. Detailed examination of Table 4 showed that an increase in the concentration of inhibitor decrease the Icorr values. A maximum inhibition efficiency of 91.8% was achieved in 0.7% concentration of the SP extract. The IE was increased from 56.3 % to 89.0 % in 1M HCl solution. The results showed that Rp values increased from 19.2 Ohm/cm2 to 86.6 Ohm/cm2. The increase in Rp values with increase in inhibitor concentration suggested the process of adsorption of SP extract on MS surface.
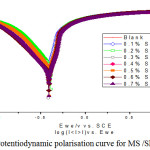 |
Figure 6: Potentiodynamic polarisation curve for MS /SP/1M HCl. |
Table 4: Potentiodynamic polarisation parameters for corrosion of MS in the absence and presence of different concentrations of SP extract in 1M HCl.
| S.NO. | Conc |
Ecorr (Amp/cm2) |
Icorr (Amp/cm2) |
ba (mv/dec) |
bc (mv/dec) |
IE % |
Rp Ω/cm2 |
IE (%) |
|
1 |
Blank |
-449 |
1738 |
95 |
168 |
– |
19.2 |
– |
|
2 |
0.1 |
-472 |
982 |
98 |
152 |
65.4 |
45.7 |
56.3 |
|
3 |
0.2 |
-482 |
855 |
94 |
133 |
76.5 |
50.1 |
70.8 |
|
4 |
0.3 |
-435 |
757 |
85 |
128 |
79.1 |
58.5 |
75.5 |
|
5 |
0.4 |
-428 |
687 |
78 |
131 |
82.5 |
65.3 |
79.9 |
|
6 |
0.5 |
-427 |
596 |
70 |
131 |
84.1 |
71.7 |
83.4 |
|
7 |
0.6 |
-413 |
431 |
64 |
124 |
88.4 |
85.5 |
85.0 |
|
8 |
0.7 |
-401 |
223 |
59 |
113 |
91.8 |
86.6 |
89.0 |
Electrochemical Impedance Spectroscopy (EIS)
EIS is a successful technique used to determine the efficacy of an inhibitor. The influence of the inhibitor on the corrosion of the mild steel in 1M HCl was studied using the EIS method. Nyquist impedance plot was analysed by fitting the experimental data to a simple circuit model shown in Figure 7 which included the solution resistance (Rs), the charge transfer element (Rct), the double layer capacitance (Cdl) inhibition efficiency (IE) and the values are tabulated in Table 5. It was fact that the impedance diagram was not perfect semicircle, which was attributed to the frequency dispersion as a result of the roughness and in homogeneousness of the electrode surface.33,34
Also, the plot showed an increase in impedance response on MS on addition of SP extract by increased diameters, corresponding to charge transfer resistance (Rct) values. The high charge transfer resistance was due to decrease in the active surface required for the corrosion reaction. The inhibition efficiency (% IE) calculated from Rct values were found to provide a maximum efficiency of 93.6 % at 0.6 % SP concentration in 1M HC1 solution.
The value of Cdl decreased with increase in the inhibitor concentration. This was due to decrease in local dielectric constant and an increased thickness of the electrical double layer capacitance. This was indicative of the inhibition of the corrosion of MS by the adsorption of SP extract molecules on the metal/acid interface.35-40 Bode plot inferred a single time constant.
Table 5: Electrochemical Impedance values for MS corrosion with and without addition of SP in 1M HCl.
|
Conc (%v/v) |
Rs (Ωcm2) |
Yo (μF/cm2) |
n |
Rct (Ωcm2) |
IE |
CPE/cdl (μF/cm2) |
θ |
fmax |
|
Blank |
1.32 |
10135 |
0.53 |
11.2 |
– |
489.3 |
– |
32.6 |
|
0.1 |
1.43 |
1846 |
0.82 |
15.3 |
61.8 |
453.6 |
0.23 |
20.4 |
|
0.2 |
1.46 |
1633 |
0.84 |
25.7 |
74.8 |
350.1 |
0.35 |
19.0 |
|
0.3 |
1.64 |
1592 |
0.87 |
115.6 |
76.1 |
314.4 |
0.43 |
16.5 |
|
0.4 |
1.33 |
1352 |
0.89 |
134.7 |
85.0 |
222.7 |
0.54 |
15.2 |
|
0.5 |
1.57 |
1475 |
0.95 |
149.3 |
89.1 |
204.5 |
0.63 |
16.5 |
|
0.6 |
1.66 |
1263 |
0.98 |
284.2 |
90.7 |
165.4 |
0.74 |
15.3 |
|
0.7 |
1.83 |
1024 |
0.99 |
368.1 |
93.6 |
109.2 |
0.82 |
19.3 |
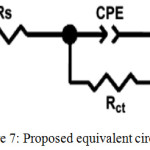 |
Figure 7: Proposed equivalent circuit model. |
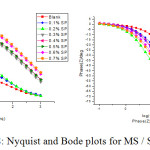 |
Figure 8: Nyquist and Bode plots for MS / SP/1M HCl. |
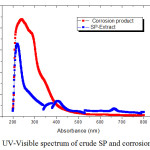 |
Figure 9: UV-Visible spectrum of crude SP and corrosion product. |
Table 6: UV- Visible spectral values for inhibitor and the corrosion product.
|
Absorption band (nm) |
|
|
Crude SP extract |
Corrosion Product |
|
404, 380, 377, 340, 219, 200 |
200, 240 |
Surface Analytical Techniques
UV Analysis
To confirm the possibility of formation of the inhibitor-Fe complex, the UV-Visible absorption spectra obtained from 1M HCl containing the SP extract before and after the immersion of mild steel. Figure 9 showed the absorption spectra of the SP extract before immersion had a maximum absorption at 219 nm that was attributed to the π- π* and n- π* transitions. After 3 hrs of immersion of the mild steel, the variation in the position of absorption maximum at 240 nm indicated the formation of the complex between the metal and the inhibitor molecule.
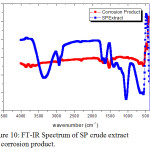 |
Figure 10: FT-IR Spectrum of SP crude extract and corrosion product. |
Table 7: FT-IR Spectral values of SP extract and corrosion product.
|
Observed IR frequency (cm-1) and peak assignment |
||
|
Crude seaweed extract |
Corrosion product/MS/1M HCl |
Frequency Assignment |
|
3988 |
3850 |
O-H stretch |
|
3344 |
3394 |
N-H/O-H stretch |
|
2924 |
2986 |
C-H stretch |
|
2376 |
2372 |
-C≡N stretch |
|
1627 |
1686 |
C=O stretch |
|
1408 |
– |
C-O stretch |
|
1381 |
1389 |
C-O-C stretch |
|
1226 |
1265 |
C-O stretch |
|
883 |
961 |
OH bend |
FT- IR Spectral Analysis
Figure 10 depicted the IR spectrum of the SP extract and that of the protective film formed on the surface of the metal after immersion in the solution containing 0.7% SP extract and their corresponding frequencies are tabulated in Table 7. From the table, the presence of O-H, C-H, C=O, -C≡N, C-O-C stretch, O-H bend groups are present on the protective film formed on the surface is noted. The IR spectral data reflected that a band noticed at 3988 cm-1 shifted to 3850 cm-1 in the corrosion product. The band at 3344 cm-1 attributed to N-H/O-H stretching observed in the seaweed spectra shifts to 3394 cm-1 in the corrosion product. The peak noticed for C-H stretching at 2924 cm-1 shift to 2986cm-1. The IR band shifted from 2376 cm-1 to 2372 cm-1 pertaining to C≡N stretching. A shift from 1381 cm-1 to 1389 cm-1 was identified for C-O-C stretching. A band shifted from 1226 cm-1 (in extract) to 1265 cm-1 (in corrosion product) corresponding to C-O stretching frequency. A band related to OH bending at 883 cm-1 was shifted to 961cm-1 in the corrosion product. The band at 1408 cm-1 corresponding to C-O stretch disappeared in the corrosion product which was indicated that the bond might be involved in bonding. The shift in the absorption frequencies of the SP extract on the metal surface strongly supported the interaction between the phytochemical constituents of the inhibitor and metal surface.41
Optical Profilometer
3D Optical profilometer was employed to reveal the surface microstructure of metal before and after corrosion test. 3D Optical profilometer studies revealed the average roughness Ra and root mean square values Rs of the coated specimen. Figure 11 (c) showed the three-dimensional image of the surface of mild steel immersed in 1M HCl solution without and with addition of 0.7% SP for 3h. Table 8. Showed the corresponding average roughness Ra and RMS roughness (Rq) values. Figure 11(b) showed that the corrosion pattern of mild steel in uninhibited 1M HCl solution was very rough and severely damaged due to an acid attack on the surface. Whereas the corrosion morphology of mild steel in inhibited 1M HCl solution contained the inhibitor was smooth. The average roughness of the mild steel surface in uninhibited 1M HCl solution was about 17.28 µm and Rq is 22.35 µm as a result of the acid attack, while in the presence of SP, Ra and Rq valuesdecreased to 7.17 and 10.04 µm. The decreased in Ra values in the presence of the extract indicated the decreased in the surface roughness. Images of 3D Laser profilometer and the roughness quantification were also consistent with SEM studies. This confirmed that the corrosion inhibition on mild steel occurred through adsorption of the inhibitor on MS surface.42
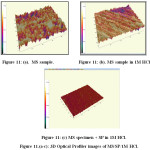 |
Figure 11.(a-c): 3D Optical Profiler images of MS/SP/1M HCl. |
Table 8: Ra and Rq values for MS/ SP/ 1M HCl.
| S. No. |
Samples |
Average Roughness Ra (µm) | Root Mean Square Roughness Rq (µm) |
|
1 |
MS sample |
2.558 |
3.140 |
|
2 |
MS sample in 1M HCl |
17.28 |
22.35 |
|
3 |
MS in 1M HCl + 0.7% SP Extract |
7.17 |
10.04 |
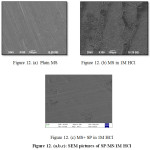 |
Figure 12. (a,b,c): SEM pictures of SP/MS/1M HCl. |
Energy Dispersive X-Ray Analysis (EDX)
EDX spectra are used to determine the elements present in the MS surface after exposure to the SP extract. The EDX spectra of the specimen were taken after 3 h immersion time. Figure 13(c) represented the EDX spectra of the MS sample in the presence of SP extract at optimum concentration. EDX technique was employed to obtain information about the chemical composition of the surface of the MS coupons with and without using inhibitor in acidic medium. The pictures of EDX spectra are showed in Figures 13 (a-c). The percentage atomic content of various elements of the polished, uninhibited and inhibited MS surface was determined by EDX technique. The percentage atomic content of Fe for MS immersed in 1M HCl solution was 79% and those for MS dipped in an optimum concentration (0.7%) was 85.13%. The Figures 13(a-c), ensure that the spectra of inhibited samples showed the suppressed Fe peaks, when compared with the polished and uninhibited MS specimen. This suppression of Fe lines was due to the protective film formed on the MS surface. The EDX spectra of inhibited MS contained the peaks related to all the elements present in the inhibitor molecules indicated the adsorption of the inhibitor molecules on metal surface.
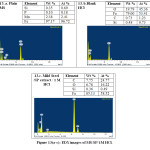 |
Figure 13(a-c): EDX images of MS/SP/1M HCl. |
Characterisation of SP Extract
Phytochemical Screening
The phytochemical constituent present in the SP extract was determined by standard procedure.43 The phytochemical screening analysis of the seaweed extract reflected the following phytochemical constituents namely alkaloids, cardiac glycosides, flavonoids, saponins, phenolic groups, steroids and sterol (Table 9). The presence of these active phytoconstituents present in the extract was influenced on the corrosion inhibition property.
Table 9: Phytochemical screening of crude SP extract.
|
Phyto |
Alkaloids |
Cardiac |
Flavonoids |
Saponins |
Phenolic |
Steroids |
Sterol |
Carbohydrates |
Terpenoids |
|
Results |
+ |
+ |
+ |
+ |
+ |
+ |
+ |
– |
– |
(+) = indicate presence; (-) = indicate absence
FT-IR Spectral Analysis
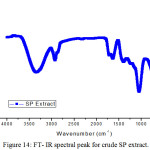 |
Figure 14: FT- IR spectral peak for crude SP extract. |
FT-IR spectrum of fine powder of SP (Figure 14) showed a peak at 3988 cm-1 was attributed to O-H stretching. An absorption band related to N-H/O-H stretching is noticed at 3344 cm-1. A band at 2924 cm-1 was noticed due to C-H vibration. A strong absorption peak at 1627 cm-1 and 2376cm-1 can be attributed to C=O and C≡N stretching or N-H bending vibration and a peak at 1408 cm-1 corresponds to C-O stretching. Strong band obtained at 1381cm-1 was related with C-O-C stretch. A peak at 1226 cm-1 was attributed to C-O stretching. One peak found in the range of 1000 cm-1 to 1300 cm-1 corresponded to C-N or C-O stretching. The absorption peaks obtained below 1000 cm-1 are due to aliphatic and aromatic C-H functional groups. Thus the FTIR spectrum implied the presence of O and N atom containing functional groups that were essential for a molecule to function as a corrosion inhibitor.
UV-spectral Analysis
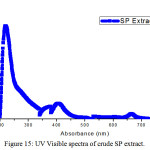 |
Figure 15: UV Visible spectra of crude SP extract. |
Table 10: UV Visible spectral values of crude SP extract.
|
Inhibitor |
Absorption band (nm) |
|
SP extract |
404, 380, 377, 340, 219, 200 |
Figure 15 depicted the UV spectrum of SP extract showed the major peaks at 219 nm and 340 nm. It was indicated that the presence of flavonoids, alkaloids and other compounds containing N or O atoms. The other bands could be connected with the π- π* transition. The results suggested that the presence of carbonyl group present in conjugation with aromatic ring system.
HPTLC Analysis
HPTLC analysis was carried out to study the flavonoid, alkaloid and steroid profiles of SP extract. The ethanolic extract of SP showed the presence of five different types of flavonoids with Rf values 0.02, 0.06, 0.08, 0.79, 0.95 using quercetin as standard with Rf value of 0.80. It was confirmed that the presence of eight different types of alkaloids with Rf values 0.02, 0.13, 0.18, 0.43, 0.49, 0.55, 0.80, 0.92 using colchicines as standard reagent (Rf value 0.41). The SP extract contained the presence of seven different types of steroids with Rf values 0.33, 0.41, 0.48, 0.68, 0.89, 0.94 and 0.97 using stigmasterol as standard with Rf value 0.41. These results inferred that flavonoids, alkaloids and steroids were present in SP extract (Figure 16).
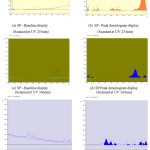 |
Figure 16: HPTLC pictures of (a, b) Flavonoid, (c, d) Alkaloid and (e, f) Steroid for SP extract. |
Mechanism
The first stage of the corrosion inhibition mechanism is the adsorption of inhibitor molecules on the mild steel surface. The significance of the adsorption behaviour was due to the nature of the electrolyte, chemical structure of the inhibitor molecules, and the nature and charge of the metal. The charge on the metal surface was due to the electric field generated at the metal/ electrolyte interface.44 The inhibitor may adsorbed on the MS surface by (i) electrostatic attraction of the inhibitor molecules with already adsorbed chloride ions (physisorption), (ii) vacant, low energy d-orbital of the MS surface atoms and unshared electron pairs of hetero atoms (chemisorption), or (iii) interaction of vacant the d-orbital of the inhibitor molecule with the d-electron of the metal surface (retro-donation). In acidic medium the phytochemicals present in SP molecules adsorbed through protonated heteroatoms (N, O, and S) and already adsorbed anions on the MS surface. Initially the protonated forms of SP molecules in acid medium compete with H+ ions for electrons on the MS surface. The high electron density on the MS surface renders more negative charge to it. In order to relieve the surface from the high negative charge, the electron from the d-orbital of Fe may be transferred to the vacant π*-orbital (antibonding) of the SP molecules and in turn strengthen their adsorption of the MS surface. The phytochemical constituents might be adsorbed on the metal surface by active centres present in it. Therefore, a compact layer formed on surface of the metal and it prevented the entry of iron ions into the solution. Therefore, with an increased in the positive charge on the metal surface, the adsorption of the phytochemical components present in the acidic medium was increased. The formed protective film was confirmed by FT-IR and scanning electron microscopic techniques. The high inhibition efficiency was attributed to the adsorption behaviour of the phytochemical components on mild steel surface.
Conclusion
SP extract has good inhibition behaviour on mild steel in 1M HCl solution. The corrosion inhibition efficiency is directly proportional to the concentration of SP and inversely proportional to the temperature. When the concentration of SP is 0.7%, the inhibition efficiency was found to be as high as 95%. SP suppressed both anodic and cathodic reaction simultaneously and SP acted a mixed type inhibitor for MS. The adsorption of SP on mild steel followed Langmuir adsorption isotherm. Nyquist plots showed the increased charge transfer resistance with increase concentration of seaweed extract. The surface examination tests on MS also confirmed the effectiveness of the inhibitor.
Acknowledgements
The authors would like to thank the authorities of Avinashilingam Institute for Home Science and Higher Education for Women, Coimbatore-641043, Tamilnadu, India for providing necessary facilities for carrying out this study.
Conflict of Interest
There is no conflict of interest.
References
- Lebrini, M.; Robert, F.; Blandinieres, P. A.; Roos, C.; Int. J. Electrochem. Sci., 2011, 6, 2443-2460.
CrossRef - Raja, P.B.; Sethuraman, M. G.; Material Lett., 2008, 62, 113-116.
CrossRef - Salghi, R.; Jodeh, S.; Eno Ebenso, E.; Lgaz, H.; Ben Hmamou, D.; Belkhaouda, M.; Ali, I.H.; Messali, M.; Hammouti, B.; Fattouch, ; Int. J. Electrochem. Sci., 2017,12, 3283-3295.
CrossRef - Rajalakshmi, R.; Subhashini, S.; Leelavathi, S.; Femina Mary R.; Oriental Journal of Chemistry, 2008, 24(3), 1085-1090.
CrossRef - Dharmaraj, E.; Pragathiswaran, C.; Govindhan, P,; Arockia Sahayaraj, P.; John Amalraj, A.; Dharmalingam, V.; International Journal of Research in Pharmacy and chemistry, 2017, 7(1), 132-137.
CrossRef - Prithiba, A.; Leelavathi, S.; Rajalakshmi, R.; Journal of Chemica Acta, 2012, 1(1), 6-13.
CrossRef - Vijalakshmi, P. R.; Rajalakshmi, R..; Subhashini, S.; Portugaliae Electrochimica Acta, 2011, 29(1), 9-21.
CrossRef - Sultan, A.A.; Ateeq, A.A,; Khaded, N.I.; Taher, M.K.; Khalaf, M.N.; J. Mater. Environ. Sci. 2014, 5 (2) 498-503.
CrossRef - Rajalakshmi, R.; Safina, S.; Asian Journal of Chemistry, 2012, 24(10), 4401-4407.
CrossRef - Iroha, N.B.; Hamilton-Amachree, A.; American Journal of Materials Science, 2018, 8(2), 39-44.
CrossRef - Chigondo, M.; Fidelis Chigondo, F.; Journal of Chemistry, 2016, Article ID 6208937, 7 pages.
CrossRef - Leelavathi, S.; Rajalakshmi, R.; Journal of Materials and Environmental Science, 2013, 4(5), 625-638.
CrossRef - Prithiba, A.; Rajalakshmi, R.; International Journal of Metals, 2016, Article ID 8579429, p. 9.
CrossRef - Prithiba A.; Rajalakshmi, R.; Chem. Sci. Rev. Lett., 2016, 5(17), 72-82.
CrossRef - Mathina, A,; Rajalakshmi, R.; Rasayan Journal of Chemistry, 2016, 9(1), 56-66.
CrossRef - Rajkumar, G.; Saravana Bhavan, P.; Suganya, M.; Srinivasan, V.; Karthik, M.; Udayasuriyan, R.; Int. Biol. Biomed. J., 2018, 4(1), 35-47.
CrossRef - ASTM G1-03, Standard practice for preparing, cleaning and evaluating corrosion test specimens, ASTM International, west Conshohocken, USA, 2003.
CrossRef - ASTM International (ASTM), 100 Barr Harbor Dr., West Conshohocken, PA 19428-2959.
CrossRef - Harborne, J. B. Phytochemical methods, London. Chapman and Hall, Ltd. 1973, pp. 49-188.
CrossRef - Rao, V. S.; Singhal, L. K.; J. Mater Sci., 2009, 44(9), 2327-2333.
CrossRef - Shukla, S. K.; Quraishi, M. A.; Corros. Sci., 2009, 51(9), 1990-1997.
CrossRef - Tebbji, K.; Faska, N.; Tounsi, A.; Oudda, H.; Benkaddour, M.; Hammouti, B.; Materials Chemistry and Physics, 2007, 106(2), 260-267.
CrossRef - Zerga, B.; Attayibat, A.; Sfaira, M.; Taleb, M.; Hammouti, B.; Touhami, M. E.; Rais, Z.; Journal of applied electrochemistry, 2010, 40(9), 1575-1582.
CrossRef - Noor, E. A.; Journal of Engineering and Applied Sciences, 2008, 3(1), 23-30.
CrossRef - Wu, X.; Ma, H.; Chen, S.; Xu, Z.; Sui, A.; J. Electrochem. Soc., 1999, 146, 1847-1853.
CrossRef - Langmuir, I.; J. Am. Chem. Soc., 1917, 39, 1848-1906.
CrossRef - Ashassi-Sorkhabi, H.; Shabani, B.; Aligholipour, B.; Seifzadeh, D.; Appl. Surf. Sci, 2006, 252(12), 4039-4047.
CrossRef - Bentiss, F.; Lebrini, M.; Lagrenee, M.; Corrosion Science, 2005, 47, 2915-2931.
CrossRef - Donahue, F.M.; Nobe, K.; Journal of the Electrochemical Society, 1965, 112(9), 886-91.
CrossRef - Ahamad, I.; Prasad, R.; Quraishi, M.A.; Corrosion Science, 2010, 52(4), 1472-1481.
CrossRef - Daud, D.; Mohd N1oor, N. N.; Alimon, H.; Abdul Rashid, N.; ESTEEM Academic Journal, 2015, 11(1), 109-116
CrossRef - Li, W.; He, Q.; Zhang, S.; Pei, B.; Hou, B.; J. Appl. Electrochem., 2008, 38, 289-295.
CrossRef - Fawcett, W.R.; Kovacova, Z.; Motheo, A.J.; Foss, C.A.; J. Electroanal. Chem., 1992, 326, 91-103.
CrossRef - Solomon, M.; Umoren, S. A.; Udosoro, I. I.; Udoh, A. P.; Corrosion Science, 2010, 52(4), 1317-1325.
CrossRef - Selles, C.; Benali, O.; Tabti, B.; Larabi Harek, L.Y.; J. Mater. Environ. Sci, 2012, 3(1), 206.
CrossRef - Growcock, F.B.; Jasinski, R. J.; J. Electrochem. Soc., 1989, 136(8), 2310-2314.
CrossRef - McCafferty, E.; Hackerman, N.; J. Electrochem. Soc., 1972, 119, 146.
CrossRef - Bentiss, F.; Traisnel, M.; Lagrenee, M.; Corros. Sci., 2000, 42(1), 127-146.
CrossRef - Lagrenee, M.; Mernari, B.; Bouanis, M.; Traisnel, M.; Bentiss, F.; Corros. Sci., 2002,44(3), 573-588.
CrossRef - Muralidharan, S.; Phani, K.L.N.; Pitchumani, S.; Ravichhandran, S.; Iyer, S.V. K.; J. Electrochem. Soc, 1995, 142, 1478.
CrossRef - Anees, A.A.; Abd, A.N.; Ahmed, N.F,; South African Journal of Chemical Engineering, 2018, 25, 13-21.
CrossRef - Xianghong Li, Shuduan Deng, Hui Fu,; Corrosion Science, 2012, 62, 163–175.
CrossRef - Asha Kanimozhi, S.; Johnson, M.; Renisheya Joy Jeba Malar, T.; International journal of pharmacy and pharmaceutical sciences, 2015, 7(8), 393-397.
CrossRef - Sherif El-Sayed, M.; International Journal of Electrochemical science, 2011, 6, 5372 – 5387.
CrossRef

This work is licensed under a Creative Commons Attribution 4.0 International License.
![]()
A New Edition of Web of Science
Journal Impact Factor
2022: 0.5
Five Year: 0.8
Journal is Indexed in

Cabells Whitelist
![]()


