Ninhydrin Based Visible Spectrophotometric Determination of Gemigliptin
Giri Prasad Gorumutchu1, Venkata Nadh Ratnakaram2 and Sireesha Malladi3
1Department of Chemistry, Acharya Nagarjuna University, Nagarjuna Nagar-522510, India.
2GITAM University – Bengaluru, Karnataka-562163, India.
3Department of Science and Humanities, Vignan’s Foundation for Science, Technology and Research, Vadlamudi-522213, India.
Corresponding Author E-mail: doctornadh@yahoo.co.in
DOI : http://dx.doi.org/10.13005/ojc/350145
Download this article as:
![]()
A simple method is described to determine the amount of gemigliptin in bulk and tablet formulation by visible spectrophotometry. Basis of the proposed method is the reaction of the primary amine present on gemigliptin with ninhydrin in alkaline pH (alkaline borate buffer) medium to produce a purple color (Ruhemenn’s purple) which has maximum absorption at 558 nm. The method was validated as per the current ICH guidelines. The obtained regression equation (y = 0.0148x+0.0011) in the range of 5-30 μg mL-1 has a good correlation coefficient (> 0.999). As the method does not require any separation, it is rapid and simple. The recovery levels of the drug were in the range of 99.73 – 99.96. This method is a green method as it no organic solvents were employed.
KEYWORDS:Determination; Gemigliptin; Ninhydrin; Ruhemenn’s Purple; Validation
Introduction
Gemigliptin is a long acting, competitive and potent, selective anti-hyperglycemic agent to treat type 2 diabetes and this drug falls under DPP-4 (dipeptidyl peptidase-4) inhibitor class.1 Incretin hormones level are increased by it which further kindle the secretion of glucose-dependent, depletes the secretion of glucagon, and also helps to decrease postprandial hyperglycemia. It effective either as in a combination drug with metformin or in monotherapy.2 Its molecular formula is C18H19F8N5O2 with a molecular weight of 489.36. Its IUPAC name is (3S)-3-amino-4-(5,5-difluoro-2-oxopiperidino)-1-[2,4-di(trifluoromethyl)-5,6,7,8-tetrahydropyrido[3,4-d]pyrimidin-7-yl]butan-1-one (Figure 1). LG Life Sciences (LGLS) developed it initially. Final product was co-developed with Double-Crane Pharmaceutical Co and marketed in China. Development and commercialization of it in Turkey was permitted to NOBEL Ilac in November 2010. Zemiglo is the market product of LGLS in Korea. Sanofi (Paris) and Stendhal (Mexico) were licensed by LGLS to market in 104 countries. Other names of it are LC-150444 and Gemiglo®. Its route of administration is oral.3
A thorough literature collection shows that methods were proposed to estimate gemigliptin using HPLC-Isocratic4-5 and LC/MS-MS.6 But, no visible spectrophotometric method is available. Chemical structure of gemigliptin shows the presence of amine groups which will be useful for formation of Ruhemann purpole with ninhydrin. Therefore, the present method describes visible spectrophotometric determination of gemigliptin using ninhydrin.
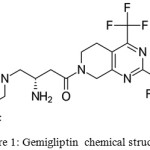 |
Figure 1: Gemigliptin chemical structure. |
Materials and Methods
Ninhydrin Solution
Prepared by dissolving 0.2 g of Ninhydrin in 100 mL of buffer (pH 10) solution. On exposure to sunlight, it becomes red. Hence, this solution was refrigerated at 4°C and used for a period of 3 days.
Alkaline borate buffer (pH 10) was prepared as described in Indian Pharmacopoeia.7
Preparation of Standard Drug Solution
The standard drug of gemigliptin (50 mg) was weighed accurately and transferred to 50 mL volumetric flask. It was dissolved properly and diluted up to the mark with methanol to obtain final concentration of 1000 µg mL–1 (stock solution). This solution was diluted for further suitably.
Results and Discussions
Ninhydrin is the chosen reagent in the current study as it reacts with primary aliphatic amines to produce Rheumann’s purple colour. The absorption spectrum of coloured compound shows lmax as 558 nm (Fig. 2).
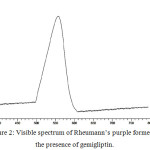 |
Figure 2: Visible spectrum of Rheumann’s purple formed in the presence of gemigliptin. |
Optimization of Reactions Conditions and Stoichiometry
The optimum conditions for the reaction were found to be 2 mL ninhydrin solution, heating temperature at 80 ± 5°C, buffer solution (pH 10) as diluent. Heating time of the drug and ninhydrin was fixed as 15 min because, maximum absorption was noted for the produced violet colour. Beyond 20 min the colour was unstable and slowly faded out. Different organic solvents (DMF, DMSO, acetone or methanol) were tested to choose the appropriate solvent for diluting of the reaction mixture. In addition, water was also tested, as the present method does not involve any extraction step before the measurement of absorbance. Moreover, the added advantage is avoiding of usage of toxic organic solvents. Water found to be the best with a stable and maximum intensity of colour.
In the case of reaction of amino acids with ninhydrin, alkaline pH is preferred. Because, the un-protonated amino group behaves as an excellent nucleophile at higher pH, whereas, protonation at lower pH makes it less nucleophilic.8 However, optimum pH may vary with the nature of amino acid.9 In the present case, pH 10 is found to be optimum. The noted stoichiometric mole ratio between gemigliptin and ninhydrin10 is deviating from 1:2 (as observed in Fig.) and was towards higher values of ninhydrin for the development of maximum colour intensity. This non-ideal nonideal stoichiometry for the Ruhemann purple formation in the present study might be due to possible reasons like slower rate of reaction, side reactions, photolytic instability and interfererences.11-12
Recommended Analytical Procedure
Different aliquots of standard gemigliptin solution were transferred into a series of 10 mL boiling test tubes. Ninhydrin (2 mL) was added and the mixture was heated in a water bath at 80 ± 5°C for 15 min. The contents were cooled and the volume was made up to the mark with alkaline borate buffer buffer in 10 mL volumetric flasks. The absorbance was measured at 558 nm against a reagent blank.
Chromophore Formation and Chemistry
Ninhydrin is a popular chromogen to determine certain amino acids, amines and thiophenes.13 It is a triketohydrindene hydrate and chemically it is 2,2–dihydroxy-l,3,-indandione. It is a reagent having carbonyl group and was successfully used for assay of a number of pharmaceutical compounds containing nitrogeneous functional groups like amino acids, amines, amides, hydrazine’s, piperazines and cyanides. Formation of a condensation product with a typical purple colour forms a basis for the spectrophotometric measurement.14 It is also known as Ruhemann’s reagent because ninhydrin reacts with primary amino groups to develop a coloured chromophore known as Rheumann’s purple which is chemically known as diketohydrindylindene-diketohydrindamine.15
Faint alkaline condition has to be maintained for reaction of ninhydrin.16 Sodium hydroxide or sodium carbonate is generally used for the purpose. Pyridine has the advantage to provide the required alkalinity and maintain reaction conditions.15 But a very few researchers reported the reactivity of ninhydrin with primary amine and amides in acidic pH (5.5) in the presence of a catalyst like sodium molybdate to form the same Rheumann’s purple.14 On the other hand, formation of Rehman blue was reported by Mai a. Ramadan et al,17 in slightly acidic pH 6.0 medium in presence of reducing agent – ascorbic acid.
Majority of the publications report the usage of organic solvents (like DMF, DMSO, acetone or methanol) where as, others used either buffer solution or aqueous solution. As per the new developing trends, new analytical methods need to be green in addition to other best characteristics.18 So, one of the experimental objectives of the present study is to avoid the usage of organic solvents. It has a great significance in reduction of analysis cost. Hence, alkaline borate buffer was used as the reaction medium in the present study and no organic solvent was employed.
The actual color of the product varies in light.19 λmax in the present study is 558 nm. Literature survey shows that λmax depends on the nature of medium. For example, it was 595-600 nm when the medium was N,N’-dimethylformamide (DMF).20-25 In buffer solution or aqueous medium, 555 – 571 nm was observed.14,15,26-31 This may be due to polar and stearic effects of reactant.32 The observed λmax can be further substantiated from the studies of Mendel Friedman et al,33 about the effect of solvent nature on absorption maximum of Ruhemann’s purple. According them, λmax will be around 605 nm in non-aqueous aprotic solvents (like DMSO and DMF) and a hypsochromic shift was observed to 575 nm in non-aqueous protic solvents (ex., formamide) or by the addition of protic solvents to aprotic media due to involvement of hydrogen bonding. Similarly, a shift to 550 nm was observed by the addition of compounds capable of forming charge-transfer interactions (ex., pyridine) to nonaqueous aprotic solvents. However, few researchers reported the formation of yellow coloured product having λmax of 420 nm in saturated NaHCO3 solution due to reaction between ninhydrin and secondary amine groups containing pharmaceutical drugs like Lisinopril,34 erbutalin sulphate.35 Because, all primary amine and ammonia produce purple color with ninhydrin and secondary amine produce yellow color complex with Ninhydrin.36 In the present case, the formation of Ruhemann purple with gemigliptin can be shown below (Fig. 3).
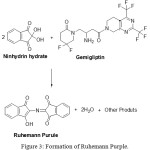 |
Figure 3: Formation of Ruhemann Purple. |
Mechanism involved in the formation of Ruheumann’s purple depends upon the nature of substrate (amino acid, imino acid, primary amine, secondary amine, pyrrole and ammonium salt.37 In the case of amino acids, ninhydrin undergoes tautomerization to form 1,2,3-indantrione which reacts with amino acid to give Schiff’s base. An aldehyde is yielded by decarboxylation of the formed ketamine along with formation of an intermediate amine which condenses with another ninhydrin molecule to results in the product – Ruheumann’s purple.12 However, reaction of pharmaceutical drugs with ninhydrin reagent via oxidative deamination of the primary amino group followed by the condensation of the reduced ninhydrin to form the coloured purple reaction product was reported with gabapentin,38 lisinopril,24 pregabalin,15 amlodipine,25 famotidine.24,39 The postulated reaction mechanism involves the essential existence of ninhydrin and as well as its reduced form to form Rehemann purple by amines.40 Condensation with both forms of ninhydrin proceeds through either simultaneously or sequentially (Fig. 4).
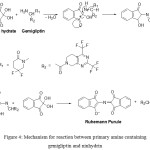 |
Figure 4: Mechanism for reaction between primary amine containing gemigliptin and ninhydrin. |
Validation of Method
Linearity and range
Linearity was observed concentration in the range of 5 – 30 μg mL-1 (Table 1, Fig. 5).
Table 1: Calibration values of gemigliptin.
| Concentration(µg mL-1) | Absorbance* |
| 5 | 0.0751 |
| 10 | 0.1494 |
| 15 | 0.2242 |
| 20 | 0.2941 |
| 25 | 0.3651 |
| 30 | 0.4482 |
* Average of three determinations
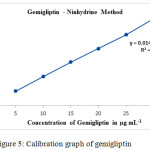 |
Figure 5: Calibration graph of gemigliptin. |
The proposed analytical method is linear due to high correlation coefficient (> 0.999) for the observed linear regression equation y = 0.0148x+0.0011. Different parameters (optical and regression) are listed out in Table 2.
Table 2: Optical, regression and validation parameter values.
| S. No. | Parameter | Observation |
| Optical characteristics | ||
| 1. | Apparent molar absorptivity (l mol-1 cm-1) | 2.53×10⁴ |
| 2. | Sandell’s sensitivity (µg cm-2A-1) | 0.0673 |
| Regression analysis | ||
| 1. | Slope | 0.0148 |
| 2. | Intercept | 0.0011 |
| 3. | Regression coefficient (r) | 0.9995 |
| Validation parameters | ||
| 1. | λ max | 558 nm |
| 2. | Beer’s Law Limit (Linearity, μg mL-1) | 5-30 |
| 3. | Limit of detection (μg mL-1) | 0.15 |
| 4. | Limit of quantitation (μg mL-1) | 0.50 |
| 5 | Stability period | 24 hours |
Accuracy
% recovery values were determined in order to ascertain the accuracy of the proposed method. Various quantities of gemigliptin (5, 10 and 15 µg mL-1) were added to a nominal amount of (10 µg mL-1) was to study recovery levels of 50%, 100% and 150% respectively. Range of % recovery values is 99.73 – 99.96 as observed from Table 3. Acceptable level of accuracy is demonstrated from low values of SD and %RSD.
Table 3: Recovery of gemigliptin.
| Level of recovery (%) | Amount of drug recovered (µg mL-1)(Practical) | Statistical evaluation | % Recovery = Practical x 100/ Theoretical | |
| 50 | 14.96 | Mean | 14.98 | 99.73 |
| 14.98 | SD | 0.013 | 99.86 | |
| 14.99 | %RSD | 0.083 | 99.93 | |
| 100 | 19.96 | Mean | 19.97 | 99.80 |
| 19.98 | SD | 0.008 | 99.90 | |
| 19.97 | %RSD | 0.040 | 99.85 | |
| 150 | 24.98 | Mean | 24.98 | 99.92 |
| 24.99 | SD | 0.008 | 99.96 | |
| 24.97 | %RSD | 0.032 | 99.88 | |
Nominal concentration used (a): 10 µg mL-1.
Amount of drug added (b): 5, 10 and 15 µg mL-1 respectively for 50%, 100% and 150% recovery levels.
Theoretical amount: Total amount of drug (a + b) = 15, 20, 25 µg mL-1 respectively for 50%, 100% and 150% recovery levels.
Precision
Three different concentrations of gemigliptin were chosen in the linearity range (5–30 μg mL-1) to study the precision studies (intraday as well as inter-day). Table 4 is a collection of measured six values each on the same day as well as successive days. The proposed method is substantiated in terms of precision as its %RSD values are are within acceptable limit (below 1%) both for intraday and inter-day studies.
Table 4: Precision data.
| Concentration of Drug (μg/mL-1) |
Concentration* | |||
| Intraday (Mean ± SD) (μg/mL-1) | % RSD | Inter-day (Mean ± SD) (μg/mL-1) | % RSD | |
| 5 | 5.003±0.026 | 0.520 | 5.007±0.048 | 0.959 |
| 15 | 15.174±0.048 | 0.316 | 15.241±0.052 | 0.341 |
| 30 | 30.058±0.051 | 0.170 | 30.084±0.058 | 0.193 |
* Average of six determinations
Ruggedness
Experiments were carried out by two separate analysts on dissimilar days by choosing three diverse gemigliptin concentrations with in the linearity range (5 – 30 μg/mL-1). The reproducible assay values are the evident of ruggedness of the proposed method (Table 5).
Table 5: Ruggedness data.
| Test Concentration of Drug (μg/mL-1) |
Concentration* | |
| Analyst change | ||
| Mean ± SD (μg/mL-1) | % RSD | |
| 5 | 5.0514±0.028 | 0.554 |
| 15 | 15.041±0.052 | 0.346 |
| 30 | 30.148±0.081 | 0.269 |
* Average of six determinations
Detection Limits Determination
Both the limits for quantification as well as detection were calculated using the values of signal to noise ratio [41].LOQ as well as LOD for gemigliptin determination using the current method was done uding values of S (calibration curve slope) and σ (response standard deviation).42
LOD = 3.3 × σ /S = 0.15 μg mL-1 and LOQ = 10 × σ /S = 0.50 μg mL-1
Pharmaceutical Formulations Analysis
Sonnicated a mixture of methanol and tablet formulation (ZEMIGLO®) powder for ten minutes to extract the API present in it. Then the amount of API was determined by adopting the above method (Table 6). Visible spectrophotometric method is the generally used method of choice for routine analysis in industrial QC laboratories, especially in developing countries.43-50 Hence, the developed visible spectrophotometric method can be adopted for the determination of gemigliptin in pure and tablet formulations using Ninhydrin as a chromogenic agent.
Table 6: Assay of Pharmaceutical Formulation.
| Formulation | Labeled amount (g) | Amount found* (g) | % Drug Recovered | %RSD |
| ZEMIGLO® | 50 | 50.0214±0.0028 | 100.04 | 0.006 |
*Average of three determinations
Conclusions
Formation of a purple color (Ruhemenn’s purple) due to the reaction between primary amine present on gemigliptin and ninhydrin in alkaline pH medium. As organic solvents are avoided in the present method, it can be considered as a green method. The proposed method was validated as per the existing guidelines of ICH. As alternative to the expensive instrumental methods, this method can be considered for routine analysis of gemigliptin (bulk drug and tablet formulation) in quality control laboratories,
References
- Lim, K.S.; Kim, J.R.; Choi, Y.J.; Shin, K.H.; Kim, K.P.; Hong, J.H.; Cho, J.Y.; Shin, H.S.; Yu, K.S.; Shin, S.G.; Kwon, O.H. Clinical therapeutics. 2008. 30(10), pp.1817-1830.
CrossRef - Kim, S.H., Lee, SH.; Yim, H.J. Arch. Pharm. Res. 2013, 36: 1185. https://doi.org/10.1007/s12272-013-0171-x.
CrossRef - Kim, S.H.; Yoo, J.H.; Lee, W.J.; Park, C.Y. Diabetes metab. j. 2016. 40(5), 339-353.
CrossRef - Shailesh, V.L.; Kajal, R.P.; Jani, G.K.; Sachin, B.N. J. Pharm. Sci. Bioscientific. Res. 2016, 6(3), 338-346.
- Krishna Y, Kedhareshwari R, Harikha Y, Harikrishna V, Gopi, M.K . J. Pharm. Biomed. Anal. 2016, 4(2), 93–99.
- Shailesh, V.L., Harshi, A.P., Jani, G.K., Malairajan, P. European j biomed pharm. 2017, 4, 488-501.
- Indian Pharmacopoeia. I.P. Commission Ghaziabad. 2010.
- Joullié, M. M.; Thompson, T. R.; Nemeroff, N. H. Tetrahedron. 1991, 47(42), 8791-8830.
CrossRef - Moore, S.; Stein, W. H. J. biol. chem. 1948, 176, 367-388.
CrossRef - Job, P. Formation and stability of inorganic complexes in solution. Ann. Chim. 1928, 2, 113.
- Pundarikakshudu, K.; Shah, P. B. J. Aoa.c Int. 2006, 89, 987-994.
CrossRef - Wani, Y. B.; Patil,D. D. J. Saudi. Chem. Soc. 2013, 21, S101-S111.
CrossRef - Fiegel, F. Elsevier Publishing Co, London. 1960.
- Papanna, R. K.; Krishnegowda, J. B.; Nagaraja, P. J. Pharm. Pharm. Sci. 2015, 7(5), 194-199.
- Gupta, C.; Puri, R.; Hussain, A.; Jain, S. K. Eurasian. J. Anal. Chem. 2012, 8(2), 90-98.
- Lamothe, P. J.; McCormick, P. G. Anal. chemi. 1972, 44(4), 821-825.
CrossRef - Ramadan, M. A.; Abuiriban, M. B. Indo. Am. J. Pharm. Sci. 2013, 3(8), 6419-6429.
- Vidotti, E. C.; Almeida, V. C.; Oliveira, C. C. Talanta. 2004, 64(4), 993-999.
CrossRef - Harding, V. J.; Warneford, F. H. J. Biol. Chem. 1916, 25(2), 319-335.
CrossRef - Rahman, N.; Singh, M.; Hoda, M. J Braz Chem Soc. 2005, 16(5), 1001-1009.
CrossRef - Hisham, E. A.; Khalil, H. M. J. Pharm. Biomed. Anal. 2003, 31, 209-214.
CrossRef - Vijayakumar, B.; Venkateshwarlu, G. J. Pharm. Pharm. Sci. 2015, 5(1), 911-921
- Hany, A.O.; Hamid, M.Y. IOSR J. Appl. Chem. 2017, 10(2), 52-59.
CrossRef - Raza, A.; Ansari, T. M. J. Chin. Chem. Soc. 2005, 52(5), 1055-1059
CrossRef - Rahman, N.; Azmi, S. N. H. IL Farmaco. 2001, 56(10), 731-735.
CrossRef - Hosseinimehr, S. J.; Pourmorad, F.; Moshtaghi, E.; Amini, M. Asian. J. Chem. 2010, 22(1), 522-526.
- Sbârcea, L. A. U. R. A.; Udrescu, L. U. C. R. E. Ţ. I. A.; Drăgan, L. I. A. N. A.; Trandafirescu, C. R. I. S. T. I. N. A.; Szabadai, Z. O. L. T. Á. N.; Bojiţă, M. Farmacia. 2014, 62(1), 107-118.
- Mahrous, M. S.; Abdel-Khalek, M. M. Analyst. 1984, 109(5), 611-613.
CrossRef - Raza, A.; Ijaz, A. S.; Ahmad, S. Química. Nova. 2009, 32(5), 1180-1183.
CrossRef - Siddiqui, F. A.; Arayne, M. S.; Sultana, N.; Qureshi, F.; Mirza, A. Z.; Zuberi, M. H.; Bahadur, S. S., Afridi, N. S.; Shamshad, H.; Rehman, N. Eur. J. Med. Chem. 2010, 45(7), 2761-2767.
CrossRef - Patil, V. P.; Devdhe, S. J.; Angadi, S. S.; Kale, S. H.; Phalke, S. D.; Shelke, S. D.; Patil, R. H. Asian. J. Chem. 2014, 7(1), 2.
- Friedman, M. J. Agric. Food .Chem. 2004, 52(3), 385-389. doi:10.1021/jf030490p.
CrossRef - Friedman, M. Microchem. J. 1971, 16(2), 204-209.
CrossRef - Basavaiah, K.; Tharpa, K.; Hiriyanna, S. G.; Vinay, K. B. J. Food. Compos. Anal. 2009, 17(2), 93-99.
- Godse, S.; Vaishnav, G. A.; Vaishnav-Hota, S.; Angadi, S. S.; Patil, S. J. World. J. Pharm. Pharm. Sci. 2017, 6(5), 602-611.
- Value @ amrita virtual amrita laboratories universalizing education, Amrita vishva vidhyapeetham. 1956.
- Mc Caldin, D.J. Chemical Review., 1959, 60(1), 39-52.
CrossRef - Abdellatef, H. E.; Khalil, H. M. J. Pharm. Biomed. Anal. 2003, 31(1), 209-214.
CrossRef - Rahman, N.; Kashif, M. ILFarmaco. 2003, 58, 1045-1050.
CrossRef - Macfadyen, D. A. Federation. proc. 1947, 6(1) Pt 2, 273.
- Sethi, P.D. HPLC quantitative analysis of pharmaceutical formulations, CBS publications, India. 2001.
- ICH guidelines, Validation of Analytical Procedures: Text and Methodology. 2015, Q2 (R1), 8-13.
- Prasad, G.G.; Nadh, R.V. Int. J. Appl. Pharmaceutics. 2019, 11(1).
- Prasad, G.G.; Nadh, R.V. Res. J. Pharm. Techn. 2019, 12(1).
- Prasad, G.G.; Nadh, R.V.; Kiran, K.K. Asian J. Pharm. Clinical Res. 2019, 12(3).
- Prasad, G.G.; Nadh, R.V. Oriental. J. Chem. 2018, 34(6).
- Kiran, K.K.; Nadh, R.V.; Nagoji, K.E.V. Oriental. J. Chem. 2013, 29(1), 263-269, DOI:10.13005/ojc/290142.
CrossRef - Sudhir, M.S.; Nadh, R.V. Oriental. J. Chem. 2013, 29(4), 1507-1514, DOI:10.13005/ojc/290429.
CrossRef - Kiran, K.K.; Nadh, R.V.; Nagoji, K.E.V. Oriental. J. Chem. 2014, 30(2), 905-10, DOI:10.13005/ojc/300272.
CrossRef
Accepted on: 05-12-2018


![]()


