Influence of Impurities of Different Types on the Properties of Potassium Dihydrogen Phosphate Crystals (A Review)

National Research Centre «Kurchatov Institute» –Inter-regional ergonomic association(IREA), Moscow, Russia
Corresponding Author E-mail: ilia.komendo@cern.ch
DOI : http://dx.doi.org/10.13005/ojc/350102
Download this article as:
![]()
The review is dedicated to the influence of different types of impurities including cationic, anionic, organic and bacteria influence on the crystalline and optical properties of potassium dihydrogen phosphate crystals. Level of impurity sensitivity of properties was tried to be estimated too. The relevant data about influence and sensitivity of following elements Al, Ba, C, Ca, Ce, Cr, Fe, Mg, Mn, Mo, P, S, Si, V are systematised.
KEYWORDS:Crystal Growth; Effect; Impurities; Potassium Dihydrogen Phosphate; Single Crystals
Introduction
It is a well-known fact that the different impurities have not the same impact on the growth rate or optical properties of potassium dihydrogen phosphate (KDP) crystals. The present review aims to sum and systematise the most relevant data about the influence of different impurities on the KDP crystals properties and to establish approximate impurity sensitivity of them. At the present moment, the raw material for the rapid growth of the KDP crystals should be «as pure as it possible» not in full regarding experimental data about impurities influence of the KDP crystals properties. The ICP-AES analysis of the ProChem Inc. (USA) produced of potassium dihydrogen phosphate sample designed for the growth of large crystals for National Ignition Facility (NIF) project is presented in Table 1. Author of the present review hopes that this work would be helpful for setting the objective requirements for the raw material for the rapid large single crystal growth.
Table 1: Impurity content in KDP raw material for NIF large single crystals.
|
Impurity |
Concentration, ppm |
Impurity |
Concentration, ppm |
|
Ag |
<0.05 |
Mn |
<0.01 |
|
Al |
<0.01 |
Mo |
<0.05 |
|
As |
<0.1 |
Na |
2.5 |
|
B |
<0.3 |
Ni |
<0.05 |
|
Ba |
<0.05 |
Pb |
<0.1 |
|
Ca |
<0.1 |
Rb |
4.0 |
|
Cd |
<0.02 |
Si |
<0.3 |
|
Co |
<0.05 |
Sr |
<0.03 |
|
Cr |
<0.05 |
Ti |
<0.05 |
|
Cs |
<0.1 |
V |
<0.05 |
|
Cu |
<0.5 |
Y |
<0.05 |
|
Fe |
<0.02 |
Zn |
<0.05 |
|
Ga |
<0.05 |
Zr |
<0.05 |
|
Mg |
<0.01 |
The Crystalline Structure of KDP
For the better understanding impurities’ influence on properties of crystals, it is necessary to introduce to a crystalline structure of KDP. At room temperature, KDP crystals shape is derived from the tetragonal prism and tetragonal bipyramids at the ends of the crystals as it shown on fig. 1.
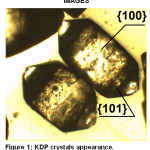 |
Figure 1: KDP crystals appearance. |
The atoms arrangement in the KDP lattice has been thoroughly studied by X-ray analysis using generators of synchrotron irradiation.1,2 The prismatic face {100} of the crystal consists of layers of phosphate-potassium layers, with oxygen atoms on the surface corresponding to (PO4)3- groups. Therefore the surface of the prismatic face is bearing the negative charge. The surface of the pyramidal face {101} mostly consists of K+ ions. Consequently, its surface is charged positively (Fig. 2.).
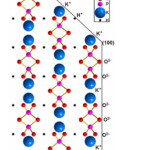 |
Figure 2: Faces structure of a KDP crystal.2 |
Such structure will provide the electrostatic attraction of positively charged impurity ions on the {100} faces. The authors of3 performed a crystal chemical analysis of the KDP structure and identified voids with coordinates (0.25, 0.35, 0.125) suitable for the introduction of Fe3+ impurities. It was suggested that the incorporation of Fe3+ in the KDP crystal structure is followed by the removal of H+ and two K+ ions from the crystal lattice to maintain electroneutrality oа crystal. The crystal structure of KDP promotes sorption and incorporation of positively charged impurities into interstitial voids of crystal. Further, this collective of authors developed the mechanism of incorporating different metal ions in KDP crystalline structure depending on the ionic radii of impurities,4,5,6,7
Impurities Effect
In general, impurities may be divided into 4 groups: cationic (Fe3+, Al3+, Cr3+, Ca2+, Mg2+, Na+, etc.), anionic (SO42-, polyphosphates [Hxn-(PO3)x]n–, [H2P2O7 ]2-, etc.), organic (EDTA, formic acid, etc.) and impurities of biological origin.
Cationic Impurities
The effect of polyvalent metals on the growth and properties of KDP crystals was studied in detail.8,9 The presence of Fe, Cr, Al impurities in growth solutions leads reducing of the growth rate of the prismatic face at low supersaturation. In fig.3 it can be seen a zone on the growth curve (dependence of crystal face growth rate on supersaturation) when growth rate tends to zero while supersaturation is increasing. Such a zone is named “dead zone”.10,11
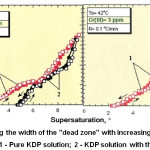 |
Figure 3: Increasing the width of the “dead zone” with increasing of Cr content in growth solution.11 1 – Pure KDP solution; 2 – KDP solution with the addition of Cr(III). |
1-Pure KDP Solution
2-KDP Solution With the Addition of Cr(III)
Reducing the prismatic face growth rate while a growth rate of the bipyramid one is a constant, leads to the crystal growth driven by only pyramidal faces. Thus crystal shape is distorting. Such a phenomenon is called pinching out (Fig. 4).
![Figure 4: Pinching out of KDP crystals caused by the presence of Fe impurity in solution.8 A - supersaturation of 6.3%, [Fe] = 6.5 · 10-7 %mol. B - supersaturation of 13%, [Fe] = 3·10-6 % mol.](https://www.orientjchem.org/wp-content/uploads/2019/02/Vol35No1_Inf_Ili_fig4-150x150.jpg) |
Figure 4: Pinching out of KDP crystals caused by the presence of Fe impurity in solution.8 A – supersaturation of 6.3%, [Fe] = 6.5 · 10-7 %mol. B – supersaturation of 13%, [Fe] = 3·10-6 % mol. |
The authors12 added the Li, Ca, Ce (IV) and V (V) impurities into growth solution, and observed a change in the shape of the crystal (Fig. 5.) which was corresponded to the metal valence.
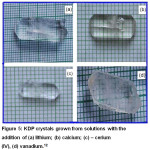 |
Figure 5: KDP crystals grown from solutions with the addition of (a) lithium; (b) calcium; (c) – cerium (IV), (d) vanadium.12 |
The SEM was used to observe the defects of the crystal surface (Fig. 6). Also, the influence of the presence of mentioned impurities on the second harmonic generation of Nd-lasers was investigated.
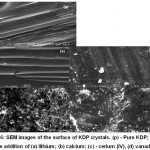 |
Figure 6: SEM images of the surface of KDP crystals. (p) – Pure KDP; the rest with the addition of (a) lithium; (b) calcium; (c) – cerium (IV), (d) vanadium.12 |
Although the content of impurities in the crystals did not exceed 2.5 ppm, their influence on the surface morphology was significant. The addition of lithium leads to not high surface imperfection (separate scattering centres are appearing). With calcium addition obvious surface defects start to be observed: scattering centres become larger and turning into spots. The addition of cerium and vanadium leads to the formation of large spots, voids and individual grains. However, the presence of an impurity, regardless of its nature, on the contrary, contributed to the higher yield of the second harmonic generation. In13 the effect of aluminium impurities on the resistance to spontaneous crystallisation of a KDP solution and the morphology of crystals was studied. The effect of pinching out of prismatic faces was observed at aluminium concentration nearly 100 ppm similar to that observed for iron impurity poisoning (Fig. 7).
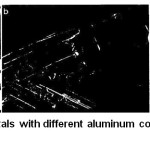 |
Figure 7: Images of KDP crystals with different aluminum content. a – Pure crystals, b -90 ppm Al, c – 130 ppm Al.13 |
The authors14 determined the effect of s-, p-, d-, and f-elements on the growth and optical properties of KDP crystals. Mg, Sb, Pd, and La were chosen as the representants of each mentioned group of elements. It was found that these impurities have almost no effect on the optical properties of the crystals, but their presence in the growth solution leads to an increase in the width of the “dead zone” by 60-80%, depending on the impurity and the saturation temperature of the solution.
The effect of Ba2+ impurities on the KDP crystals morphology was studied in.15 It was found that barium, like Fe and Al, leads to a crystal pinching out, but at higher concentrations(Fig. 8). The authors16 determined the negative effect of Mn impurity on growth, optical transparency and the efficiency of second harmonic generation.
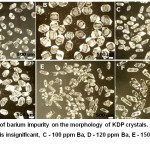 |
Figure 8: Effect of barium impurity on the morphology of KDP crystals. A, B – the barium content is insignificant, C – 100 ppm Ba, D – 120 ppm Ba, E – 150 ppm Ba, F – 250 ppm Ba.15 |
Among anionic impurities, the most negative impact on the morphology and properties of KDP crystals have impurities of condensed phosphates [Hxn-(PO3)x]n-, [H2P2O7]2-. Also, impurities containing a transition metal anions (CrO42-, Cr2O72-, MoO42-. The influence of polyphosphates was studied in detail in.17,18,19 It was found that condensed phosphates almost completely blocking the growth of pyramidal faces (Fig. 9).
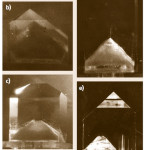 |
Figure 9: KDP single crystals grown from solutions poisoned with metaphosphates content a) 50 ppm, b) 30 ppm, c) 15 ppm, d) 10 ppm, e) 1 ppm.19 |
Related to the impact on the optical properties, metaphosphate impurities are forming optical inhomogeneities in crystals, which appear to be centres of light scattering (Fig.10).
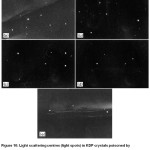 |
Figure 10: Light scattering centres (light spots) in KDP crystals poisoned by metaphosphates with a content of a) 50 ppm, b) 30 ppm, c) 15 ppm, d) 10 ppm, e) 1 ppm.19 |
Impurity of MoO4 depending on the concentration influences both on the faces of the pyramid and the prism.20 This, apparently, can be related to the fact that at the pH of the saturated KDP solution (4.2-4.4), molybdenum is present in the solution in the form of various polyanions: Mo4O132-, Mo7O246-, Mo6O204-, while the polymerisation of MoO42- proceeds as follows:
MoO42- ↔ [MoO3(OH)]– ↔ [MoO2(OH)2]0 ↔ [MoO(OH)3]+
[MoO3(OH)]– + H2O ↔ [MoO(OH)5]– [MoO2(OH)2]0 + H2O ↔ [MoO(OH)6]0 [MoO(OH)3]+ + H2O ↔ [MoO(OH)5H2O]+2[Mo(OH)6]0 ↔ [(OH)5 – Mo – O – Mo – (OH)5]0 + H2O
[MoO(OH)5]– + [Mo(OH)5H2O]+ ↔ [(OH)5 – Mo – O – Mo – (OH)5]0 + H2OThus, in weakly acidic solutions, neutral molecules can also be in equilibrium along with polymeric anions and cations.21 Therefore, the presence of molybdenum in a solution can affect both a negatively charged prismatic faces and positively charged pyramids (Fig. 11).
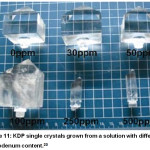 |
Figure 11: KDP single crystals grown from a solution with different molybdenum content.20 |
Also, the presence of molybdenum causes defective areas on the surface of crystals, which are centres of light scattering (Figure 12).
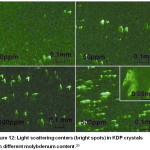 |
Figure 12: Light scattering centers (bright spots) in KDP crystals with different molybdenum content.20 |
Influence of anionic chromium containing impurities was studied in.22 Chromate anion (CrO42-) exist in the KDP solution in the form of Cr2O72- and HCrO4–. Cr2O72- is selectively sorbing on the of the pyramidal faces, and HCrO4- on the prismatic ones. Regardless of the chromate form, even at relatively low concentrations, CrO42- causes crystal staining (Figure 13).
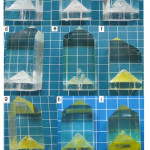 |
Figure 13: KDP single crystals grown from a solution with different contents of CrO42-. a) Pure solution, b) 50 ppm, c) 100 ppm, d) 500 ppm, e) 1,000 ppm, f) 5,000 ppm, g) 10,000 ppm, h) 50,000 ppm, i) 100,000 ppm.22 |
From fig.13 it can be seen that the phenomenon of pinching out of crystals is not observed, unlike the case when chromium is present in solution in cationic form.
SiO32- impurity leads to the pinching out of KDP crystals, but at high concentrations of 500 ppm (Fig. 14).
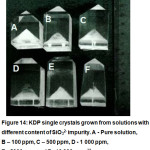 |
Figure 14: KDP single crystals grown from solutions with different content of SiO32- impurity. A – Pure solution, B – 100 ppm, C – 500 ppm, D – 1 000 ppm, E – 5000 ppm and F – 10 000 ppm.23 |
The effect of the sulfate ion impurity was studied in.24 SO42-groups can incorporate into the crystal structure of KDP due to the formation of hydrogen bonds. At high concentrations of SO42- in the growth solution, defects caused by the incorporation of the mother liquor, as well as parasitic crystals and cracks, were observed. Optical transparency was significantly decreased, especially in the UV range.
Organic impurities
There are data on the effect of impurities of organic anions on the laser strength of KDP crystals (table 2).25
Table 2: Effect of organic anions on the laser strength of KDP crystals.25
|
Organic anion |
Concentration, ppm |
Laser strength, J/cm2 |
|
Pure KDP |
– |
52,0 |
|
EDTA |
300 |
52,0 |
|
Tyrosine |
20 |
40,4 |
|
Tyrosine |
50 |
40,4 |
|
Tyrosine |
300 |
35,1 |
|
Formiate |
300 |
42,7 |
|
Oxalate |
300 |
45,8 |
It can be seen that any anionic organic impurities significantly reduce the laser strength of the crystals, which may be related to their ability to “burn out” under the laser irradiation. The work26 is devoted to study the influence of organic impurities on laser strength. The authors could improve the laser strength of KDP single crystals by reducing the level of total organic carbon (TOC) by treating KDP with hydrogen peroxide (Fig.15). It was found that the amount of H2O2 sufficient to reduce the TOC content to ≤ 0.05 ppm equals 100 ppm.
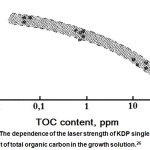 |
Figure 15: The dependence of the laser strength of KDP single crystals on the content of total organic carbon in the growth solution.26 |
Biological Impurities
The same team of authors also studied the influence of bacteria on the morphology of the faces of crystals. It is well known that the phosphate media is favourable for the development of various kinds of microorganisms. The authors27 added bacteria of the candida parapsilosis species into the crystalliser chamber during the growth of the KDP crystal and noted that the presence of bacteria causes the appearance on the faces the hillocks that are not associated with the presence of dislocations in this area. In this case, promoters of adsorption of bacteria on crystalline faces were ions of trivalent metals. The authors associated the appearance of mounds with the biochemical reaction of bacteria with potassium dihydrogen phosphate.
Table 3: Effect of different impurities on the properties of KDP crystals.
|
Impurity |
Effect |
Reference |
|
Al |
Significantly reduces the growth rate of {100} faces, causes pinching out of crystal |
9,13 |
|
Ba |
Effects on the morphology of crystal from concentrations of 100 ppm, causes pinching out of crystal |
16 |
|
C (in the form of organic carbon) |
Significantly reduces laser strength of crystal. Depending on the carbon origin, impurity sensitivity of laser strength is from dozens till hundreds of ppm |
25 |
|
Ca |
Causes light scattering centres formation |
12 |
|
Ce |
Causes light scattering centres formation and their collapse in spots and also significantly reduces surface homogeneity |
12 |
|
Cr (in the form of chromates) |
Significantly reduces the growth rate of {100} faces, causes pinching out of crystal, staining of crystal |
22 |
|
Fe |
Significantly reduces the growth rate of {100} faces, causes pinching out of crystal |
8,9 |
|
Mg |
Increases of the width of the dead zone |
14 |
|
Mn |
Reduces optical transparency and efficiency of second harmonic generation |
16 |
|
Mo (in the form of molybdates) |
Reduces growth rate both of the pyramidal and prismatic faces, causes scattering centres formation |
20 |
|
P (in the form of polyphosphates) |
Almost completely blocks the growth of pyramidal faces, causes the light scattering centres formation |
17,18,19 |
|
S (in the form of sulphate) |
Causes parasitic crystals and cracks formation, significantly decreases optical transparency in UV range |
24 |
|
Si |
Causes pinching out of crystal |
23 |
|
V |
Causes light scattering centres formation and their collapse in spots and also significantly reduces surface homogeneity |
12 |
Existing literature data comparing KDP of various purities as a raw material for growing single crystals demonstrate (Fig. 16) that a substance of 3N purity (99.9%) is unsuitable for growing even small single crystals.28
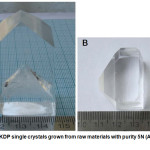 |
Figure 16: KDP single crystals grown from raw materials with purity 5N (A) and 3N (B).28 |
Conclusion
It is evident that the spectrum of impurities that in one way or another influences the properties of potassium dihydrogen phosphate single crystals is wide. At the same time, the exact value of “impurity sensitivity” of any of the properties in a real system is difficult to quantify, due to the possibility of superposition of the effects of impurities, as well as the difficulty of estimating the total impurity composition of the raw material. As a result, most of the publications describing the effect of impurities have a one-sidedness: only one impurity is subject of study. Often impurity was added in KDP solution in larger quantities than it could be present in real systems. At the same time, units of ppm of chromium begin to have a noticeable effect, for example, on the growth rate of faces of a prism, and units of ppm of iron lead to the pinching out of KDP crystals. This review contains information of more than ten metals and other elements whose presence in the growth solution will have a negative impact on the properties of KDP crystals – the data summarised in table 3.
For setting up the requirements for the raw material for the rapid growth of KDP large single crystals, it is necessary to control the content of not less than 10 metals, and the differentiation of concentration limits of them should be reliant on the valency. Concentrations of metals with the high valencу should be significantly lower than alkali or alkali earth ones. The total amount of metal impurities should be less than 10 ppm. Also for organic impurities, requirements should be strict, and presence of <1 ppm of TOC is allowed.
Acknowledgements
Current work is supported by the grant of Ministry of Education and Science of Russia 14.625.21.0039, project identifier RFMEFI 62516 X 0039.
conflicts of Interest
There is no conflicts of interest.
References
- de Vries, S. A.; Goedtkindt, P.; Huisman, W. L.; Zwanenburg, M. J.; Feidenhans’l, R.; Bennett, S. L.; Smilgies, D. M.; Stierle, A.; De Yoreo, J. J.; van Enckevort, W. J. P.; Bennema, P.; Vlieg, E. J. Cryst. Growth. 1999, 205, 202-214.
- de Vries, S. A.; Goedtkindt, P.; Bennett, S. L.; Huisman, W. J.; Zwanenburg, M. J.; Smilgies, D. M. Phys. Rev. Lett. 1998, 80(10), 2229-2232.
- Eremina, T. A.; Kuznetsov, V. A.; Okhrimenko, T. M.; Furmanova, N. G. Crystallogr. Rep. 1996, 41(4), 680-684.
- Eremina, T. A.; Kuznetsov, V. A.; Eremin, N. N. Crystallogr.Rep. 2002, 47, 76-85.
- Eremina, T. A.; Kuznetsov, V. A.; Eremin, N. N.; Okhrimenko, T. M.; Furmanova, N. G.; Efremova, E. P.; Urusov, V. S. Crystallogr. Rep. 2001, 46(6), 989–996.
- Rak, M.; Eremin, N. N.; Eremina, T. A.; Kuznetsov, V. A.; Okhrimenko, T. M.; Furmanova, N.G.; Efremova, E. P. J.Cryst. Growth. 2005, 273, 577-585.
- Eremina, T. A.; Kuznetsov, V. A.; Eremin, N. N.; Okhrimenko, T. M.; Furmanova, N. G.;Efremova, E. P.; Rak, M. J.Cryst. Growth. 2005, 273, 586-593.
- Owzcarek, J.; Sangwal, K. J.Cryst. Growth. 1990, 99, 827-831.
- Rashkovich, L.; Kronsky, N. J.Cryst. Growth. 1997, 182, 434-441.
- Alexandru, H. V.; Bebecaru, С.; Radulescu, R. C.; Stanculescu, F.; Logofatu, B. J. Optoelectron. Adv. M. 2003, 5(3), 589-597.
- Guzman, L. A.; Kubota, N. J.Cryst. Growth. 2005, 275, e237-e242.
- Ramasamy, G.; Bhagavannarayanana, G.; Meenakshisundaram, S. Indian J. Pure Ap. Phy. 2014, 52, 255-261.
- Triboulet, P.; Cournil, M. J.Cryst. Growth. 1992, 118, 231-242.
- Ramasamy, G.; Meenakshisundaram, S. P.; Mojumdar, S. J. Therm. Anal. Calorim. 2013, 112, 1121-1125.
- Zheng, G.; Liang, J.; Zhengdong, Z.; Genbo, L.; Xinxin, S. Cryst. Res. Technol. 2008, 43(6), 583–587.
- Egorova, A. E.; Portnov, V. N.; Vorontsov, D. A.; Kim, E. L., Malafeeva, E. K. Nizhniy Novgorod State University Research Bulletin. Physics of Solid State. 2011, 6(1), 58-62 (in Russian).
- Gao, Z. S.; Li, Y. P.; Wang, C.; Lu, K. J. Synth. Cryst. 1994, 23(3/4), 52-55.
- Wang, S.; Gao, Z. S.; Fu, Y.; Sun, X.; Zhang, J.; Zen, H.; Li, Y. J.Cryst. Growth. 2001, 223, 415-419.
- Fu, Y. J.; Gao, Z. S.; Liu, J. M.; Li, Y. P.; Zeng, H.; Jiang, M. H. J.Cryst. Growth. 1999, 198/199, 682-686.
- Ding, J.; Wang, S.; Gu, Y.; Xu, G.; Liu, H.; Cui, H.; Xu, X. Indian Journal of Engineering & Materials Science. 2015, 22, 105-110.
- Braithwaite, E. R.; Haber, J. Molybdenum an Outline of its Chemistry and Uses. 1994, 662 pp.
- Ding, J.; Wang, S.; Xu, X.; Gu, Q.; Liu, W.; Sun, Y.; Liu, G.; Zhu, S. J.Cryst. Growth. 2011, 334(1), 153-158.
- Ding, J.; Lu, Y.; Wang, S.; Mu, X. Cryst. Res. Technol. 2010, 45(8), 800-804.
- Zhang, J.; Wang, S.; Fang, C.; Sun, X.; Gu, Q.; Li, Y. Mater. Lett. 2007, 61, 2703-2706.
- Dhanaraj, G.; Byrappa, K.; Prasad, V.; Dudley, M. Springer Handbook of Crystal Growth. 1st ed. 2010, 1818 pp.
- Nishida, Y.; Yokotani, A.; Sasaki, T.; Yoshida, K.; Yamanaka, T. Appl. Phys. Lett. 1988, 52(6), 420-421.
- Sasaki, T.; Yokotani, A.; Fujioka, K.; Nishida, Y.; Yamanaka, T.; Yamanaka, C. Jpn. J. Appl. Phys.. 1987, 26(11), L1767-L1769.
- Rajesh, J.; Charoen, In. U.; Manyum, P.; Mater. Res. Bull. 2014, 59, 431-434.
Accepted on: 04-02-2019


ISSN Online: 2231-5039

![]()


