The Olive Core, A Promoter Material for the Adsorption of Dyes: Effects of Certain Parameters, Kinetic and Thermodynamic Study
Ahde El-Imache and Kamar Ouazzani
High School of Technology, P.O. Box 2427, Sidi Mohammed Ben Abdellah University, Fez, Morocco.
Corresponding Author E-mail: ahde.elimache@usmba.ac.ma
DOI : http://dx.doi.org/10.13005/ojc/340624
Article Received on : 20-04-2018
Article Accepted on : 23-10-2018
Article Published : 02 Nov 2018
In this study, the Moroccan Olive Core (OC) was chosen for the preparation of a bio-adsorbent for the purpose of using it as a natural support to remove two synthetic dyes: Methyl Blue (MB) and Crystal Violet (CV) from aqueous solutions. Tow adsorbent characterization techniques were used: Fourier transform infrared spectroscopy (FTIR) and scanning electron microscopy (SEM). Influence of some parameters is studied to characterize the adsorption process: contact time (0-45 min), temperature (25 -100 °C) and initial concentration of MB and CV (10-30 mg.l-1). Langmuir, Freundlich and Dubinin-Radushkevich isotherm models were used to describe the adsorption equilibrium. The equilibrium is perfectly described by the Freundlich model whose correlation coefficient is equal to 0.995 for MB and 0.991 for CV. Thermodynamic parameters were valued, and they showed that, for both dyes, the adsorption on MOC is endothermic and spontaneous.
KEYWORDS:Crystal Violet; Dye Adsorption; Isotherm; Methyl Blue; Olive Core; Thermodynamic Study
Download this article as:| Copy the following to cite this article: El-Imache A, Ouazzani K. The Olive Core, A Promoter Material for the Adsorption of Dyes: Effects of Certain Parameters, Kinetic and Thermodynamic Study. Orient J Chem 2018;34(6). |
| Copy the following to cite this URL: El-Imache A, Ouazzani K. The Olive Core, A Promoter Material for the Adsorption of Dyes: Effects of Certain Parameters, Kinetic and Thermodynamic Study. Orient J Chem 2018;34(6). Available from: http://www.orientjchem.org/?p=51838 |
Introduction
Water pollution caused by dyes requires a special interest of the environmental society, especially researchers. Several anthropogenic activities use dyes in their manufacturing stages, like textile and paper industry, tannery, food processing, printing and cosmetics industry1. In the dying process, much of the dye applied is lost because the low levels of dye-fiber fixation.2 Direct disposal of textile wastewater into the environment can cause serious environmental damage such as biological accumulation of dye molecules in fish. Consumption of this contaminated seafood can lead to undesirable and irreversible effects on the human nervous system.3 Given the potential dangers caused by dyes molecules on human health, recently, many approaches have been explored to develop cheaper and more efficient technologies, both to reduce the amount of wastewater produced and improve the quality of the treated effluent such as membrane filtration and adsorption.4 Adsorption has become one of the most used alternative treatments used to reduce the level of dyes in water effluent. Recently, the search for low-cost adsorbents with high capacity of adsorption has intensified.5 Several studies of removing dyes and other pollutants using low-cost adsorbent were executed by many reviewers, e.g: agricultural and household waste6, industrial waste,7 sludge,8 sea materials,9 soil and minerals.10 Among these resources, agricultural waste remains the most interesting for several reasons, in particular for their availability and low cost. However, few studies concern the application of olive core as adsorbents,11 specifically in Mediterranean countries as Morocco, where the national farms have a production of about 1,500,000 tons of olives and the objectives of the Green Morocco Plan for 2020 in terms of olive production is to reach 2500000 tons.12 Nevertheless, studies on the removal of dyes using the solid residues of olive cores (OC) by adsorption are still scarce. However, this bio-adsorbent have not been studied for the removal of methylene blue (MB) and crystal violet (CV). This study includes the adsorption behavior of those dyes onto OC, which is not reported previously. These cationic dyes are chosen for their multitude of application areas. Methylene blue (MB) is selected herein because of her widespread application in medicine, biological staining and chemistry (as redox indicator, water testing).13 Crystal violet is used to dye paper, to colorize different products such as fertilizers and detergents, to human and veterinary pharmacopoeia for a long time.14 The adsorption capacity of MB and CV on OC was investigated according to the pH, contact time, initial dye concentration and temperature. Three isotherm models (Langmuir, Freundlich and Dubini- Radushkevich) were used to describe adsorption. To describe kinetic data, two models were adopted: the pseudo-first-order and pseudo-second-order kinetic models. Furthermore, thermodynamic parameters, such as ∆G, ∆H and ∆S, were examined.
Experimental
Materials and Methods
OC was obtained from a canning industry that, mechanically, separates the stone from the skin. The OC is rinsed with distilled water and dried in air oven at 105°C overnight. Then, it was ground to particle size of 0.4 mm and stored hermetically for further use. The dyes considered in this study are methylene blue and crystal violet, with very high degree of purity (98 %); they were provided by Biochem Chemopharma, Great Britain. The dyes concentration was measured by UV-Visible spectroscopy (Jasco V530) respectively for the MB and the CV at a wavelength of λmax = 665 nm and λmax = 590 nm. The characterization of the olive core was carried out by BRUKER’s Fourier Transform Infra-Red Spectroscopy (Vertex 70) by scanning a wavelength range of 400 to 7500 cm-1, and by the Electron Microscopy at Scanning (Quanta 200 FEI), with a magnification of 1000x, 2000x and 4000x. Table 1 summarized a structural and physico-chemical characteristics of dyes. A stock solution of each dye was prepared at a concentration of 100mg.l-1 in distilled water. Colored solutions of different concentrations, used in this study, were prepared using dilution of the stock solution with distilled water.
Table 1: Dyes characteristics.
| Dye | Chemical formula | Molecular weight(g mol−1) | λ max(nm) | Type |
| Methylene Bleu(MB) | C16H18ClN3S | 319.86 | 665 | Cationic dye |
| Crystal violet(CV) | C25H30CIN3 | 407,98 | 590 | Cationic dye |
Batch Adsorption Experiment
In order to evaluate the biosorption property of OC, adsorption experiments of Methylene Blue and Crystal Violet were conducted by varying initial dyes concentration, pH and temperature of solution. The solution pH was modified by the addition of NaOH (0.1M) or HCl (0.1M). Adsorption experiments were performed (at 250 rpm) by mixing a mass of 1 and 2 g of OC, for MB and CV respectively, in 100 ml of the aqueous dye solution at 20 mg.L-1. Colored solution was divided from the adsorbent by centrifugation at 2600 rpm for 5 min. Absorbance of the supernatant was measured after sampling using a 0.45μm diameter filter syringe (Minisart, sartorium stedim biotech) by means of a Jasco V530 UV / visible spectrometer at the corresponding wavelength. A calibration curve is performed with a range of known concentrations of MB and CV to determine the final concentration of the dyes in solutions. The different parameters studied included:
The effect of the contact time: (5 to 80 min);
The effect of the mass of the adsorbent (0.5 to 8 g);
The effect of the initial concentration: (10 to 30 mg.L-1);
These three effects were studied at constant temperature 25°C and unadjusted pH.
The effect of pH: (2.6 to 12) at a constant temperature and concentration (25°C, 20 mg.L-1);
The effect of temperature: (25 to 100°C).
The adsorbed amount was calculated using the formula:
With
Qe is amount of equilibrium adsorption (mg.g-1),
C0 and C are initial and final concentration of dye (mg.L-1) in the solution V (ml),
m is the mass of the adsorbent (g).
The results of adsorption have been described by Freundlich, Langmuir and Dubinin-Radushkevich models. The rate constant of adsorption was quantitatively determined by the pseudo-first order and pseudo-second order models.
Results and Discussion
Characterization of the Adsorbent
The OC were analyzed by Scanning Electron Microscopy (SEM) to visualize their surface morphology and deduce its characteristics. Figures 1 shows the SEM of the OC before and after the adsorption of dye. The material had a smooth, porous surface structure, indicating a good possibility of trapping MB and CV dyes in the surface of the adsorbent. After adsorption, the adsorbent surface OC showed a rough and corroded structure due to the coverage of the pores and the surface by the two molecules of adsorbed dyes. The surface coverage was confirmed by the reduction of pores after adsorption of MB and CV.
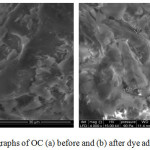 |
Figure 1: SEM micrographs of OC (a) before and (b) after dye adsorption (4000x). |
Fourier transform infrared spectroscopy was applied to identify characteristics of OC (Figure 2). The recorded spectrum is strongly dominated by a broad band ranging from 3200 to 3800 cm-1 which indicates the presence of the bound [O-H] characteristic of the alcohol groups, confirmed by the presence of a [C-O] band between 1000 and 1300 cm-1. Characteristic bands of stretching vibration [CH, CH2, and CH3] are observed in the range of 2924 and 2854 cm-1. The stretching vibration of carboxylic groups [C=O] can be proved by the peak at 1745 cm-1. The intense peak at 1047 cm-1 along with the weak peak at 1215 cm-1 and the shoulder at 1139 cm-1 are [C–O] stretching vibrations of ethers and alcohols.
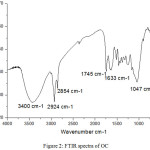 |
Figure 2: FTIR spectra of OC. |
Influence of initial pH
One of the most significant parameters affecting the adsorbent’s ability to treat water is the pH of the solution. Since the change in pH causes a change in the degree of ionization of the adsorbed molecule and changes the properties on the surface of the adsorbent, so the effectiveness of the adsorption depends on it.15-16 Figure 3 described the influence of pH on the adsorption capacity of MB and CV on the Moroccan Olive Core at 25°C. A slight increase in the adsorbed amount of MB and CV on MOC is observed when the pH of the solution increase from 2.6 to 6. Thus, the adsorbed quantity remains relatively constant in the pH range from 6 to 12 for two dyes. This is probably due to the behavior of the cationic dyes in contact with the adsorbent at different pH. By dissociating in water, dyes are positively charged, so they bind to the adsorbent in an acidic environment and repel in a basic environment. The adsorption can be considered by electrostatic interactions between the adsorbent and dyes. These interactions increase as the pH increases and the adsorbent surface becomes more negative as the solution becomes more and more basic.17-18 Thus, the optimum pH is 5.5 and 5.8 respectively for MB and CV on OC adsorption.
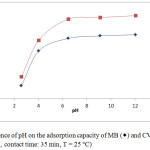 |
Figure 3: Influence of pH on the adsorption capacity of MB (◊) and CV (Δ) on OC (C0 = 20 mg.L-1, contact time: 35 min, T = 25°C). |
Influence of Contact Time and Adsorption Kinetics
The impact of contact time on dyes adsorption for different concentrations was shown in Fig. 4. For both dyes, the adsorption rate was rapid at the first 10 minutes. It’s probably due to the available active site of adsorption into OC surface. Subsequently, the adsorption rate stay fixed and eventually reached equilibrium due to the saturation of the OC surface sites.19-20 For both dyes, a chosen contact time is 35 min. The adsorption mechanism of MB and CV dyes was evaluated by the most used kinetic models. Expressions of these models are given by equations 2 and 3 successively:
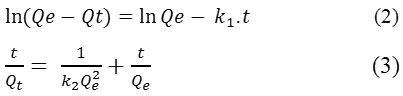
The kinetic parameters were determined from linear plots of Ln (Qe-Qt) = f (t) and t/Qt = f (t) for both models respectively. The results are summarized in Table 2.
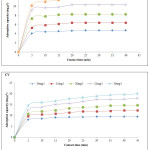 |
Figure 4: Influence of contact time on the adsorption capacity of MB and CV on OC (pHBM = 5.5, pHCV = 5.8, T = 25°C) Click here to View figure |
As shown in Table 2, the calculated Qt values are very low compared to those measured Qexp for the two dyes. Based on the comparison of the correlation coefficients R2, as it is noticed that the pseudo-first-order model are relatively low compared to the pseudo-second-order model, so unacceptable, leading to the conclusion that this model is far from describing the kinetics of adsorption of the two dyes. Alternatively, the pseudo-second-order model displays Qt values that fit perfectly with Qexp measured values and with coefficients R2 which are close to a unit. Thus, it can conclude that the adsorption system follows the pseudo-second order model, which suggests that the energy of adsorption sites influence on the adsorption rate. However, this model supposed that physiosorption may be the controlling mechanism for the rate at which MB and CV are adsorbed by OC, and will be confirmed and discussed later. These results are consistent with those described by numerous authors.22
Table 2: Parameters of kinetic models.
| MB | |||||||||||||||
| C0(mg.l-1) | Qexp (mg.g-1) | First ordre | Second ordre | ||||||||||||
| K1(min-1) | Qt(mg.g-1) | R2 | K2(g.mg-1 min-1) | Qt(mg.g-1) | R2 | ||||||||||
| 10 | 4.755 | 0.379 | 1.800 | 0.983 | 0.201 | 4.902 | 0.999 | ||||||||
| 15 | 6.905 | 0.287 | 4.353 | 0.777 | 0.323 | 7.299 | 0.999 | ||||||||
| 20 | 8.790 | 0.274 | 4.051 | 0.722 | 0.187 | 9.091 | 0.999 | ||||||||
| 25 | 10.370 | 0.313 | 3.596 | 0.842 | 0.097 | 10.638 | 0.999 | ||||||||
| 30 | 12.005 | 0.347 | 5.473 | 0.887 | 0.097 | 12.500 | 0.999 | ||||||||
| CV | |||||||||||||||
| C0(mg.l-1) | Qexp (mg.g-1) | First ordre | Second ordre | ||||||||||||
| K1(min-1) | Qt(mg.g-1) | R2 | K2(g.mg-1 min-1) | Qt(mg.g-1) | R2 | ||||||||||
| 10 | 9.537 | 0.244 | 6.95659 | 0,984 | 0.093 | 9.804 | 0,999 | ||||||||
| 15 | 13.171 | 0.120 | 7.96965 | 0,870 | 0.021 | 13.699 | 0,997 | ||||||||
| 20 | 16.051 | 0.170 | 2.78813 | 0,747 | 0.010 | 17.544 | 0,997 | ||||||||
| 25 | 19.045 | 0.143 | 7.64130 | 0,829 | 0.009 | 20.408 | 0,997 | ||||||||
| 30 | 21.125 | 0.157 | 7.52666 | 0,828 | 0.009 | 22.727 | 0,997 | ||||||||
Effect of Initial Dyes Concentration and Adsorption Isotherms
Figure 5 presents results concerning the study of the influence of the initial concentration of the two dyes (MB and CV) on the OC. As depicted, by increasing the concentration of the dye, the adsorption capacity increases at the same time, from 4.75 to 12.00 mg.g-1 for MB and from 9.53 to 21.12 mg.g-1 for CV, for dye concentrations ranging from 10 to 30 mg.L-1. At a high initial dye concentration, the driving force exerted on the mass transfer is high, which explains the result found.23-24 Indeed, a crossing of the percent dye removal curve and the adsorption capacity of the same dye can give an idea of the optimal concentration to be selected for subsequent testing. From the curves, it can be chosen the 30 mg.L-1 for MB and the 20 mg.L-1 for CV.
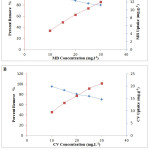 |
Figure 5: Influence of initial concentration of MB (A) and CV (B) on adsorption capacity onto OC. |
In order to describe interaction between the adsorbent and the adsorbate, several models of adsorption isotherms can be applied. Three models have been chosen to describe the interactions between the molecules of the dyes and those of the adsorbent, and to estimate the feasibility of the process: Freundlich, Langmuir and Dubinin-Radushkevich (D-R) isotherms. The Freundlich isotherm expresses the characteristics of the heterogeneous surface and the intensity of the adsorption process with calculating the coefficient n. It can be described by the following equation:
![]()
With KF is the coefficient of Freundlich. The graphical representation of Ln (Qe) as a function of Ln (Ce) is a line whose slope is 1/n and whose intercept is Ln (KF). The 1/n value advises the validity of the adsorption. Favorable adsorption is making if the value of 1/n is between 0 and 1. The numerical values of KF and 1/n are calculated respectively, from the intersection with the intercept and the slope of the isothermal line26.The Langmuir isotherm supposes that adsorption is monolayer and occurred at homogeneous sites for the adsorbent.25 The following equation represents the Langmuir model with which MB and CV dye adsorption test data was processed on OC:
![]()
Whither
Qm: the maximum adsorption capacity (mg.g-1),
KL: the equilibrium constant relative to the Langmuir model,
Ce: the concentration of adsorbate at equilibrium (mg.l-1).
The Qm and KL values are determined from the intersection with the y-axis and the gradient of the line Ce/Qe = f (Ce).
In order to know the nature of adsorption, the Dubinin-Radushkevich (D-R) isotherm model, described as follow equations, is adopted27:
![]()
With
Qm: the theoretical isotherm saturation capacity (mg.g-1),
β: the D-R isotherm constant depending on temperature (mol2.kJ-2),
ε: the D-R isotherm constant depending on the equilibrium concentration of the dye (mol2.kJ-2).
This model is generally used to distinct between physical and chemical adsorption by calculating E (kJ.mol-1), the average energy of adsorption, given by the following formula:
![]()
The linear plot of Ln (qe) vs ε2 is used to define model parameters. When E is less than 8 kJ.mol-1, it’s the physic adsorption. For the chemical adsorption, E is between 8 and 16 kJ.mol-1. Table 3 grouped the constants of the three used models.
Table 3: Freundlich, Langmuir and D-R parameters for the adsorption of MB and CV on OC at 25°C
|
Isotherm Models |
||||||||||
|
Freundlich |
Langmuir |
Dubinin–Radushkevich |
||||||||
| Dye | n | KF | R2 | qm | KL | R2 | qm | KDR | E | R2 |
| MB | 2,768 | 6,289 | 0,995 | 12,224 | 1,262 | 0,980 | 10,376 | 0,112 | 2,112 | 0,884 |
| CV | 3,706 | 11,481 | 0,991 | 19,193 | 2,051 | 0,910 | 17,801 | 0,082 | 2,469 | 0,780 |
The adsorption capacity of OC calculated by Langmuir model is 12.22 mg.g-1 for MB and 19.19 mg.g-1 for CV with a correlation coefficient of 0.980 and 0.910 for BM and CV, respectively. Table 4 summarized the calculate adsorption capacities in comparison with values from the bibliography. Mainly, the adsorption capacity of OC is considered average than the other adsorbents of the literature. The Freundlich model is also studied to evaluate the performance of OC in MB and CV removal. It’s described the interactions of adsorbent molecules in heterogeneous system. For favorable dye adsorption, the Freundlich constant 1/n must be between 0 and 1. The numerical value of 1/n is equal to 0.36 and 0.26 for the adsorption of MB and CV respectively; thus indicating a favorable adsorption according to the Freundlich model. The Freundlich equation is the model on the basis of adsorption onto a heterogeneous surface. According to the DR model, the average energy of adsorption E calculated is equivalent to 2.11 KJ.mol-1 and 2.47 KJ.mol-1 for the MB and the CV respectively, approving that the adsorption is physical nature.
Table 4: Comparison of OC with other adsorbents for MB and CV adsorption.
| Adsorption capacity (mg.g-1) | |||
| Adsorbant | MB | CV | Reference |
| Banana peel | 20.8 | – | 28 |
| Rice Husk | 40.6 | – | 29 |
| Coconut coir | 15.6 | – | 30 |
| Sawdust | – | 37.8 | 31 |
| Rice Husk | – | 44.9 | 32 |
| Pineapple leaf | – | 78.2 | 33 |
Effect of Temperature and Thermodynamic
Temperature is another parameter that infects the physico-chemical parameters of the adsorption process.34 The results relating to the study of the variation of the adsorption capacity of the two dyes on OC as a function of temperature are shown in Figure 6. The results reveal that the temperature variation influences slightly the adsorption capacity of the two dyes on OC. This range increases from 7.43 to 9.07mg.g-1 for MB and from 15.74 to 19.20mg. g-1 for CV when the temperature changes from 25°C to 100°C. From Figure 6-A, It can be conclude that the adsorption is endothermic. Other authors have obtained similar results from the adsorption of MB on different materials including palm kernel fiber 35 and the adsorption of CV on a cation exchange resin and mango stone.36
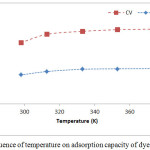 |
Figure 6: Influence of temperature on adsorption capacity of dyes. |
Thermodynamic parameters (enthalpy ΔH°, entropy ΔS°, free enthalpy ΔG°) were determined at 25, 40, 60.80 and 100°C, by the equation as follow:
ΔG = – RT In Kd (8)
With
Kd: equilibrium constant,
T: temperature (K),
R: gas constant (8.31447 J.moL-1.K-1).
These parameters predict spontaneity, feasibility and exchange achieved at the adsorbent-adsorbate system. The Van’t Hoff equation allows us to estimate ΔH and ΔS values:
![]()
They are deduced from the plots of Ln Kd vs (1/T). Table 5 gathers the thermodynamic parameters of MB and CV adsorption on OC. For temperature range from 25 to 100°C, The negative values of ΔG° shows that the process is spontaneous and feasible37. While the process is endothermic since the values of ΔH° are positive. Also, the positive values of ΔS° reveal a good affinity of MB and CV for OC and indicated the increasing in the degree of disorder at the solid/solution interface during the process.38
Table 5: Parameters of thermodynamic study.
|
ΔG° (kj.mol-1) |
ΔH° (kj.mol-1) | ΔS°(j.mol-1.K-1) | R2 | ||||
|
T (K) |
|||||||
| Adsorbat |
298 |
303 |
313 |
323 |
|||
| CV | -3.763 | -5.093 | -5.979 | -6.865 | 22,647 | 88,627 | 0,944 |
| MB | -0.802 | -0.092 | -0.380 | -0.853 | 14,907 | 47,330 | 0,901 |
Conclusion
This study has demonstrated the effectiveness of Moroccan Olive Core in removing MB and CV dyes in aqueous solution. Lots of parameters related to the operating conditions are examined (initial concentration of dyes, contact time, pH and temperature). According to the kinetic study, the equilibrium is established after 40 minutes respectively for MB and CV solutions at 10, 20 and 30 mg.l-1 and the adsorption kinetic was perfectly described by the pseudo-second-order model. The plot of the adsorption isotherms shows that the adsorption of MB and CV on the Moroccan Olive Core is well represented by the Langmuir model with a maximum adsorption capacity respectively of 12.22 mg.g-1 and 19.19 mg.g-1 for MB and CV. Freundlich model fit well as the Langmuir model with high correlation coefficient for both dyes. The thermodynamic parameters obtained suggest that the adsorption of the studied dyes on Moroccan Olive Core is a spontaneous and endothermic process. Moroccan Olive Core has been found to be a carrier which has a generally moderate adsorption affinity to the methylene blue and crystal violet dyes. The abundance of this agriculture waste, generated by olive transformation, can provide a low-cost adsorption material that can potentially contribute to the treatment of concentrated effluents with dyes. One of the ways to develop is the chemical or physical activation of this bio-adsorbent to increase the bioavailability of adsorption sites and to improve the process.
Acknowledgment
The authors acknowledge sincerely the help delivered by the Department of Process Engineering of the Higher School of Technology of Sidi Mohammed Ben Abdellah University for the resources provided to carry out this research.
References
- Yagub, M, T.; Sen, T. K.; Afroze, S.; Ang, H.M. Adv. Colloid. Interface Sci. 2014. 209. 172–84.
CrossRef - Ooi, J.; Lee,L.Y.; Zhang Hiew, B.Y.; Thangalazhy-Gopakumar, S.; Lim, S.S. ;
- Gan, S. Bioresour. Technol. 2017. 245. 656–64
CrossRef - Oz, M.; Lorke, D.E.; Hasan, M.; Petroianu, G.A. Med. Res. Rev. 2011. 31. 93–117.
CrossRef - Bentama, J.; Ouazzani, K.; Lakhliai, Z.; Ayadi. M. Desalination. 2004. 168. 295-9.
CrossRef - Anjaneyulu, Y.; Sreedhara Chary, N.; Samuel Suman Raj, D. Rev. Enviro. Sci. Biotechnol. 2005. 4. 245–73.
CrossRef - Pavan, F.A.; Lima, E.C.; Dias, S.L.P.; Mazzocato, A.C. J. Hazard. Mater. 2008, 150. 703–12.
CrossRef - Bhatnagar, A.; Vilar, V.J.P.; Botelho, C.M.S.; Boaventura, R.A.R. Environ. Technol. 2011. 32. 231–49.
CrossRef - Dhaouadi, H.; M’Henni, F. Chem. Eng. J. 2008, 138. 111–9.
CrossRef - Figueiredo, S.A.; Boaventura, R.A.; Loureiro, J.M. Purif. Technol. 2000, 20. 129–41.
CrossRef - El Imache, A.; Dousset, S.; Satrallah, A.; Dahchour, A. J. Enviro. Sci. Health. Part B. 2012, 47. 161-7.
- Shawabkeh, R.A.; Tutunji, M.F. Appl. Clay Sci. 2003, 24. 111–20.
CrossRef - Kaouah, F.; Boumaza, S.; Berrama, T.; Trari, M.; Bendjama, Z. J. Clean. Prod. 2013, 54. 296-306.
CrossRef - Département de l’agriculture, Ministère de l’agriculture, de la pêche maritime, du développement rurale, des eaux et des forêts.
CrossRefhttp://www.agriculture.gov.ma. - Levin, R.L.; Degrange, M.A.; Bruno, G.F.; Del Mazo, C.D.; Taborda, D.J.; Griotti, J.J.; Boullon, F.J. Ann. Thorac. Surg. 2004. 77. 496–9.
CrossRef - Adams, E. Q.; Rosenstein, L. J. Am. Chem. Soc. 1914. 36. 1452–73.
CrossRef - Nandi, B. K.; Goswami, A.; Das, B.; Mondal, A. K.; Purkait, M. K. Sep Sci Technol. 2008. 43. 1382–403.
CrossRef - Duran, C.; Ozdes, D.; Gundogdu, A.; Senturk, H.B. J. Chem. Eng. Data. 2011. 56. 2136–47.
CrossRef - Nandi, B.; Goswami, A.; Purkait, M. Appl. Clay Sci. 2009. 42. 583–90.
CrossRef - Yao, Y.; He, B.; Xu, F.; Chen, X. Chem. Eng. J. 2011.170.82-98.
- Adak, A.; Bandyopadhyay, M.; Pal, A. Sep. Purif. Technol. 2005. 44.139–44.
- Sadaf, S.; Bhatti, H.N. J. Taiwan Inst. Chem. Eng. 2014. 45. 541–53.
- Belala, Z.; Jeguirim, M.; Belhachemi, M.; Addoun, F.; Trouvé, G. Desalination. 2011. 271. 80–7.
CrossRef - Ferreiraa, B.C.S.; Teodorob, F.S.; Magesteb, A.B.; Gil, L.F.; Pereira de Freitas, R.; Vinícius Alves-Gurgelb, L. Ind. Crops Prod. 2015. 65. 521–34.
CrossRef - Bentahar, S.; Dbik, A.; El Khomri, M.; El Messaoudi, N.; Lacherai, A. J. Enviro. Chem. Eng. 2017. 5. 5921–32.
- Senturk, H.B.; Ozdes, D.; Duran, C. Desalination. 2010. 252. 81–7.
CrossRef - Langmuir, I.; J. Chem. Soc., 1916. 38. 2221–95.
CrossRef - Freundlich, H.M.F. J. Phys. Chem. 1906. 57A. 385–470.
- Fideles, R.A.; Ferreira, G.M.D.; Teodoro, F.S.; Adarme, O.F.H.; Mendes da Silva, L.H.; Gil, L.F.; Gurgel, L.V.A. J. Colloid Interface Sci. 2018. 515. 172–88.
CrossRef - Annadurai, G.; Juang, R.S.; Lee, D.J. J Hazard Mater. 2002. 92. 263–74.
CrossRef - Vadivelan, V.; Kumar, K.V. J Colloid Interface Sci. 2005. 286. 90–100.
CrossRef - Sharma, Y.C.; Upadhyay, S.N. Energy Fuels. 2009. 23. 2983–8.
CrossRef - Parab, H.; Sudersanan, M.; Shenoy, N.; Pathare, T.; Vaze. B. Clean – Soil, Air, Water. 2009. 37. 963–9.
CrossRef - Chakraborty, S.; Chowdhury, S.; Das Saha, P. Carbohydr. Polym. 2011. 86. 1533–41.
CrossRef - Chakraborty, S.; Chowdhury, S.; Saha, P.D. Appl. Water Sci. 2012. 1–7.
- Fayoud, N.; Alami Younssi, S.; Tahiri, S.; Albizane, A. J. Mater. Environ. Sci. 2015.11. 3295-306.
- El sayed, G. O. Desalination. 2011, 272, 225–232.
- Shoukat, S.; Bhatti, H.N.; Iqbal, M.; Noreen, S. Micropor. Mesopor. Mat. 2017. 239. 180-9
CrossRef - Belaid, K.D.; Kacha, S. J. Water Sci. 2011. 242. 131–44.
- Bayramoglu, G.; Altintas, B.; Yakup Arica, M. Chem. Eng. J. 2009. 152. 339–46.
CrossRef

This work is licensed under a Creative Commons Attribution 4.0 International License.
![]()
A New Edition of Web of Science
Journal Impact Factor
2022: 0.5
Five Year: 0.8
Journal is Indexed in

Cabells Whitelist
![]()


