The Catalytic Performance of ZrO2-SO4 and Ni/ZrO2-SO4 Prepared from Commercial ZrO2 in Hydrocracking of LDPE Plastic Waste into Liquid Fuels
Amalia Kurnia Amin , Karna Wijaya and Wega Trisunaryanti
Department of Chemistry, Faculty of Mathematics and Natural Sciences, Universitas Gadjah Mada, Sekip Utara Bulaksumur, Yogyakarta, 55281, Indonesia.
Corresponding Author E-mail: karnawijaya@ugm.ac.id
DOI : http://dx.doi.org/10.13005/ojc/340650
Article Received on : 11-09-2018
Article Accepted on : 08-11-2018
Article Published : 12 Nov 2018
Catalytic activity and selectivity toward liquid fuels production of ZrO2, SZ, 0.5NiSZ, 1.0NiSZ, and 1.5NiSZ catalysts with different physicochemical properties, in hydrocracking process upon the second stage of sequential LDPE plastic conversion method after pyrolysis process, were examined. The hydrocracking reaction was carried out at 300°C under 20 mL/min of hydrogen gas flow for 1 h. Modifying commercial ZrO2 with sulfate and Ni enhances the acidity of catalyst, even though there is a decrease in surface area. The increase in acidity of catalyst results in the higher liquid fuels conversion. The presence of nickel reduces olefins content and aromatic content of liquid product, and also reduces coke formation. The highest liquid yield (44.32%) that composed by 66.25% fraction of gasoline is produced over 1.5NiSZ which has the highest catalyst acidity.
KEYWORDS:Hydrocracking; LDPE Plastic; Liquid Fuels; Ni, ZrO2-SO4
Download this article as:| Copy the following to cite this article: Amin A. K, Wijaya K, Trisunaryanti W. The Catalytic Performance of ZrO2-SO4 and Ni/ZrO2-SO4 Prepared from Commercial ZrO2 in Hydrocracking of LDPE Plastic Waste into Liquid Fuels. Orient J Chem 2018;34(6). |
| Copy the following to cite this URL: Amin A. K, Wijaya K, Trisunaryanti W. The Catalytic Performance of ZrO2-SO4 and Ni/ZrO2-SO4 Prepared from Commercial ZrO2 in Hydrocracking of LDPE Plastic Waste into Liquid Fuels. Orient J Chem 2018;34(6). Available from: http://www.orientjchem.org/?p=52408 |
Introduction
Very abundant plastic waste around the world is dominated by polyolefin, especially low-density polyethylene (LDPE) originated from a carrier bag and food packaging as a single-used product.1 Most of discarded plastics end up in landfills and seawater.2 Accumulation of plastic waste that always increases every year has a serious impact on environmental, health, and sustainability issues. This fact encourages the pursuit of proper handling of plastic waste. Plastic as petroleum derivative products are composed of long-chain hydrocarbon and stores of large heating values potentially converted to liquid fuels.3 Waste energy recovery system based on plastic waste is considered more efficient than biomass conversion as the plastic is hydrophobic and absorbs no moisture.4-6 Hydrocracking process commonly used for petroleum refining, seems promising to convert plastic into fuels. The addition of H2 gas or hydride donors in the reaction system reduces the deactivation rate of catalyst.
In recent years, solid acid catalyst based on metal oxide has attracted much attention in refinery and plastic waste treatment.6 According to the mechanism of petroleum cracking, the acidity of acid catalyst takes control of product selectivity. Basically, the higher its acidity, the better catalytic activity for producing of gasoline fraction at mild reaction condition or lower temperature operation.4 The used of the modified ZrO2 with sulfate is expected to be a promising material of solid acid catalyst in hydrocracking process as ZrO2 has excellent physicochemical properties, such as high thermal stability, high mechanical stability, noncorrosive, low thermal conductivity, adjustable acidity, and relatively constant surface area at high thermal operational.7-10 Sulfation of ZrO2 with various anion sulfate source is a kind of method to enhance its acidity. That treatment would increase the number of active surface site (Brønsted and Lewis acidic sites).9,10
Although ZrO2-SO4 (SZ) has been widely used in various hydrocracking process, there are limitations that reduce performance of SZ. SZ deactivates quickly due to the formation of coke during catalytic reaction and reduction of the oxidation state of sulfur in the surface sulfate resulting in decreasing in acid strength.11 In order to enhance coke resistance, retard deactivation of SZ and generate hydro-reforming process, SZ catalyst containing small amount of nickel metal was developed. In comparison to another transition metals, when nickel is supported on SZ, the combination gives a cheapness bifunctional catalyst type and comparatively more active.4
In the present research, a series of Ni promoted sulfated zirconia (NiSZ) was synthesized from commercial ZrO2 as starting material, sulfuric acid (H2SO4) as sulfating agent and nickel nitrate hexahydrate (Ni(NO3)2·6H2O) as metal precursor. Therefore, oil hydrocracking resulted from LDPE pyrolysis using ZrO2, SZ and NiSZ are investigated to examine correlation of the effect of sulfate and nickel addition on the physicochemical properties of modified zirconia that will be related to the catalytic activity and selectivity. The structural and chemical properties of catalyst have a direct impact on catalytic activity and selectivity.
Experimental
Materials
The commercial ZrO2 (60-70 nm in size) was purchased from Jiaozou Huasu Chemical Co., Ltd, China. The H2SO4 (98%), Ni(NO3)2·6H2O, NH4OH (25%), and pyridine were analytical grade and purchased from Merck. The hydrogen gas was supplied from Samator Ltd, Yogyakarta, Indonesia. The uncolored LDPE plastics were collected from household waste and market waste in Yogyakarta, Indonesia.
Methods
Sulfation of the Commercial ZrO2
The commercial ZrO2 was impregnated by the wet impregnation method, according to other researchers9,10 with slight modification. The 10 g of ZrO2 powder was slurried with 150 mL of 0.8 M H2SO4 solution at room temperature for 24 hours whereupon the slurry ZrO2-SO4 was dried overnight and calcined at 400°C for 4 hours. This material sample was denoted as SZ.
Ni impregnation on the ZrO2-SO4 (SZ)
The 10 g SZ was impregnated by refluxing with 100 mL of Ni(NO3)2·6H2O solution that corresponded to 0.5, 1.0, or 1.5 wt% of Ni at 90°C for 4 h. Subsequently, the slurry material was dried. The dry material was then calcined at 500°C for 4 hours. Thereafter, the Ni2+ on the material was reduced to Ni0 by H2 gas stream (20 mL/min in flow) at 400°C for 3 hours to have 0.5NiSZ, 1.0NiSZ or 1.5NiSZ.
Materials Catalyst Characterization
Sorption of ammonia and pyridine over samples of catalyst was applied for acidic strength determination using gravimetric method. The acidity value was calculated according to the equation below:

FTIR spectra of all prepared catalyst in range 4000-500 cm-1 were recorded on Shimadzu Prestige-21 infrared spectrophotometer using KBr pellet at room temperature for acid type identification.
Diffraction patterns were recorded on an XRD Rigaku Multiflex, using CuKα (λ=1.5406°C) radiation source operated at 40 kV and 30 mA for crystalline structure characterization and crystallite size determination. The scanning step size and range of 2θ for analysis were 0.02°/s and 20-70°C respectively. N2 adsorption-desorption isotherms were measured at liquid nitrogen temperature with a gas sorption analyzer (Quantachrome NOVA 1200e) for calculation of pore volume, pore diameter, and specific surface area. The pore volume and pore diameter were calculated by applying BJH method, whereas the specific surface area was calculated based on BET method. For each analysis, 0.2 g of sample catalyst was used. The degassing of samples was completed at 200°C for 4 hours. The thermal stability was evaluated by thermo-gravimetric analysis (TGA) in the air atmosphere using TG/DTA Diamond analyzer. About 20 mg of catalyst was heated from 30°C to 1000°C at heating rate 10°C/min. TEM measurements of catalyst were performed on JEOL JEM-1400 transmission electron microscope operated at 120 kV to analyzed the morphology of catalyst. Prior to TEM analysis, 1 mg of sample was dispersed ultrasonically in ethanol. Then 10 μL of suspension was put on a carbon-coated copper grid to take images. Surface topography and sulfur content were obtained by SEM-EDX JEOL JED-2300 at 20 kV accelerating voltage. The Ni contents of the sample were determined by Atomic absorption spectroscopy (AAS) on ContrAA 300 Analytic Jena equipment. Prior to AAS analysis, the sample was first destructed by acid treatment with HF and aqua regia for 24 h. Then the destructed sample was diluted and filtered. The filtrate was analyzed at 232 nm, 11 mA of cathode lamp.
Sequential Cracking Process (Thermal-Catalytic)
The LDPE plastic wastes were washed, dried under the sunshine, cut into small pieces, and thermally cracked in stainless-steel pyrolysis reactor (Fig. 1) at 300 – 400°C for 3– 4 hours. The vapor was condensed into a liquid phase (oil). The oil resulting from LDPE waste pyrolysis was then used as a feedstock in hydrocracking process. Typically, in each experiment, 10 g of pyrolysis product and 0.1 g of catalyst (ZrO2, SZ, 0.5NiSZ, 1.0NiSZ or 1.5NiSZ) were added into semi-bed hydrocracking micro-reactor (Fig. 2). Subsequently, the hydrocracking reaction was carried out at 300 °C for 1 h under 20 mL/min of hydrogen loading. The conversion yield is calculated by using the following equations:
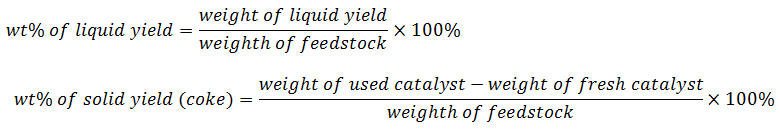
wt% of gas yield =100% – (wt% of liquid yield + wt% of solid yield)
The liquid hydrocracking product and liquid pyrolysis product were analyzed by gas chromatography-mass spectrometry (GC-MS) on QP2010S Shimadzu, using a 30 m length x 0.25 mm i.d. AGILENTJ&W DB-1 column (crossbond 100% dimethylpolysiloxane) to confirm the formation of gasoline and diesel fraction.
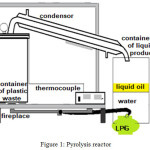 |
Figure 1: Pyrolysis reactor. |
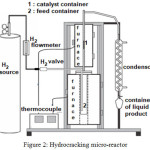 |
Figure 2: Hydrocracking Micro-Reactor. |
Result and Discussion
Catalyst Characterization
The XRD patterns of commercial zirconia (ZrO2), SZ, 0.5NiSZ, 1.0NiSZ, and 1.5NiSZ catalysts are shown in Fig. 3. The XRD patterns reveal that samples are showing monoclinic crystal phase for ZrO2. All sample, displayed a well distinguished diffraction peak at 2θ of about 28°C and 31°C, assigned to (11-1) and (111) reflection planes of monoclinic crystal phase of ZrO2 (JCPDS: 00-007-0343). Yadav and Nair12 had reported that ZrO2 has three type of polymorph, namely monoclinic, tetragonal, and cubic. The monoclinic phase is stable at below 1140°C, tetragonal phase is stable at 1140-2370°C, and cubic phase is stable above 2370°C.
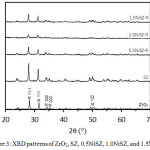 |
Figure 3: XRD patterns of ZrO2, SZ, 0.5NiSZ, 1.0NiSZ, and 1.5NiSZ. |
Based on the XRD data, crystallite sizes of ZrO2 were calculated by applying the Debye-Scherrer equation: D = 0.9λ/βcosθ, where D is the average crystallite size, λ is the X-ray wavelength (0.15406 nm), β is the full width at half maximum (FWHM) in radians, and θ is the Bragg diffraction at the most intense peak (here 11-1). The calculation is summarized in Table 1. Sulfate modified ZrO2 affects in an increase of crystallite size of ZrO2 due to anionic species on the surface triggering the growth of the crystal. There was an aggregation of sulfate groups on zirconium crystals.13,14 Afterward, the addition of Ni up to 1.0 wt% could be generated for decreasing crystallite size, as expected. It could be associated with reduced anionic strength on the surface of the ZrO2 crystals. Unfortunately, by using 1.5 wt% Ni, the crystallite become bigger.
Textural properties of commercial ZrO2 and modified ZrO2 catalysts are displayed in Table 1. ZrO2 and all prepared catalyst exhibit mesoporous materials (15.20 –23.00 nm). The surface area decreases from ZrO2 to SZ and further decreases for NiSZ, as sulfate and metal loading. This is due to sulfate and/or Ni was dispersed, covers the external surface and even blocks or partly fills the internal surface (pore) of ZrO2 framework, dropping the mesoporous volumes. Previous researchers9,10 reported that the specific area of SZ decreased from ZrO2 nanopowder. Similar result for decreases surface area due to partial blockage of pores with Ni metal component reported by other researcher.15
Table 1: Textural properties of catalyst.
| Sample | Crystallite size (nm) | SBET (m2/g) | Vp (cm3/g) | Pore diameter (nm) |
| ZrO2 | 32.49 | 17.37 | 0.099 | 23.00 |
| SZ | 35.89 | 13.44 | 0.051 | 15.20 |
| 0.5NiSZ | 31.58 | 9.20 | 0.046 | 20.17 |
| 1.0NiSZ | 21.89 | 11.68 | 0.060 | 20.60 |
| 1.5NiSZ | 36.35 | 10.57 | 0.055 | 20.92 |
The SEM image in Fig. 4 exhibits that the surface topography of ZrO2, SZ, and NiSZ are grainy of irregular-form aggregate. The aggregate enlarged at the addition of sulfate and nickel. Through the addition of sulfate, the presence of agglomerates of particles with different size and disordered shape are obtained by joining very small particles.9 The decrease in surface area is also associated with increasingly intense aggregation between particles after sulfation and metal impregnation. A more detailed view on catalyst morphology was obtained by TEM analysis. TEM image (Fig. 5) revealed that particles of all catalyst system are agglomerated form. There are aggregate particles, even no individual particles were detected. The darker spot are represent the more aggregation particles. In the addition of Ni, there is occurrence of Ni aggregates on the external surface of ZrO2 aggregates, marked by the appearance of small lighter spots surrounding the large dark spot.
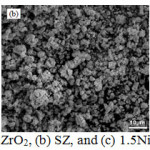 |
Figure 4: SEM image of (a) ZrO2, (b) SZ, and (c) 1.5NiSZ. Click here to View figure |
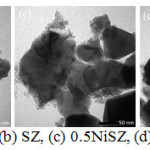 |
Figure 5: TEM image of (a) ZrO2, (b) SZ, (c) 0.5NiSZ, (d) 1.0NiSZ and (e) 1.5NiSZ. |
The acidity of ZrO2, SZ, 0.5NiSZ, 1.0NiSZ, and 1.5NiSZ was determined by gravimetric method of sorbed base molecules, including ammonia and pyridine into acidic sites of those catalysts. The acidity values are summarized in Table 2. Compared to ZrO2, the acidity of SZ and NiSZ gradually increased, as expected. This is due to the presence of sulfate groups on the surface of ZrO2 that would lead the formation of more acidic sites (Brønsted acid and Lewis acid) and the present of Ni metal that would increase the Lewis acidic sites9,10. The highest acidity was reached in 1.5NiSZ, prepared by using the highest nickel salt concentration as Ni metal precursor. The FTIR spectra of chemisorbed ammonia and pyridine on ZrO2 and prepared catalyst materials were also presented in Fig. 6 for further identification of the type of the acidic sites generated as that ammonia and pyridine are selectively adsorb on both Lewis and Brønsted acidic sites.
Table 2: Acidity of catalyst.
| Sample | Acidity (mmol NH3/g catalyst) | Acidity (mmol pyridine/g catalyst) |
| ZrO2 | 0.16 | 2.07 |
| SZ | 1.70 | 3.54 |
| 0.5NiSZ | 1.79 | 3.94 |
| 1.0NiSZ | 2.25 | 4.19 |
| 1.5NiSZ | 2.72 | 5.82 |
In Fig. 6.a, the band at around 1630 and 1115 cm-1 that appeared in all material are typical of ammonia coordinated to Lewis acidic sites. The band at 1400 cm-1 has corresponded to ammonium ion coordinately bonded to Brønsted acidic sites.9,10,16 The evaluation of Lewis and Brønsted acidic sites based on pyridine probe is shown in Fig. 6.b. The vibrational pyridine coordinated to Lewis sites is appeared at 1630 and 1457 cm-1, while the pyridium ion sorbed on S=O bond of Brønsted sites is observed at 1545 cm-1.17-20 Overall, it can be evident that the increasing Brønsted sites mainly occur in the addition of sulfate groups (S=O bond) and the increasing Lewis sites is equivalent to the increasing amount of nickel metal. The sulfur and nickel content of the SZ and NiSZ are listed in Table 3.
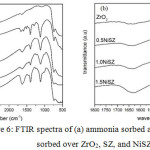 |
Figure 6: FTIR spectra of (a) ammonia sorbed and (b) pyridine sorbed over ZrO2, SZ, and NiSZ. |
Surface composition of ZrO2, SZ, and 1.5NiSZ was analyzed by EDX as shown in Table 3. The decrease in sulfur content can be observed in 1.5NiSZ. It is reflects decreasing sulfate dispersion, in association with the release of some sulfate groups during impregnation of nickel. 1.5NiSZ containing maximum weight % of nickel. The observed nickel contents in the catalyst system are lower than the theoretical nickel content in the Ni salt used due to the competition of metal interaction on SZ catalyst support.
Table 3: Elemental content of catalyst.
| Sample |
Elements (weight %) |
|||||
| Zr a | O a | S a | Ni a | Ni b | ||
|
ZrO2 |
67.20 | 32.80 | – | – | ||
|
SZ |
68.61 | 30.23 | 1.16 | – | ||
|
0.5NiSZ |
0.43 | |||||
|
1.0NiSZ |
0.74 | |||||
|
1.5NiSZ |
68.09 | 30.01 | 0.56 | 1.34 | 1.15 | |
| aEDX element analysis | bAAS element analysis | |||||
The TGA curves of SZ and NiSZ were shown in Fig. 7. Although ZrO2 was thermally stable, a TGA curve of SZ showed a loss of 9,72% of its weight on heating up to 1000°C. The more relatively stable catalyst weight for thermal treatment is shown by NiSZ, which only loses weight by 1,89%. The weight loss below 300°C is attributed to the removal of hydration water and dehydroxylation of hydroxyl groups.21,22 The sharp weight loss TGA curve of SZ at 450 – 660°C is indicated for gradual decomposition of sulfate groups. At above 660°C and ended at 930°C, there were very minor weight loss as the sulfate groups on the SZ and NiSZ is almost fully decomposed.21,23 In this case, it is proven that the optimum calcination of SZ in order to have the highest sulfate content is about 400°C. The NiSZ have a lower weight loss compared to SZ due to the sulfate content of NiSZ is lower than SZ.
 |
Figure 7: TGA weight loss curves of SZ and NiSZ when heated in N2. |
Sequential Thermal Cracking – Catalytic Hydrocracking Experiments
This experiment has initially conducted a pyrolysis of solid LDPE plastic waste, followed by a catalytic hydrocracking of the liquid product obtained to optimize further the properties of the final liquid product, targeted to improve quantity and quality of gasoline fraction.9 The LDPE plastic viscosity has been reduced in the pyrolysis stage, yielding 38.31 wt% and 61.69 wt% of gasoline and diesel fractions, respectively (Fig. 8). Thus, the workload catalyst would be lighter. The catalyst performance is focused on further cracking-reforming process. The hydrocracking process has been proven capable to increase the portion of gasoline fraction of liquid yield, i.e. by using 1.5 NiSZ catalyst resulted in 66.25 wt% of gasoline (Figure 8). The total conversion of 100 wt% feedstock from hydrocracking treatment has produced gas, liquid, and solid products. The activity of each catalyst can be viewed in Figure 9.
Gas, liquid, and solid products derived from the second stage of LDPE waste treatment use various catalyst and those without catalyst is shown in Figure 9. The result indicates that total conversion of liquid product increases as a function of the presence of catalyst, while the gas fraction decreases. The formation of low molecular size (gas) could be depressed due to the different reaction mechanism between thermal hydrocracking and catalytic hydrocracking, namely a radical intermediate species versus a carbenium-ion intermediate species.24
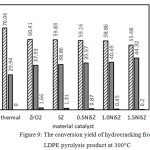 |
Figure 8: Characteristic of feedstock and liquid yield from hydrocracking of the feedstock. |
There was more intense cracking over thermal hydrocracking. In addition to cracking reaction, the main reaction that occurs in catalyzed hydrocracking is hydrogenation and hydroisomerization. Al-Salem et al.,3 explained that tertiary reactions involving catalyst will result into the development of coke and contribute to the production of aromatics from alkanes and alkenes. Moreover, catalyst acidity plays an important role in hydrocracking. The selectivity of volatile products is known to vary by changing the acidity of the catalyst.5 Based on the data in Fig. 9, there is correlation between the acidity of catalyst and the amount of liquid fraction produced. As the acidity of catalyst increases, selectivity to liquid yield formation gets higher.
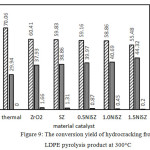 |
Figure 9: The conversion yield of hydrocracking from LDPE pyrolysis product at 300°C. |
Refer to Fig. 9, it is evident that the addition of sulfate and Ni (transition metal element) into ZrO2 catalyst also affected in the decreasing coke formation or solid yield on internal wall of the reactor and the catalyst surface. Cokes are identified as the difference weight of fresh catalyst and used catalyst. Compared with the use of ZrO2 (1.66 wt%), the use of SZ can reduce coke formation up to 1.31 wt%. The greater decreasing coke products occur in using NiSZ. Furthermore, there was a gradual decrease in coke deposition as the Ni0 content in NiSZ increased (Fig. 9). The addition of nickel metal has an effect on the decline in coke up to the yielding less than 1 wt%. Escola et al.5 explained that metal and acidic sites in the catalyst appear to be well-balanced to reduce an aromatization and coke formation.
The GC chromatograms of liquid fuels produced by hydrocracking over 0.5NiSZ, 1.0NiSZ, and 1.5NiSZ are shown in Fig. 10, 11, and 12. Base on Figure 10, 11, and 12, the product distribution of liquid products consist of gasoline fraction (C5 – C12) in retention time range of 0 – 10 minutes and diesel fraction (C13 – C20) in retention time range of > 10 minutes. Concerning the obtained liquid products, based on GC-MS data, composition and carbon number distribution of these hydrocarbon compounds of liquid products have been summarized in Table 4. Liquid products obtained over 1.5NiSZ contain more saturated compound (n-paraffins, iso-paraffins, and naphthenes) and less aromatics than those obtained over 1.0NiSZ and 0.5NiSZ which have lower nickel content. It could be suggested that hydrogenation-dehydrogenation of intermediate product as a kind of reaction in hydrocracking process more intensively occurs in using 1.5NiSZ as more amount of metal function. This indicates that hydrogenation activity of 1.5NiSZ was higher than 1.0NiSZ and 0.5NiSZ.
The selectivity of 1.5NiSZ, 1.0NiSZ and 0.5NiSZ catalyst toward production of gasoline fraction are 61.21%, 62.88%, and 66.25%, respectively. With a high acid strength and a weak hydrogenation component in catalyst, the hydroisomerization of olefins form carbonium ion preferentially, the carbonium ion then undergoes isomerization and further cracking, it leads to produce many more iso-paraffins and lighter hydrocarbons. However, a lower metal function leads to the incomplete hydrogenation of olefins. The active hydrogenation component lowers the ratio of iso- to n-paraffins because hydrogenation of olefins is the predominant reaction.25 These catalytic activity and selectivity are correlated to the physicochemical properties of modified catalysts.
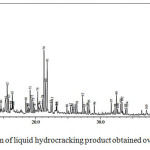 |
Figure 10: Chromatogram of liquid hydrocracking product obtained over 0.5NiSZ. |
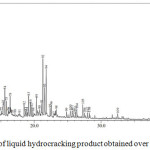 |
Figure 11: Chromatogram of liquid hydrocracking product obtained over 1.0NiSZ. |
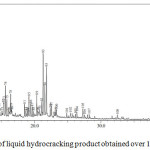 |
Figure 12: Chromatogram of liquid hydrocracking product obtained over 1.5NiSZ. |
Table 4: Comparison of liquid products obtained from hydrocracking of LDPE pyrolysis product.
| Material catalyst | 0.5NiSZ | 1.0NiSZ | 1.5NiSZ |
| Carbon number distribution of fuels-like compounds in liquid products (wt%) | |||
| C5 | 0.66 | 0.62 | – |
| C6 | 2.99 | 2.47 | 1.01 |
| C7 | 5.07 | 5.65 | 3.45 |
| C8 | 8.61 | 11.64 | 8.44 |
| C9 | 21.5 | 23.56 | 30.96 |
| C10 | 9.1 | 5.63 | 6.72 |
| C11 | 8.7 | 10.54 | 11.22 |
| C12 | 4.58 | 2.77 | 4.45 |
| C13+ | 30.38 | 29.68 | 29.86 |
| Composition of liquid products (wt%) | |||
| n-paraffins | 12.26 | 11.68 | 13.04 |
| Isoparaffins | 9.04 | 8.54 | 8.81 |
| Naphthenes | 12.5 | 14.05 | 17.63 |
| Olefins | 58.97 | 56.68 | 55.26 |
| Aromatics | 3.48 | 3.12 | 1.37 |
Conclusion
The SZ, 0.5NiSZ, 1.0NiSZ, and 1.5NiSZ were successfully prepared and tested in hydrocracking oil from solid waste of LDPE pyrolysis. Modifying ZrO2 with sulfate and Ni has been proved capable to increase the acidity significantly, but also has an impact to decrease in surface area. The series of NiSZ catalyst shows bifunctional properties with a mesopore pore size distribution, containing 0.43-1.15 % Ni. The addition of sulfate and nickel enhances both liquid yield and gasoline fraction of liquid product. The presence of nickel reduces olefins content and aromatic content of liquid product, and reduces coke formation. The increase in the nickel content of NiSZ catalyst enhances the extent of hydrogenating-hydro-isomerization olefins to paraffins and promotes hydrocracking to produce more gasoline.
Acknowledgments
The authors express the gratitude to the Indonesia Ministry of Research, Technology, and Higher Education (DRPM-DIKTI, Project trace PMSDU 2027/UN1/DITLIT/DIT-LIT/LT/2018) for their financial support to this research.
References
- Scott, D. S.; Majerski, P.; Piskorz, J.; Radlein, D.; Barnickel, M. Can. J. Chem. Eng. 1999, 77, 1021-1027.
CrossRef - Kunwar, B.; Cheng, H. N.; Chandrashekaran, S. R.; Sharma, B. K. Renew. Sust. Rev. 2016, 54, 421-428.
CrossRef - Al-Salem, S. M.; Antelava, A.; Constantinou, A.; Manos, G.; Dutta, A. J. Environ. Manage. 2017, 197, 177-198.
CrossRef - Jing, P.; Li, Q.; Han, M.; Sun, D.; Jia, L.; Wang, W. Front. Chem. Eng. China 2008, 2, 186-190.
CrossRef - Escola, J. M.; Aguado, J.; Serrano, D. P.; Briones, L.; Díaz de Tuesta, J. L.; Calvo, R.; Fernandez, E. Energy Fuels 2012, 26, 3187-3195.
CrossRef - Insura, N.; Onwudili, J. A.; Williams, P. T. Energy Fuels 2010, 24, 4231-4240.
CrossRef - Fatimah, I.; Wijaya, K.; Setyawan, K.H. Bull. Chem. React. Eng. Catal. 2008, 3, 9-13.
CrossRef - Dobrosz-Gómez, I.; Gómez-Garcıá, M. Á.; Bojarska, J.; Kozanecki, M.; Rynkowski, J. M. C. R. Chim. 2015, 18, 1094-1105.
CrossRef - Utami, M.; Wijaya, K.; Trisunaryanti, W. Mat. Chem. Phys. 2018, 213, 548-555.
CrossRef - Hauli, L.; Wijaya, K.; Armunanto, R. Orient. J. Chem. 2018, 34, 1559-1564.
CrossRef - Li, B.; Gonzalez, R. D. Ind. Eng. Chem. Res. 1996, 35, 3141-3148.
CrossRef - Yadav, G. D.; Nair, J. J. Microporous Mesoporous Mater. 1999, 33, 1-48.
CrossRef - Clearfield, A.; Serrette, G. P. D.; Khazi-Syed, A. H. Catal. Today 1994, 20, 295-312.
CrossRef - Nayebzadeh, H.; Saghatoleslami, N.; Maskooki, A.; Vahid, B. R. Chem. Biochem. Eng. Q. 2014, 28, 259-265.
CrossRef - Suseno, A.; Wijaya, K.; Trisunaryanti, W.; Roto. Orient. J. Chem. 2018, 34, 1427-1431.
CrossRef - Ejtemaei, M.; Tavakoli, A.; Charchi, N.; Bayati, B.; Babaluo, A. A.; Bayat, Y. Adv. Powder Technol. 2014, 25, 840-846.
CrossRef - Barzetti, T.; Selli, E.; Moscotti, D.; Forni, L. J. Chem. Sos., Faraday Trans. 1996, 92, 1401–1407.
CrossRef - Pérez, M.; Armendáriz, H.; Toledo, J. A.; Vázquez, A.; Navarrete, J.; Montoya, A.; Gárcia, A. J. Mol. Catal. A. Chem. 1999, 149, 169-178.
CrossRef - Fatimah, I.; Rubiyanto, D.; Huda, T.; Handayani, S.; Ilaihi, O. M.; Yudha, S. P. Eng. J. 2015, 19, 43-53.
CrossRef - Fatimah, I.; Narsito; Wijaya, K. Indo. J. Chem. 2009, 1, 6-12.
- Shah, A. K.; Kumar, M.; Abdi, S. H. R.; Kureshy, R. I.; Khan, N. H.; Bajaj, H. C. Appl. Catal. Gen. 2014, 486, 105-114.
CrossRef - Noda, L. K.; Gonçalves, N. S.; de Borba, S. M.; Silveira, J. A. Vib. Spec. 2007, 44, 101-107.
CrossRef - Mftah, A.; Alhassan, F. H.; Al-Qubaisi, M. S.; Zowalaty, M. E. E.; Webster, T. J.; Sh-eldin, M.; Rasedee, A.; Taufiq-Yap, Y. H.; Rashid, S. S. Int. J. Nanomedicine 2015, 10, 765-774.
CrossRef - Sie, S. T. Ind. Eng. Chem. Res. 1993, 32, 397-402.
CrossRef - Ding, F.; Luo, C.; Zhang, H.; Xiong, L; Chen, X. D. Petrol. Sci. Technol. 2015, 33, 1846-1852.
CrossRef

This work is licensed under a Creative Commons Attribution 4.0 International License.
![]()
A New Edition of Web of Science
Journal Impact Factor
2022: 0.5
Five Year: 0.8
Journal is Indexed in

Cabells Whitelist
![]()


