Synthesis of Silver Nanoparticles Using Muntingia Calabura L. Leaf Extract As Bioreductor and Applied As Glucose Nanosensor
Abdul Wahid Wahab1 , Abdul Karim1, Nursiah La Nafie1, Nurafni1 and I. Wayan Sutapa2
1Department of Chemistry, Faculty Mathematics and Natural Science, Hasanuddin University Jl. Perintis Kemerdekaan 90245, Makassar-Indonesia.
2Department of Chemistry, Faculty Mathematics and Natural Science, Pattimura University, Jl. Ir. Putuhena, No. 1 Poka - Ambon, Maluku-Indonesia.
Corresponding Author E-mail: wahidwhb@yahoo.com
DOI : http://dx.doi.org/10.13005/ojc/340652
Article Received on : 18-09-2018
Article Accepted on : 22-10-2018
Article Published : 02 Nov 2018
Silver nanoparticles have been synthesized by reduction method using extract of Muntingia calabura L. leaf a bioreductor. The process of silver nanoparticles formation was monitored by UV-Vis method. The results showed that the absorbance values increased according to the increase of reaction time. Maximum absorption of silver nanoparticle was obtained at a wavelength of 41-421 nm. The size of silver nanoparticles was determined using a PSA (Particle Size Analyzer) with a particle size distribution of 97.04 nm. The functional groups compound that contribute in the synthesis was analyzed using Fourier Transform Infrared Spectroscopy (FTIR). Morphology of the silver nanoparticles was observed by an Scanning Electron Microscope instrument and the structure characterization of the compounds were analyzed using X-Ray Diffraction. The glucose nanosensor based on silver nanoparticles have the measurement range of 1 mM - 4 mM with the regretion (R2) is 0,9516, the detection limit of sensor is 3,2595 mM, the sensitivity of sensor is 2,0794 A. mM-1. mM-2.
KEYWORDS:Bioreductor; Extract; Muntingia Calabura L.; Nanosensor; Silver Nanoparticles
Download this article as:| Copy the following to cite this article: Wahab A. W, Karim A, Nafie N. L, Nurafni N Sutapa I. W. Synthesis of Silver Nanoparticles Using Muntingia Calabura L. Leaf Extract As Bioreductor and Applied As Glucose Nanosensor. Orient J Chem 2018;34(6). |
| Copy the following to cite this URL: Wahab A. W, Karim A, Nafie N. L, Nurafni N Sutapa I. W. Synthesis of Silver Nanoparticles Using Muntingia Calabura L. Leaf Extract As Bioreductor and Applied As Glucose Nanosensor. Orient J Chem 2018;34(6). Available from: http://www.orientjchem.org/?p=51802 |
Introduction
Diabetes mellitus is a chronic disease characterized by blood glucose levels above the normal limits caused by glucose homeostasis regulation not running perfectly. Diabetes mellitus (DM) will be increased in the future. The increase of the people with DM due to an increase in the social status of the community that changed the lifestyle.1 In addition, the increasing number of people with DM is also caused by a lack of information obtained by the people about the disease. New diabetics know the pain suffered when they get experienced complications disease because most of the diabetes continues without complaints for several years.2–4
The increasing prevalence of DM have a negative impact there is the quality of human resources) will be decreased because the disease requires a long time for the healing process. One of the efforts to reduce the risk of advanced complications is keeping blood sugar levels close to normal. It condition make patients must continue to monitor their blood sugar levels (glocose).5 Until now the price of the equipment used for the examination of blood sugar is very expensive, so many people cannot afford it. Therefore needed a sensor that is cheap, accurate and easy to use.7 Nowadays sensors have been widely used with various methods such as polarometry, IR spectroscopy, and enzymatics. However, the use of this method requires a long production time, the raw materials used are quite expensive and use hazardous chemicals. Based on these considerations many nanoparticles based sensors are now being developed.8,9
Metals or metal oxides nanoparticles have attracted attention because of their applications in many fields.10,11 One of the metal nanoparticles is silver nanoparticles. Silver nanoparticles are widely used because the nano size will increase the scanning speed of the analyte and stability in maintaining bioactivity from biomolecules.12,13 Various methods can be used to produce silver nanoparticles, one of them is bioreduction method.14 Utilization of the organic compounds from plants as bioreductors to synthesize of nanoparticles is known as biosynthesis. Various the plants that contain reducing compounds can be used as bioreductor materials. One of plants with these characteristics is Muntingia calabura L. This is due to the extract of Muntingia calabura L. plant contains many flavanoid as bioreductor compounds.15
Determination of the biosensor type can be designed from nanoparticles result of bioreduction process depends on the sensitivity of the bioreductor material to treat a disease or event. The Muntingia calabura L. extract is widely used as traditional medicine to treat diabetes, inhibits microbial growth, used as an antiseptic, and can reduce blood sugar levels.16,17 The ability of the Muntingia calabura L. extract to treat diabetes and reduce blood sugar levels indicates this material is sensitive to glucose levels. Therefore the silver nanoparticles produced can be apllied as materials to design glucose sensors.
Synthesis of the silver nanoparticles through a bioreduction process using Muntingia calabura L leaf extract and nanosensor glucose design based on literature studies to date has never been done. Based on this description in this study was synthesized silver nanoparticles using Muntingia calabura L. leaf extract as a bioreductor then applied as a glucose nanosensor.
Materials and Methods
Tools and Materials
The tools used are analytic balance sheet, Shimadzu UV-Vis spectrophotometer (UV-2600), Scanning Electron Microscopy (SEM), Particel Size Analyzer (PSA)-DLS VASCO, magnetic stirer (VWR Scientific), X-ray Difraction (XRD)-Shimadzu 7000, Fourier Transform Infrared (FTIR)-Shimadzu 820 IPC, Potentiostat (ED410), centrifudge, freeze dryer, hot plate, spray bottle, shaker, platinum wire, Ag/AgCl electrode.The materials used are glucose anhydride, Muntingia calabura L leaf, destillet water, Pt electrode, Ag/AgCl electrode universal pH paper and cling wrap.
Procedure
Synthesis of Silver Nanoparticles
Synthesis of silver nanoparticles was carried out by mixing AgNO3 solution and Muntingia calabura L. leaf decoction as much as 2 mL of boiled water from Muntingia calabura L leaves mixed into 40 mL of AgNO3 solution. Then added 1% PAA solution as much as 10 mL then stirred for 2 hours to form solution with brownish yellow color. The formation of nanoparticles was carried out using UV-Vis from day 1 to day 5. The nanoparticle products were then characterized using PSA, FTIR, XRD and SEM.
Preparation and Deposition Electrode of Nanoparticles
Platinum wire was cutted for 2.5 cm. Platinum electrodes are washed using distilled water and dried. One surface of the electrode is cleaned with sandpaper. Then the electrode is called an electrode without modification. The second working electrode is made by modifying the platinum electrode with silver nanoparticles. Deposition of nanoparticles is carried out layer by layer technique. Electrode was dipped in a 1% polyacrylic acid solution for 30 minutes then rinsed with water and dipped into a suspension of silver nanoparticles for 15 minutes and rinsed using water again. This cycle is repeated 3 times. This electrode is called a modified electrode.
Measurement of Standard Glucose Solution
Measurement of standard glucose solution was carried out by the voltammetry method. The assembly with electrodes consisted of unmodified platinum electrodes and electrodes with modification as working electrodes, platinum wire as auxiliary electrodes and Ag/AgCl electrodes (saturated electrodes) as comparable electrodes. Electrochemical measurements were carried out on 0.1 M NaOH. The nanosensors used were dipped in glucose solution then measured with cyclic voltammetry at a potential of -1 to +1 V. Then selectivity, limit of detection and sensitivity of the sensor were calculated.
Results and Discussion
Preparation of synthesis of silver nanoparticles
Silver nanoparticles were synthesized using a chemical reduction method using 1 mM AgNO3 and Muntingia calabura L. leaf extract as a bioreductor. Before being used to synthesize silver nanoparticles extract the results of the stew were brown while AgNO3 solution and 1% PAA solution were clear (Figure 1).
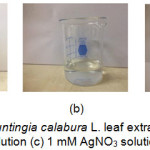 |
Figure 1: (a) Muntingia calabura L. leaf extract (b) 1 % PAA solution (c) 1 mM AgNO3 solution. |
Characterization using UV-Vis
UV-Vis spectrophotometer is used to determine the formation process of nanoparticles by observing the absorbance and maximum wavelength formed. Silver nanoparticles have a maximum wavelength range of 400-500 nm with peak plasmon around 450 nm.14,18
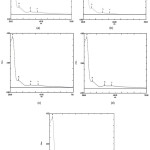 |
Figure 2: UV-Vis silver nanoparticles spectrum (a) – (e) for 1-5 days. |
The UV-Vis absorption spectra produced from the synthesis process of silver nanoparticles using Muntingia calabura L leaf extract from day 1 to day 5 can be seen in Figure 1. The results of the analysis on the first day showed the peak at 411 nm became the basis that the nanoparticles had successfully synthesized. UV-Vis spectrum measurement is also used to determine the stability of silver nanoparticles produced by time function. When the absorption peak is shifting to larger wavelength was suspected silver nanoparticles have undergone agglomeration.15,19,20
In Table 1 shows that the wavelength of silver nanoparticles did not experience a significant change until day 5, this shows that the silver nanoparticles produced tend to be stable. The amount of absorbance is related to the number of nanoparticles formed, namely the number of silver nanoparticles formed increases with time.
Characterization using PSA
To determine the size of the diameter and distribution of silver nanoparticles in the sample was carried out using Particle Size Analyzer (PSA) (PSA). It is a tool used to determine the particle size where the particles are dispersed into a liquid medium so that the particles do not form lumps. Characterization results using PSA showed that the average diameter size of silver nanoparticles which had been successfully synthesized was 97.04 nm (Figure 3). The resulting nanoscale size proved that Muntingia calabura L leaf extract has the potential as a reducing agent in silver nanoparticles synthesis.
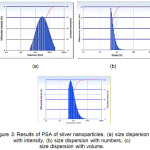 |
Figure 3: Results of PSA of silver nanoparticles, (a) size dispersion with intensity, (b) size dispersion with numbers, (c) size dispersion with volume. |
Tabel 1: The results of UV-Vis absorption analysis of silver nanoparticles.
| Times (days) | Wavelenght (nm) | Absorbance |
| 1 | 411 | 0.103 |
| 2 | 417 | 0.174 |
| 3 | 421 | 0.205 |
| 4 | 421.5 | 0.224 |
| 5 | 420 | 0.252 |
Characterization using X-Ray Diffraction (XRD)
Characterization of silver nanoparticles using XRD was carried out to proof that the synthesized nanoparticles were pure silver nanoparticles.
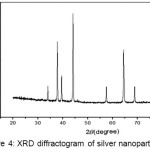 |
Figure 4: XRD Diffractogram of Silver Nanoparticles. |
Figure 4 shows of sharp peak of the XRD diffraction pattern that shows that silver nanoparticles have been formed. This is supported by the 2 theta value of silver nanoparticles are 37.82, 44,694, 64.4313 and 77.5584 respectively similar to the standard silver diffractogram data which is 38.12, 44.29, and 77.55. From the calculation of the grain size by XRD shows that the size distribution of the silver naopartikel synthesized having an average size is 54.50 nm.
Characterization using SEM
SEM analysis was carried out to determine particle morphology. Image enlargement of silver nanoparticles was carried out on a scale of 5 μm, 10 μm, 20 μm, 50 μm and 200 μm with HV 20.0 Kv and Working Distance (WD) 8.15 mm (Figure 5). SEM results of silver nanoparticles at a 5 μm magnification scale appear morphology of silver nanoparticles having a smooth surface structure with a non-uniform granular shape. The morphology of the analyzed silver nanoparticles has a spherical shape and slightly elongated.
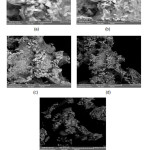 |
Figure 5: The results of the analysis of silver nanoparticles with SEM on (a) 5 μm scale, (b) 10 μm scale, (c) 20 μm scale, (d) 50 μm scale, and (e) 200 μm scale. |
Characterization using FTIR
Characterization using FTIR have purpose to determine the functional groups that act as bioreductors to reduce Ag+ ions into Ag0. FTIR spectrum of Muntingia calabura L. leaf extract and silver nanoparticles is shown in Figure 6. From the FTIR spectrum it can be seen that there are different functional groups. The IR bands (Figure 6a) at 3412 and 1705 cm-1 are characteristics of the O-H and C=O stretch modes derived from groups of compounds contained in flavonoids, tannins, terpenoids, saponins and polyphenols.
The IR band at 2358 cm-1 was derived from C-H deformation vibration contained in the acetal group. The other IR bands at 2929 cm-1 indicate the presence of CH2 which experiences stretching vibration. Besides that the presence of IR at 1618 cm-1 and 1504 cm-1 showed the presence of amide groups and streching vibrations C=N contained in Muntingia calabura L. leaf extract. The very sharp bands at 1045 cm-1 were produced by aliphatic C-N vibrations from protein compounds contained in Muntingia calabura L. leaf extract.
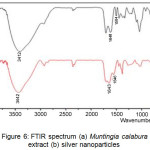 |
Figure 6: FTIR spectrum (a) Muntingia calabura L leaf extract (b) silver nanoparticles. |
Figure 6 (b) shows the synthesized silver nanoparticle FTIR spectrum. There is a shift in the spectrum wavelength from Muntingia calabura L leaf extract before and after reducing process. The wave number shift occurs in the –OH group from 3412 cm-1 to 3442 cm-1, this indicates that there is an interaction between the –OH group and Ag due to the reduction oxidation process. This is also evidenced by the shift of wave numbers in the amide group from 1618 and 1504 to 1643 and 1546 cm-1. The functional group of tannin compounds which play an active role in reducing Ag+ becomes Ag0 with an estimated bioreduction reaction mechanism as in Figure 7.
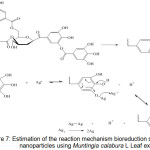 |
Figure 7: Estimation of the reaction mechanism bioreduction silver nanoparticles using Muntingia calabura L Leaf extract. |
Application of The Nanosensor
The application of silver nanoparticles as a nanosensor to measure glucose levels is performed using cyclic voltammetry techniques. The observation was done by comparing the voltamogram of the working electrode. The working electrode used in cyclic voltammetry systems is a work electrode that not coated with silver nanoparticles and work electrodes coated with silver nanoparticles.
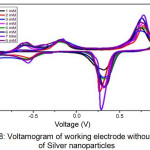 |
Figure 8: Voltamogram of working electrode without coating of silver nanoparticles. |
The results of the observation showed that the voltammogram oxidation peaks of the working electrodes were not coated with silver nanoparticles were not clearly visible and tended to accumulate (Figure 8). The voltammogram results indicate an irregularity in the current pattern measured at various glucose concentrations which shows that the working electrode not coated with silver nanoparticles is less sensitive to glucose,21 so that the platinum electrode cannot be used for glucose analysis. The second working electrode was made by modifying the platinum electrode with the addition of a layer of silver nanoparticles on the outer surface of the electrode.
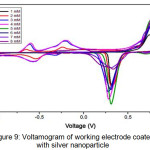 |
Figure 9: Voltamogram of working electrode coated with silver nanoparticle. |
The voltammogram results on working electrodes coated with silver nanoparticles (Figure 9) show that the current increasing according to the glucose concentration from 1-4 mM.
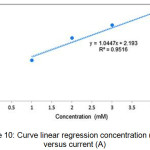 |
Figure 10: Curve linear regression concentration (mM) versus current (A). |
In the measurement range 1-4 mM a linear regression equation y = 1.0447x + 2.193 with R2=0.9516 shows that the working electrode coated with silver nanoparticles has a good ability to measure glucose levels.8,9,21 Measurements of detection and sensitivity limits were also carried out to determine the capabilities and performance of silver nanoparticles based sensors.
Detection Limit of Nanosensor
The detection limit for working electrodes coated with silver nanoparticles (Figure 11) is determined by making tangents to the linear and non-linear linear functions. The cut-off points of both lines are extrapolated to the x-axis so that the concentration of the detection limit is obtained.8,9 The results of extrapolation between linear linear curves and non-linear linear curves obtained a detection limit at a concentration of 3.2595 mM.
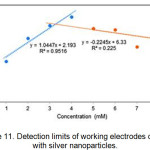 |
Figure 11: Detection limits of working electrodes coated with silver nanoparticles. |
Sensitivity of Nanosensor
Sensitivity test is conducted to determine the sensitivity of a sensor to analytes. Based on the equation line y = 1.0447x + 2.193. The sensitivity test is determined by dividing the slope from the linearity curve with the surface area of the working electrode used. The results of the sensor sensitivity calculation can be based on silver nanoparticles having a sensitivity of 2,0794 A. mM-1. mm2.
Conclusion
Based on the SEM results showed solid nanoparticles with a smooth surface, while the average size of the PSA results was 97.04 nm, so it can be concluded that Muntingia calabura L leaf extract can be used as a biosynthetic agent of silver nanoparticles. Sensors based on silver nanoparticles were used in measuring glucose levels, the sensor measurement range was in the range of 1-4 mM with Regression (R2) 0.9516, sensor detection limit at a concentration of 3.2595 mM with sensor sensitivity 2.0794 A.mM-1. mm-2.
Acknowledgments
Authors are thankful to Ministry of Research, Technology and Higher Education of Indonesia, for the Professorsip Grand Program at Hasanuddin University on 2018 to support this research (Contract Number: 3083/UN4.21/PL.00.00/2018).
References
- Levesque C. Nursing Clinics of North America, 2017, 52(4), 679-692.
CrossRef - Prakash, O.; Krishan, B.; Jacob, G. Orient. J. Chem., 2013, 29(2), 823-828.
CrossRef - Lehrke, M.; Marx, N. The American Journal of Medicine, 2017, 130(6, Supplement): S40-S50.
CrossRef - Meo, S.A.; Ansari M.J.; Sattar, K.; Chaudhary, H.U.; Hajjar, W.; Alasiri, S. Saudi Journal of Biological Sciences, 2017, 24(5), 1030-1033.
CrossRef - Viswanath, B.; Choi, C.S.; Lee, K.; Kim, S. TrAC Trends in Analytical Chemistry, 2017;89:60-67.
CrossRef - Bruen, D.; Delaney, C.; Florea, L.; Diamond, D. Sensors (Basel), 2017, 17(8), 1-21.
CrossRef - Karim, A.; Wahab, A.W.; Raya, I.; Natsir, H.; Arif, A.R. Journal of Physics: Conference Series, 2018, 979(1), 012014.
- Bijang, C.; Wahab, A. W.; Ahmad, A.; Taba, P. J New Materials for Electrochemical Systems, 2015, 18(1), 005-008.
- Sutapa, I.W.; Wahab, A. W.; Taba, P.; Nafie, N. L. Journal of Physics: Conference Series, 2018, 979(1), 012021.
CrossRef - Sutapa, I.W.; Wahab, A.W.; Taba, P.; Nafie, N.L. Orient. J. Chem., 2018, 34(2), 1016-1025.
CrossRef - Cepriá, G.; Pardo, J.; Lopez, A.; Peña, E.; Castillo, J.R. Sensors and Actuators B: Chemical, 2016, 230, 25-30.
CrossRef - Kumar, N.; Goyal, R.N. Sensors and Actuators B: Chemical, 2018, 268, 383-391.
CrossRef - Raj, S.; Chand Mali, S.; Trivedi, R. G. Biochemical and Biophysical Research Communications, 2018, 503(4), 2814-2819.
CrossRef - Wahab, A.W.; Karim, A.; Asmawati, Sutapa, I.W. Orient. J. Chem., 2018, 34(1), 401-409.
- Balan, T.; Sani, M.H.M.; Mumtaz, Ahmad, S.H.; Suppaiah, V.; Mohtarrudin, N.; Zakaria, Z.A.; J Ethnopharmacol, 2015, 164, 1-15.
CrossRef - Setyowati, W.A.E.; Cahyanto, M.A.S. Jurnal Kimia Dan Pendidikan Kimia (JKPK), 2016, 1(2), 41-47.
- Zhang, X.F.; Liu, Z.G.; Shen, W.; Gurunathan, S. Int J Mol Sci., 2016, 17(9), 1-24.
- Shen, X.S.; Wang, G.Z.; Hong, X.; Zhu, W. Phys Chem Chem Phys., 2009, 11(34), 7450-7454.
CrossRef - Li, J.; Lin, Y.; Zhao, B. Journal of Nanoparticle Research., 2002, 4(4), 345-349.
CrossRef - Wang, H.C.; Lee, A.R. Journal of Food and Drug Analysis, 2015, 23(2),191-200.
CrossRef

This work is licensed under a Creative Commons Attribution 4.0 International License.
![]()
A New Edition of Web of Science
Journal Impact Factor
2022: 0.5
Five Year: 0.8
Journal is Indexed in

Cabells Whitelist
![]()


