Synthesis and Characterization Studies of Cobalt(II), Nickel(II), Copper(II) and Zinc(II) Complexes of Carboxymethyl-N-Methyl-N-Phenyl Dithiocarbamate
 and G. Rathika Nath
Department of Chemistry, KSM DB College, Sathamcotttah, Kollam-690521, Kerala, India.
Corresponding Author E-mail: rakhignath@yahoo.com
DOI : http://dx.doi.org/10.13005/ojc/340649
Download this article as:
![]()
Complexes of carboxymethyl-N-methyl-N-phenyl dithiocarbamate (DTC) with cobalt(II), nickel((II), copper(II) and zinc(II) complexes were synthesized in 1:2 molar ratio with general formula [M(DTC)2],{M=Co(II)/Ni(II)/Cu(II)/Zn(II)} and characterized by elemental analysis, molar conductance, infrared and electronic spectra. The ligand structure was confirmed by 1H and 13C nuclear magnetic resonance spectrum. The measured molar conductance values indicate the non-electrolytic nature of the metal complexes. The elemental analysis, infrared, electronic spectra and magnetic moment suggest that the coordination of DTC occurred through sulphur and oxygen atom as a bidentate. The cobalt(II) and zinc(II) complexes were found to coordinate in a tetrahedral geometry and complexes and nickel(II) and copper(II) complexes coordinate in a square planar geometry. Thermal analysis was carried out to ascertain the thermal stability of the metal complexes. By using powder XRD measurements, the lattice parameters, space group and grain size were determined. The scanning electron microscope images reveal the surface morphology of the metal complexes.
KEYWORDS:Cobalt; Copper; Dithiocarbamate; Metal Complexes; Nickel; Zinc
Introduction
Sulphur-bonding ligands are important from the biological point of view and have attracted inorganic chemists in the past years.1,2 Dithiocarbamates are one of the most important classes of sulphur containing organic ligands with unpredictable coordination behaviour, self-assembly with transition element and their applications in several areas of chemical and biological fields.3,4 Dithiocarbamate act as monodentate, bidentate or chelating ligand, in which the different binding property determine the structural organization of coordination complex.5,6 The dithiocarbamate which contain additional donor groups such as oxygen and nitrogen atoms were found to show dramatic changes in their biological properties.7,8 Dithiocarbamate complexes of different transition metal ions were reported to act as anticancer,9,10 catalytic,11 and antimicrobial activities.12,13 Dithiocarbamate complex are widely used in electro analytical reagents, catalysts and potential brain perfusion imaging agents.14-16 Most dithiocarbamate complexes are used as nano precursor for the synthesis of nanoparticles.17 The present work is related to the synthesis and characterization studies of carboxymethyl-N-methyl-N-phenyl dithiocarbamate complexes of cobalt(II), nickel(II), copper(II) and zinc(II).
Materials and Methods
Analar grade solvents and chemicals were used for this study. Transition metal(II) salts (cobalt/ nickel/ copper and zinc chlorides), carbon disulfide, N-methyl aniline, sodium hydroxide, sodium choloroacetate were purchased from Sigma Aldrich and Merck chemicals. Solvents used for physico-chemical measurements were purified by standard methods.
Microanalysis(C, H, N, S) was done using ElementarVario EL III CHN analyzer. The magnetic susceptibility measurements were carried out using Gouy`s method using Hg[Co(SCN)4]used as calibrant. Diamagnetic corrections were made by using Pascal constants. Molar conductance measurements were done using 10-3 M solutions of the complexes in DMSO solvent at room temperature using digital conductivitymeter. Infrared spectra of ligand and its complexes were obtained using potasium bromide pellets in the range of 4000-400 cm-1 on a Perkin Elmer FT-IR spectrophotometer. The electronic spectra of the ligand and its complexes were recorded using Genesys 10S-UV-VIS spectrophotometer in DMSO solvent. The NMR spectrum was taken in BRUKER Avance –III 300 MHz NMR spectrometer, using DMSO-d6 as solvent. Powder XRD measurements were conducted using Bruker D.8 Advance X-ray diffractometer. The thermogravimetric analysis was carried out in the range of room temperature to 8000C in a Perkin Elmer Diamond TG/DTA at a heating rate of 100C. Scanning electron microscope was recorded in JEOL model JSM-6390 LV SEM instrument analyzer.
Preparation of carboxymethyl-N-methyl-N-phenyl dithiocarbamate(DTC)
A mixture of carbon disulfide (12 mL, 0.20 mol) and N-methylaniline (21.6 mL, 0.20 mol) was treated with sodium hydroxide (8.2 g, 0.20 mol) dissolved in 250 mL water. The organic layer disappears after stirring the solution for 4 h at room temperature. At this point the resulting straw coloured solution was treated with sodium choloroacetate (23.2 g, 0.20 mol) and allowed to stand for 24 h. The resulting solution was acidified with conc. HCl and the solid which was separated, collected and dried. The purity of the ligand was checked by thin layer chromatographic technique.
Preparation of Metal Complexes
A hot methanolic solution (15 ml) of the ligand (2 mmol) was added dropwise to a hot methanolic solution (15 ml) of cobalt/ copper/ nickel/ zinc chlorides (1 mmol) and refluxed for 1 h on a water bath at 700C. The pH of the solution was adjusted to ~7- 8 by adding sodium hydroxide solution and continued the refluxing process for 4 h. The solid product separated was filtered, washed successively with methanol, filtered and dried in vacuum desiccator. The purity was checked by thin layer chromatographic technique.
Results and Discussion
The synthesized ligand and its metal(II) complexes are non-hygroscopic solids, soluble in DMSO. Analytical data of the ligand and its complexes are in good agreement with their formulation, which is given in Table1. All the complexes possess 1:2 metal ligand stoichiometry and formulated as [M(DTC)2], where M= Co(II), Ni(II), Cu(II) or Zn(II), DTC = Dithiocarbamate. The molar conductance values of the complexes in 0.001M DMSO solution lies in the range of13-17 Ω -1 cm2 mol-1 at room temperature. These values indicate that the complexes were non-electrolytes in nature.18
Table 1: Physical and analytical data of ligand and its complexes.
| Ligand/Complexes | Yield (%) | Colour | Melting point (ºC) |
Empirical Formula | Mol.Weight |
Elemental Analysis Cal. (Found) |
|||
| C | H | N | S | ||||||
| DTC | 81 | Off white | 122 | C10H11NO2S2 | 241.00 | 49.77(49.71) | 4.59(4.56) | 5.80(5.74) | 26,57(26.49) |
| [Co(DTC)2] | 72 | Pale Green | 156 | C16H22CoN2O4S4 | 539.58 | 44.52(44.48) | 3.74(3.71) | 5.19(5.12) | 23.77(23.64) |
| [Ni(DTC)2] | 81 | Green | 194 | C20H20NiN2O4S4 | 539.34 | 44.54(44.49) | 3.74(3.69) | 5.19(5.12) | 23.78(23.73) |
| [Cu(DTC)2] | 74 | Green | 178 | C20H20CuN2O4S4 | 544.19 | 44.14(44.04) | 3.70(3.64) | 5.15(5.11) | 23.57(23.49) |
| [Zn(DTC)2] | 79 | White | 168 | C20H20ZnN2O4S4 | 546.02 | 43.99(43.74) | 3.69(3.48) | 5.13(5.08) | 23.49(23.43) |
1H-NMR Spectrum
Proton NMR spectrum of DTC was measured in DMSO-d6 solvent and it’s shown in the Fig 1. The multiplet peak obtained at 7.4-8 ppm corresponds to the peak of aromatic hydrogen atom of phenylgroup19. Two singlet peaks were seen at 3.6 ppm and 3.96 ppm is due to the methyl group attached to nitrogen and methylene group attached to the carboxy group20. A singlet sharp peak at 12.63 ppm is due to the hydrogen atom of carboxylic acid.
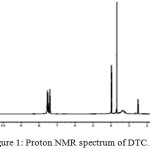 |
Figure 1: Proton NMR spectrum of DTC. |
13C-NMR Spectrum
The carbon skeleton of the dithiocarbamate ligand was identified using 13C-NMR spectrum. Carbon attached to the C=S group resonates at downfield shift at 196 ppm21. The peak at 169 ppm is due to the carbon atom of carboxylic acid. The carbon atom of the phenyl ring attached to the aniline nitrogen also resonates at downward shift at 146 ppm. The downward shift occurs as a result of the deshielding from the neighbouring nitrogen atom22.The carbon atom of methyl group attached to the nitrogen resonates at 41.89 ppm and methylene group attached to the carboxylate group resonate at 46.01 ppm. The other carbon atoms of the benzene ring were assigned to signal at 129.5 ppm (ortho), 127.08 ppm(meta), 126.92(para) ppm respectively.23
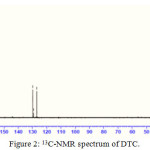 |
Figure 2: 13C-NMR spectrum of DTC. |
Infrared Spectra
The IR spectra of the ligand and its complexes were used to identify the coordination behaviour of ligand towards the central metal atom. A broad frequency band in between 2910-2920 cm-1 in the free ligand indicates the presence of OH group. The characteristic absorption peak of carboxylic acid of the dithiocarbamate at 1664 cm-1 was found to present, but the absence of peak in the range of 1660-1600 cm-1 of complex indicate that carboxylate ion is coordinated towards the central metal atom. IR spectrum also exhibits characteristic bands of carboxylate anion at 1591 cm-1 (asymmetric stretching) and at 1415 cm-1 (symmetric stretching) in copper complex, at 1589 cm-1 (asymmetric stretching) and at 1412 cm-1 (symmetric stretching) in cobalt complex, at 1596 cm-1 (asymmetric stretching)and at 1395 cm-1 (symmetric stretching) in nickel complex and at 1584 cm-1 (asymmetric stretching)and at 1396 cm-1 (symmetric stretching) in zinc complex. The difference between the symmetric and asymmetric stretching peaks indicates the coordination of carboxylate ion towards the metal ions24. The strong band observed at 875 cm-1assigned for C=S stretching frequency in the spectrum of ligand, which is shifted towards to lower frequency indicates the coordination of the sulphur to the metal atom. The additional bands in the range of 420-435 cm-1 and 560-580 cm-1 indicate the presence of M-S and M-O bonds.25,26 The infrared spectrum of ligand and its complexes are shown in the Fig 3.
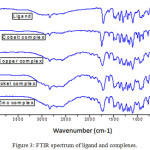 |
Figure 3: FTIR spectrum of ligand and complexes. |
Electronic Spectra and Magnetic Moment
The electronic absorption band of ligand and complexes were recorded in DMSO solvent at 25oC. Electronic spectral peak of the complexes around 300nm is attributed to intra ligand transition. The electronic spectrum of ligand exhibits two peaks at 276 nm and 324 nm, which may be assigned to be due to π-π* and n-π*transitions.27
The copper(II) complex possess the absorption bands at 281 nm and 329 nm is due to intra ligandπ-π* and n-π* transitions. For square planar complexes, three allowed transitions are usually found. But since four d orbitals are very close to each other, it was difficult to distinguish three bands and a broad band appears at 680-720 nm corresponding to the d-d transitions of the copper(II) complex. A band due to ligand to metal charge transfer occurs at 470-520 nm. The magnetic moment of copper(II) complex was found to be 1.72 BM, which is due to the presence of one unpaired electron. From the spectral and magnetic moment studies suggest a square planar environment of copper complex.28,29
The magnetic moment of cobalt(II) complex is 4.32 BM. An absorption band at 630 nm assigned to be ligand to metal charge transfer and the green colour of the complex are strong evidences to support a tetrahedral geometry for the cobalt complex.30,31
Nickel(II) complex possess the absorption bands at 282 nm, 331nm and 440-450 nm. The intensity and position of the bands and the diamagnetic character indicates that nickel(II) complex has square planar geometry around the central metal atom.32
The diamagnetic mononuclear zinc(II) complex had only intra ligand transition at 280 nm and 336 nm, with a mononuclear tetrahedral geometry around the central metal atom.33
From the above studies, the complexes could be formulated as [M(DTC)2]. On the basis of the previously discussed physico-chemical values and spectral data, the structure of the ligand and complexes could be assigned as shown in the Fig 4a and 4b.
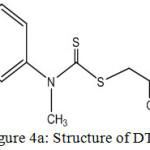 |
Figure 4a: Structure of DTC. |
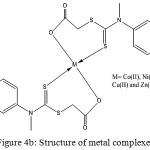 |
Figure 4b: Structure of metal complexes. |
Thermogravimetric Analysis
The thermal decomposition pattern and thermal stability of the metal complexes were analysed using thermogravimetric studies (Fig 5). The absence of weight loss upto 200ºC confirms the absence of water molecule in the solid form.34 The graph shows a three stage decomposition pattern. First stage decomposition may be due to the loss of phenyl group and the second stage decomposition above 230ºC may be due to the loss of methyl group. The subsequent decomposition was found completed at 700ºC, producing metal residue as the product.
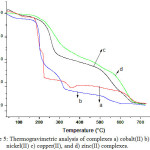 |
Figure 5: Thermogravimetric analysis of complexes a) cobalt(II) b) nickel(II) c) copper(II), and d) zinc(II) complexes. |
Powder XRD Analysis
The powder X-ray diffraction patterns were recorded in the range of 2θ = 5 to 800. Sharp crystalline peaks were observed in the metal complexes, indicating the crystalline behaviour as shown in the Fig 6. The average grain size of the complexes were calculated using Debye Scherer equation35,36 as dXRD= 0.9 /βcosθ. The grain size of the nickel(II) and zinc(II) complexes were 20.1 nm and 19.1nm respectively indicate that the metal complexes are in nano size. Powder XRD patterns clearly indicate that copper(II) and nickel(II) complexes have crystalline behaviour.37 The lattice parameter, space group, and crystal system of complexes were determined and the details are given in Table 2.
Table 2: PXRD data of the copper(II) and zinc(II) complexes.
| Complex | Lattice constant parameters | Inter Axial Angle (Å) | Space group | Crystal System | ||
| a | b | C | ||||
| [Cu(DTC)2] | 9.21 | 14.49 | 19.98 | α=β=90,δ≠90 | c2/m | Monoclinic |
| [Zn(DTC)2] | 6.53 | 11.47 | 12.32 | α=β=90,δ≠90 | P21/c | Monoclinic |
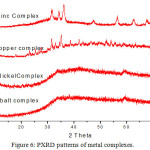 |
Figure 6: PXRD patterns of metal complexes. |
SEM Analysis
The surface morphology of metal complexes was analyzed using scanning electron microscope, and is shown in the Fig.6. PXRD results also suggest nanosize for copper(II) and zinc(II) complexes. SEM images with magnification value of 7,000X and optimum energy value of 20 kv were used for the analysis. SEM micrograph indicates cluster plate, cauli-flower, rose petal and agglomerated cluster like morphological structures for the cobalt, copper, nickel and zinc complexes.38
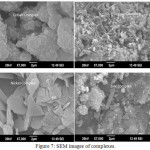 |
Figure 7: SEM images of complexes. |
Conclusion
We prepared cobalt, nickel, copper and zinc complexes of carboxymethyl N-methyl N- phenyl dithiocarbamate and characterized using elemental analysis, magnetic moment, molar conductance, IR and electronic spectrum. The results clearly demonstrates that the ligand coordinates towards the central metal ion in a bidentate mode, and the cobalt and nickel complexes have a tetrahedral geometry while copper and zinc complexes have square planar geometry. The molar conductance values indicate the nonelectrolytic nature of complexes. The thermogravimetric analysis indicates that the complexes were stable upto 2000C. The complexes were found to possess crystal size less than 20.1 nm, which increases the possibility of their use as nano precursors. XRD analysis shows Cobalt(II) and nickel(II) complex were found to be amorphous, copper(II) and zinc(II) complex were crystalline in nature. Surface morphology of the complexes were also analysed using SEM.
Acknowledgements
Authors are thankful to STIC, CUSAT, Kochi for the instrumental analysis of samples and SICC, University of Kerala, Thiruvananthapuram for PXRD analysis. One of the author (Lekshmi V Kumar) acknowledge the CSIR, New Delhi for the financial support through the grant no. 08/537(0004)/2014 EMR-1, dated 27/08/2014.
References
- Usama, El-A.; Magdy, M. Y.; Shar, A. S. J. Mol. Str., 2009, 936, 213-219.
- Marthakutty, J.; Suni, V.; Maliyeckal, Prathapachandra, K. R.; Munirathinam, N.; Archana, K.; Sarita, G. Bhat. Polyhedron, 2004, 23, 3069-3080.
- Imran, A.; Waseem, A.W.; Kishwar, S.; Ming-Fa, H. Polyhedron, 2013, 56, 134-143.
- Pooja, B.; Bharati, A.; Nath, P.; Bharty, M.K.; Butcher, R. J.; Singh, N. K. Polyhedron, 2015, 102, 375-385.
- Isabela, P. F.; Geraldo, M. L.; Eucler, B. P.; Carlos, B. P.; James, L. W.; Slonage, M. S. V. Wardell. Inorg. Chem. Acta, 2016, 441, 137-145.
- Damain, C.O.; Peter, A.; Ajibade. J. Chem. Crystall., 2011, 41, 980-985.
- Hamed, M. M. A.; Abdel-Hamid, M. I.; Mahmoud, M. R. Monatsh. Chem. , 1998, 129, 121-127.
- Venu, G. K.; Siva, J. P.; Ashok, G. R. P.; Rameshbabu, K.; Sreeramulu, J.J. Chem. Pharm. Res., 2013, 5(6),50-59.
- Boris, Cvek.; Vesna, M.; Jan, T.; Ping, D. Q. J. Med. Chem., 2018, 51(20), 6256-6258.
- Diane, B.; Alain, M.; Sylvie, C. M.; Denis, B.; Karine, P. Inorg. Chem., 2006, 45, 3393-3398.
- Ponnuchamy, P.; Kong, M. L.; Kuppanagounder, P. E. J. Coord. Chem., 2015, 68, 2167-2180.
- Nur, A. J.; Ibrahim, B.; Nazlina, I. Malaysian J. Chem., 2014, 18, 251-259.
- Musthak, A.; Mallikarjuna, R. R.; Rafi, M. M.; Jaffer, M. G.; Sreeramulu, J. Arch. Appl. Sci. Res., 012, 4(2), 858-862.
- Kanchi, S.; Sulochana, M.; Babu, N. K.; Saraswati, K.; Nuttalapati, V, Naid. Food Anal. Method, 2011, 4, 453-464.
- Liansheng, C.; Xiangmin, M.; Yuhua, F.; Xin, L.; Caifeng, B. Inorg. Organomet. Polym., 2015, 5, 1490-1494.
- Jun, B. Z.; Tian, J. Y.; Zhong, F. W.; Yan, L.; Fang, W.; Mian, M. Xing.; Xue, B. W. J. Radioanal. Nucl. Chem., 2007, 274, 195-197.
- Nabipour, H. Int. J. Nano. Dim. 2011, 3, 225-232.
- Surya, P.; Preethy, S. T.; Mohanan, K. J. Serb. Chem. Soc., 2018, 83, 1-16.
- Sangamesh, A.P.; Vinod, H.N.; Ajaykumar, D.K.; Prema, S.Badami. J. Sulfur Chem., 2010, 31, 109-121.
- Abdullahi, O.S.; Gareth, M. Watkins.; Bernadus, V. B. J. Serb. Chem. Soc., 2018, 83, 1-12.
- Renu, S.; Meena, N., Phosphorous Sulfur Silicon and Relat Elem, 2006, 181, 2863-2875.
- Priya, P. N.; Sandeep, P. N.; Vidyanand, K. R., Polyhedron, 2015, 100, 215-222.
- Jamuna, R. P,; Subbiah, T.; Samuele, C., Spectrochem. Acta A, 2015, 1164-1173.
- Maryam, R.;Saeed, D.; Shadi, F.; Camelia, G.; Ali, M., Polyhedron, 2016, 106, 10-17.
- Bakir, J.; Ahmed, A. E. A.; Spectrochem. Acta A, 2014, 130, 546-552.
- Sundaramurthy, S. L.; Kannappan, G.; Gayathri, M.; Ganesh, S. J. Chem. Sci., 2016, 128, 1095-1102.
- Madhumita, H.; Tanushree, D.; Akhil, P.; Subrata, K. D.; Animesh, P. Bioinorg. Chem. Appl., 2014, 0-13.
- Rawat, S. P.; Choudary, M. Int. J. Inorg. Chem., 2014.
- Alka, C. R. S.; Meena, N. M. M. J. Enzy. Inhib. Med. Chem., 2011, 26(3), 394-403.
- Usama, E. A.; Magdy, M. Y.; Shar, A-S .J. Mol. Str., 2009, 936, 213-219.
- Ashwaq, S. H.; Hussain, A. Al-K.; Ahmed, T. N. Inter. J. Chem. Sci., 2016, 14(2), 693-703.
- Ikechukwu, P.E.; Peter, A. A. J. Pharm. Sci. Res., 2017, 9(5), 593-600.
- Ramasamy, R. K.; Mohamed, K.; Mohamed, S.; Rengan, R. Royal Soc. Chem., 2012, 1-3.
- Sekhon, B. S.; Leena, G. Inter. J. Chem. Tech. Res., 2010, 2, 1102-1105.
- Joseyphus, R. S.; Dhanaraj C. J.; Nair, M. S. Transition Met. Chem., 2006, 31(6), 699-702.
- Joseyphus, R. S.; Nair, M. S. J. Coord. Chem., 2009, 62(2), 319-327.
- Gavhane,V. S.; Rajbhoj,. S. G. S. T. Res. J. Chem. Sci., 2015, l5(12), 33-37.
- Sonia, M. J.; Dhanaraj, C. J; Joseph, J.; Joseyphus, R. S. Orient. J. Chem., 2017, 33(3), 1477-1482.
Accepted on: 07-12-2018


![]()


