Spectrophotometric Method for Determination of Nitrite and Nitrate Levels in Broccoli and Cauliflower with Different Fertilization Treatment
 and Effendy De Lux Putra2
1Department of Pharmacy, Academy of Pharmacy Yayasan Tenaga Pembangunan Arjuna, Pintubosi, Laguboti, Toba Samosir, Sumatera Utara, 22381, Indonesia.
2Department of Pharmaceutical Chemistry, Faculty of Pharmacy, University of Sumatera Utara, Padang Bulan, Medan Baru, Medan, Sumatera Utara, 20155, Indonesia.
Corresponding Author E-mail: nerdy190690@gmail.com
DOI : http://dx.doi.org/10.13005/ojc/340639
Download this article as:
![]()
Both broccoli and cauliflower are plants that are widely cultivated and consumed. The vegetable also contains Nitrite and Nitrite, which have a negative impact on human health because of the carcinogenic effect. Levels of Nitrite and Nitrate in vegetable are dependent on several factors, one of them is fertilization. The objective of this research is to determine the levels of Nitrite and Nitrate in broccoli and cauliflower without fertilization and with fertilization (natural and chemical). Samples were planted broccoli and cauliflower with different fertilization treatment. Determination of Nitrite and Nitrate levels were done by the colorimetric method (visible spectrophotometric) by using N-(1-Naphthyl) Ethylenediamine Dihydrochloride and Sulfanilic Acid as the dyes and measured at the maximum absorbance wavelength (540 nm) and on the operating time between 11 minutes to 18 minutes. Nitrite and Nitrate levels in various fertilization treatments of broccoli and cauliflower were different significantly. Nitrite and Nitrate levels in broccoli and cauliflower without fertilization are lower than Nitrite and Nitrate levels in broccoli and cauliflower with fertilization. Nitrite and Nitrate levels in broccoli and cauliflower with natural fertilizer fertilization are lower than Nitrite and Nitrate levels in broccoli and cauliflower with chemical fertilizer fertilization.
KEYWORDS:Broccoli; Cauliflower; Fertilization; Nitrate; Nitrite; Spectrophotometric
Introduction
Nitrite and Nitrate are natural components found in nature that are normally consumed by humans through vegetables. Both Nitrite and Nitrate were highly undesirable components are present in the diet because they have a carcinogenic effect.1 Levels of Nitrite and Nitrate in vegetables were kept as low as possible, because of the potential for the formation of nitrosamine carcinogens from Nitrite. Acceptable Daily Intake by the Food and Agriculture Organization & World Health Organization for Nitrite was 0.07 mg of Nitrite per kg body weight per day and for Nitrate was 3.7 mg of Nitrate per kg body weight per day.2
Research on the determination of Nitrite and Nitrate levels in some vegetables such as spinach, lettuce, celery, and cabbage that have been grown conventionally and organically has been done by the previous researcher. Based on the results of the previous research, there was no difference in the levels of Nitrite between vegetables grown conventionally and organically. However, there was a significant difference in the levels of Nitrate between vegetables grown conventionally and organically due to the use of nitrogen fertilizers.3 Levels of Nitrite and Nitrate in the plant is influenced by fertilization, air, soil, harvest, process, and storage.4
Broccoli and cauliflower are not native plants in Indonesia, but are widely cultivated and widely consumed by people in Indonesia. Broccoli and cauliflower are harvested at 7 weeks to 8 weeks after planted.5 Several analytical methods have been discovered for analysis of Nitrite and Nitrate, such as high performance liquid chromatography6 and spectrophotometric.7 But according to the Association of Official Analytical Chemists, the methods used for the determination of Nitrite and Nitrate were by spectrophotometric method.8 Research on the effects of fertilization treatment on Nitrite and Nitrate levels in broccoli and cauliflower has never been done. The objective of this research was to determine the levels of Nitrite and Nitrate in broccoli and cauliflower without fertilization and with fertilization (natural and chemical).
Experimental
This research is an experimental research that aims to determine the Nitrite and Nitrate levels in broccoli and cauliflower without fertilization and with fertilization (natural fertilizer and chemical fertilizer). The sample (broccoli and cauliflower) grown in Gundaling, Berastagi, Karo, North Sumatera, 22152, Indonesia.
Tools and Materials
Tools used in this research were ultraviolet visible spectrophotometer (Shimadzu), analytical balance (Boeco), waterbath (Wisebath), filter paper (Whatman), tissue (Tessa), rubber bulb (D&N), thermometer (Lutron), measuring glass (Iwaki), volumetric flask (Iwaki), funnel (Iwaki), stirring rod (Iwaki), volumetric pipette (Iwaki), weighing bottle (Iwaki), spatula (Iwaki), hand gloves (Sensi), masker (Sensi), stopwatch (Casio), mortar and pestle.
Materials used in this research were Acetic Acid (Merck), Hydrochloric Acid (Merck), N-(1-Naphthyl) Ethylenediamine Dihydrochloride (Merck), Sulfanilic Acid (Merck), Sodium Nitrite (Merck), Sodium Nitrate (Merck), Zink (Merck), and Distilled Water (Brataco).
Broccoli and Cauliflower Sample Treatment
Seeds were soaked in warm water (50°C) for 24 hours, drained, and spread on the humus soil as the medium. Plants were transferred to polybags after 3 weeks to 4 weeks of age with three treatment types:
-without fertilization : humus soil and sand 1:1 as the plantation medium
-with fertilization (natural fertilizer) : humus soil and sand 1:1 as the plantation medium; added 300 g of compost fertilizer per polybag at 3 days before planting
-with fertilization (chemical fertilizer) : humus soil and sand 1:1 as the plantation medium; added 300 mg of urea fertilizer per polybag at 3 days before planting.
Watering twice a day in the morning and afternoon using clean water free of harmful chemicals to keep the soil moisture. Fertilization was done every two weeks. Harvesting can be done after broccoli and cauliflower aged 8 weeks.
Preparation of Acetic Acid Solution 15%
75.0 mL of glacial Acetic Acid was transferred into 500.0 mL volumetric flask, diluted with distilled water to the marked line, and shaken until homogeneously mixed.
Preparation of Hydrochloric Acid Solution 1N
41.7 mL of concentrated Hydrochloric Acid was transferred into 500.0 mL volumetric flask, diluted with the distilled water to the marked line, and shaken until homogeneously mixed.
Preparation of N-(1-Naphthyl) Ethylenediamine Dihydrochloride Solution
0.7 g of N-(1-Naphthyl) Ethylenediamine Dihydrochloride was transferred into 500.0 mL amber volumetric flask, added 300.0 mL of Acetic Acid solution, shaken until dissolved, diluted with the acetic acid solution to the marked line, and shaken until homogeneously mixed.
Preparation of Sulfanilic Acid Solution
1.7 g of Sulfanilic Acid was transferred into 500.0 mL amber volumetric flask, added 300.0 mL of acetic acid solution, shaken until dissolved, diluted with the acetic acid solution to the marked line, and shaken until homogeneously mixed.
Preparation of Nitrite and Nitrate Stock Solution
Sodium Nitrite and Sodium Nitrate was dried at 110ºC for one hour, cooled in a desiccator, weighed 15.0 mg of Sodium Nitrite (equal to 10.0 mg of Nitrite) and 13.8 mg Sodium Nitrate (equal to 10.0 mg of Nitrate) was transferred into separate 100.0 mL volumetric flask, added 60.0 mL of distilled water, shaken until dissolved, diluted with distilled water to the marked line, and shaken until homogeneously mixed (obtained stock solution with Nitrite concentration 1000.00 μg/mL and Nitrate concentration 1000.00 μg/mL). 1 mL of each stock solution was pipetted was transferred into separate 100.0 mL volumetric flask, diluted with distilled water to the marked line, and shaken until homogeneously mixed (obtained solution with the Nitrate concentration of 10.00 μg/mL and the Nitrate concentration of 10.00 μg/mL).
Determination of Maximum Absorbance Wavelength and Operating Time of Nitrite with Griess Reagent
5.0 mL of Nitrite solution with concentration 10.00 μg/mL was transferred into 100.0 mL of volumetric flask, added 2.5 mL of Sulfanilic Acid solution, shaken until homogeneous, left for 5 minutes, added 2.5 mL of N-(1-Naphthyl) Ethylenediamine Dihydrochloride solution, shaken until homogeneous, diluted with distilled water to the marked line, and shaken until homogeneously mixed (obtained solution with Nitrite concentration 0.50 μg/mL). Absorbance was measured at wavelength 400 nm to 800 nm. Obtained the absorbance curve and the maximum absorbance wavelength. Absorbance was measured at the maximum absorbance wavelength at every minute for 30 minutes. Obtained the operating time with the absorbance was found to be relatively stable.
Determination of Linearity, Limit of Detection, and Limit of Quantitation
Method used in determination of Nitrite and Nitrate in sample was modified from Narayana and Sunil, 2009 method; Cortesi et al., 2015 method; and Mohammadi and Ziarati, 2016 method, 0.0 mL, 1.0 mL, 2.0 mL, 3.0 mL, 4.0 mL, 5.0 mL, 6.0 mL, 7.0 mL, 8.0 mL, 9.0 mL, and 10.0 mL Nitrite solution with concentration 10.00 μg/mL was transferred into 100.0 mL of volumetric flask, added 2.5 mL of Sulfanilic Acid solution, shaken until homogeneous, left for 5 minutes, added 2.5 mL of N-(1-Naphthyl) Ethylenediamine Dihydrochloride solution, shaken until homogeneous, diluted with distilled water to the marked line, and shaken until homogeneously mixed (obtained solution with Nitrite concentration 0.10 μg/mL; 0.20 μg/mL, 0.30 μg/mL, 0.40 μg/mL; 0,50 μg/mL; 0.60 μg/mL; 0.70 μg/mL, 0.80 μg/mL, 0.90 μg/mL, and 1.00 μg/mL). Absorbance was measured at the maximum absorbance wavelength after allowing to reach operating time. The calibration curve was made by plotting absorbance (Y-Ordinate) versus concentration (X-Axis) of each solution. Calculated the regression equation, determination coefficient, correlation coefficient, limit of detection and limit of quantitation.9-11
Determination of Nitrite and Nitrate in Sample
Method used in determination of Nitrite and Nitrate in sample was modified from Narayana and Sunil, 2009 method; Cortesi et al., 2015 method; and Mohammadi and Ziarati, 2016 method, 25.0 g of grounded sample was transferred into 50.0 mL beaker glass, added 25.0 mL of hot (±80°C) distilled water, homogenized by stirring, heated and stirred on hotplate stirrer for 15 min, allowed to cool, transferred into 50.0 mL volumetric flask, added distilled water to the marked line, shaken until homogeneously mixed, and filtered. 5.0 mL of the first filtrate was discarded, the following filtrate was collected. The filtrate obtained was used for Nitrite and Nitrate determination. Each treatment was repeated 6 times.
Determination of Nitrite : 10 mL of filtrate was transferred into 100.0 mL of volumetric flask, added 2.5 mL of Sulfanilic Acid solution, shaken until homogeneous, left for 5 minutes, added 2.5 mL of N-(1-Naphthyl) Ethylenediamine Dihydrochloride solution, shaken until homogeneous, diluted with distilled water to the marked line, and shaken until homogeneously mixed (dilution factor 10.0 times). Absorbance was measured at the maximum absorbance wavelength after allowing to reach the operating time. Each treatment was repeated 6 times. Concentration (X) of Nitrite was calculated by substituted the absorbance (Y) obtained to the regression equation. Levels of Nitrite in the sample was calculated by multiplication with volume and dilution factor and division by weight.
Determination of Nitrate : 3.5 mL of filtrate was transferred into separate 100.0 mL volumetric flask, diluted with distilled water to the marked line, and shaken until homogeneously mixed (dilution factor 28.5 times). 10.0 mL of solution was transferred into 100 mL volumetric flask, added 0.1 g of Zink powder, added 1 mL of Hydrochloric Acid solution, allowed to stand for 10 min (to reduce Nitrate to Nitrite), added 2.5 mL of Sulfanilic Acid solution, shaken until homogeneous, left for 5 minutes, added 2.5 mL of N-(1-Naphthyl) Ethylenediamine Dihydrochloride solution, shaken until homogeneous, diluted with distilled water to the marked line, and shaken until homogeneously mixed (dilution factor 10.0 times). Absorbance was measured at the maximum absorbance wavelength after allowing to reach the operating time. Each treatment was repeated 6 times. The concentration of total Nitrite (Nitrite and converted Nitrate) was calculated using the regression equation. The concentration of converted Nitrate (Nitrate that has been converted to Nitrite) is obtained by subtracting the concentration of total Nitrite with a concentration of Nitrite. Levels of Nitrate in the sample was calculated by multiplication with the conversion factor, volume and dilution factor and division by weight.
Each sample (without fertilization, fertilization with natural fertilizer, and fertilization with chemical fertilizer) was analyzed by one way analysis of variance with least standard deviation to know the significance of the difference of Nitrite and Nitrate levels in each sample.9-11
Determination of Accuracy, Precision, and Range
Accuracy test with recovery percentage parameter was done by adding the standard solution to the sample, then analyzed by the same treatment on the sample with modification of previous research method by Fontenla et al., 2017. The addition of Nitrite solution and Nitrate solution was 50%, 100%, and 150% of Nitrite and Nitrate levels target in the sample. Each treatment was repeated 6 times. Precision test with relative standard deviation parameter is calculated based on the recovery percentage parameter obtained from accuracy test.12
Results and Discussion
Determination of Maximum Absorbance Wavelength and Operating Time of Nitrite with Griess Reagent
The reaction between Nitrite and Griess Reagent produces the violet color solution. The solution starts with a measurement of the absorbance curve for determination of maximum absorbance wavelength. The solution is followed by a measurement of absorbance with 1 minute interval time for determination of operating time. Figure 1 shown the Absorbance Curve of Nitrite and Griess Reagent. Figure 2 shown the Absorbance of Nitrite and Griess Reagent with 1 Minute Interval Time.
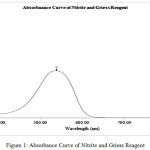 |
Figure 1: Absorbance Curve of Nitrite and Griess Reagent. |
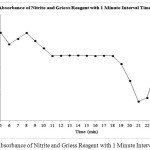 |
Figure 2: Absorbance of Nitrite and Griess Reagent with 1 Minute Interval Time. |
The Maximum absorbance wavelength of Nitrite with Griess Reagent obtained at 540 nm. Maximum absorbance wavelength obtained was similar with previous research results which stated that the maximum absorbance wavelength for Nitrite with Griess Reagent was 540 nm.13 Operating time of Nitrite with Griess Reagent obtained was between 11 minutes to 18 minutes. Operating time obtained was also similar to previous research which stated that the operating time for Nitrite with Griess Reagent was around 15 minutes (after 15 minutes incubation).14,15 Nitrite and Nitrate can be oxidized and reduced to produce the product of the pair. For good measurement results, the measurements were measured at a stable period.16
Determination of Linearity, Limit of Detection, and Limit of Quantitation
Determination of Nitrate and Nitrate in the samples requires a standard, so absorbance measurement of Nitrite with Griess Reagent is performed at the maximum absorbance wavelength and operating time. Solutions made in various concentration ranges (0.00 μg/mL to 1.00 μg/mL). Various absorbance obtained from various concentrations is followed by plotting of the calibration curve, calculated of the regression equation, the determination coefficient, and the correlation coefficient. Figure 3 shown the Calibration Curve of Nitrite and Griess Reagent.
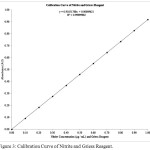 |
Figure 3: Calibration Curve of Nitrite and Griess Reagent. |
The calibration curve obtained from measurement results were good, and each point obtained from measurement results was laid on the line. The regression equation obtained was Y = 0.91851788 × X + 0.00009621, with the determination coefficient (R2) was 0.99999982 and the correlation coefficient (R) was 0.99999990. The determination coefficient and the correlation coefficient obtained was meeting the requirements of determination coefficient not less than 0.999 for and correlation coefficient not less than 0.999.17 The limit of detection was 0.00048981 μg / mL and the limit of quantitation was 0.00148426 μg / mL. The limit of detection and the limit of quantitation was very low and showed that the method used could detect and quantify at low concentration.18 In order for the measurement results to have the linear response, good accuracy and good precision, the measurement is performed in a concentration greater than the limit of detection and limit of quantitation.19
Determination of Nitrite and Nitrate in Sample
Nitrite and Nitrate determination in broccoli and cauliflower are performed by absorbance measurement of sample solution before reduction (for Nitrite determination) and after reduction (for Nitrate determination). Table 1 shown the Data of Nitrite and Nitrate Levels in Broccoli and Cauliflower with Various Fertilization Treatment. Figure 4 shown the Graph of Nitrite and Nitrate Levels in Broccoli and Cauliflower with Various Fertilization Treatment.
Table 1: Data of Nitrite and Nitrate Levels in Broccoli and Cauliflower with Various Fertilization Treatment.
| Number | Treatment | Sample | Levels (mg/kg) | |
| Nitrite | Nitrate | |||
| 1 | Without Fertilization | Broccoli | 0.7465 ± 0.0092 | 221.4107 ± 1.8220 |
| Cauliflower | 0.8707 ± 0.0099 | 298.9252 ± 2.9014 | ||
| 2 | With Fertilization(Natural Fertilizer) | Broccoli | 0.7648 ± 0.0131 | 230.4074 ± 2.2458 |
| Cauliflower | 0.8929 ± 0.0161 | 313.6417 ± 2.6346 | ||
| 3 | With Fertilization(Chemical Fertilizer) | Broccoli | 1.0078 ± 0.0181 | 323.7144 ± 3.6148 |
| Cauliflower | 1.1902 ± 0.0098 | 438.3387 ± 3.9111 | ||
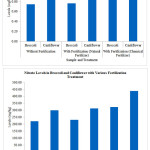 |
Figure 4: Graph of Nitrite and Nitrate Levels in Broccoli and Cauliflower with Various Fertilization Treatment. |
Determination of Nitrite and Nitrate levels in broccoli and cauliflower with various fertilization treatments showed that Nitrite levels were between 0.7465 mg/kg to 1.1092 mg/kg and Nitrate levels were between 221.4107 mg/kg up to 438.3387 mg/kg. This is in accordance with previous research which stated that Nitrite levels in vegetables were between 0.1 mg/kg to 1.2 mg/kg3 and in accordance with the literature which stated that Nitrate levels in broccoli and cauliflower were between 200 mg/kg to 500 mg/kg (classified as low Nitrate category).20 Nitrite levels in broccoli and cauliflower were lower than Nitrate levels in broccoli and cauliflower. This phenomenon occurs because nitrogen is naturally absorbed by plants in the form of Nitrate or Ammonium which is the main growth nutrient for the plant.21 Nitrite and Nitrate levels in broccoli were lower than Nitrite and Nitrate levels in cauliflower. The different plant has different Nitrite and Nitrate levels because there was the different ability of nitrogen uptake.22
Nitrite and Nitrate levels in broccoli and cauliflower with fertilization are higher than Nitrite and Nitrate levels in broccoli and cauliflower without fertilization. Nitrite and Nitrate levels in plants are influenced fertilization.23 Nitrite and Nitrate levels in broccoli and cauliflower with chemical fertilizer fertilization are higher than Nitrite and Nitrate levels in broccoli and cauliflower with natural fertilizer fertilization. Nitrite and Nitrate levels in vegetables were affected by the fertilizer type.24 Beside of fertilization and fertilizer, many other factors also affect the Nitrite and Nitrate levels, including geographical region, light intensity, light duration, soil condition, soil texture, soil temperature, air humidity, air temperature, plantation condition, harvest condition, storage condition, processing time, pesticide and herbicide.25-28
High level intake of Nitrite and Nitrate in vegetables had to reduce to Acceptable Daily Intake made by the Food and Agriculture Organization & by the World Health Organization. Because high intake of Nitrite and Nitrate might be causing a negative impact on health29 and also might be inducing for deoxyribonucleic acid damage.30 Nitrate present in vegetables can be converted (reduced) to Nitrite by plants and bacteria in nature or by bacteria in the gastrointestinal tract.31 Nitrite might be reacting with alkyl amine to form nitrosamine, and this reaction might have occurred in the acidic condition in the stomach.32 Nitrite might be reacting with alkaloid to form nitrosamine, and this reaction might have occurred in the warm storage.33 Nitrosamine had a negative impact, which could be triggered a cancer or carcinogenic effect.34
Determination of Accuracy and Precision
The spectrophotometric method used in the determination of Nitrite and Nitrate levels in broccoli and cauliflower was validated by accuracy test with recovery parameter and precision test with relative standard deviation parameter. Recovery Results for Nitrite and Nitrate in Broccoli and Cauliflower with Various Treatment and Various Range were shown in Table 2 and Table 3. Relative Standard Deviation Results for Nitrite and Nitrate in Broccoli and Cauliflower with Various Treatment and Various Range were shown in Table 4 and Table 5.
Table 2: Recovery Results for Nitrite in Broccoli and Cauliflower with Various Treatment and Various Range.
| Number | Treatment | Sample | Recovery | ||
| 50% | 100% | 150% | |||
| 1 | Without Fertilization | Broccoli | 101.85% | 101.66% | 101.42% |
| Cauliflower | 101.25% | 101.09% | 100.88% | ||
| 2 | With Fertilization(Natural Fertilizer) | Broccoli | 101.38% | 101.13% | 100.89% |
| Cauliflower | 100.75% | 100.56% | 100.45% | ||
| 3 | With Fertilization(Chemical Fertilizer) | Broccoli | 100.75% | 100.56% | 100.38% |
| Cauliflower | 100.33% | 100.25% | 100.12% | ||
Table 3: Recovery Results for Nitrate in Broccoli and Cauliflower with Various Treatment and Various Range.
| Number | Treatment | Sample | Recovery | ||
| 50% | 100% | 150% | |||
| 1 | Without Fertilization | Broccoli | 100.93% | 100.71% | 100.51% |
| Cauliflower | 100.67% | 100.54% | 100.45% | ||
| 2 | With Fertilization(Natural Fertilizer) | Broccoli | 100.82% | 100.68% | 100.49% |
| Cauliflower | 100.55% | 100.49% | 100.43% | ||
| 3 | With Fertilization(Chemical Fertilizer) | Broccoli | 100.75% | 100.56% | 100.38% |
| Cauliflower | 100.11% | 100.06% | 100.02% | ||
Table 4: Relative Standard Deviation Results for Nitrite in Broccoli and Cauliflower with Various Treatment and Various Range.
| Number | Treatment | Sample | Relative Standard Deviation | ||
| 50% | 100% | 150% | |||
| 1 | Without Fertilization | Broccoli | 1.35% | 1.08% | 0.83% |
| Cauliflower | 1.29% | 1.02% | 0.77% | ||
| 2 | With Fertilization(Natural Fertilizer) | Broccoli | 1.22% | 1.01% | 0.75% |
| Cauliflower | 1.15% | 0.91% | 0.70% | ||
| 3 | With Fertilization(Chemical Fertilizer) | Broccoli | 1.03% | 0.81% | 0.54% |
| Cauliflower | 0.93% | 0.65% | 0.45% | ||
Table 5: Relative Standard Deviation Results for Nitrate in Broccoli and Cauliflower with Various Treatment and Various Range.
| Number | Treatment | Sample | Relative Standard Deviation | ||
| 50% | 100% | 150% | |||
| 1 | Without Fertilization | Broccoli | 0.83% | 0.75% | 0.66% |
| Cauliflower | 0.77% | 0.65% | 0.54% | ||
| 2 | With Fertilization(Natural Fertilizer) | Broccoli | 0.81% | 0.72% | 0.61% |
| Cauliflower | 0.72% | 0.61% | 0.48% | ||
| 3 | With Fertilization(Chemical Fertilizer) | Broccoli | 0.45% | 0.38% | 0.25% |
| Cauliflower | 0.33% | 0.22% | 0.11% | ||
The recovery obtained from the accuracy test was between 100.02% to 101.85%. The recovery percentage obtained were meeting the requirement for accuracy test which the recovery between 80% to 120% for Nitrite (concentration between 0.1 mg/kg to 10.0 mg/kg) and between 85% to 115% for Nitrate (concentration between 100.0 mg/kg to 1000.0 mg/kg) (Association of Official Analytical Chemists, 2002). The relative standard deviation obtained from the precision test was between 0.11% to 1.35%. The relative standard deviation obtained were meeting the requirement for precision test which the relative standard deviation between 8% for Nitrite (concentration between 0.1 mg/kg to 10.0 mg/kg) (Association of Official Analytical Chemists, 2002) and 3% for Nitrate (concentration between 100.0 mg/kg to 1000.0 mg/kg) (Association of Official Analytical Chemists, 2002). The range obtained from the accuracy test and the precision test was 50% to 150% from each sample and the range of the method measurement was 0,00 μg/mL to 1.00 μg/mL (Association of Official Analytical Chemists, 2002).
Conclusion
Nitrite levels in broccoli and cauliflower are lower than Nitrate levels in broccoli and cauliflower. Nitrite and Nitrate levels in broccoli and cauliflower with fertilization are higher than Nitrite and Nitrate levels in broccoli and cauliflower without fertilization. Nitrite and Nitrate levels in broccoli and cauliflower with chemical fertilizer fertilization are higher than Nitrite and Nitrate levels in broccoli and cauliflower with natural fertilizer fertilization.
Conflict of Interests
The authors declare that they have no conflicts of interests in this research and this manuscript.
Acknowledgement
The authors acknowledge the financial support by Department of Pharmacy, Academy of Pharmacy Yayasan Tenaga Pembangunan Arjuna, Pintubosi, Laguboti, Toba Samosir, Sumatera Utara, 22381, Indonesia.
References
- Cantwell, M.; and Elliott, C. Journal of Clinical Nutrition & Dietetics, 2017, 3(4), 27-30.
CrossRef - Larsson, K.; Darnerud, P.O.; Ilbäck, N.G.; and Merino, L. Food Additives and Contaminants, 2011, 28(5), 659-666.
CrossRef - González, M.T.N.D.; Osburn, W.N.; Hardin, M.D.; Longnecker, M.; Garg, H.K.; Bryan, N.S.; and Keeton, J.T. Journal of Food Sciences, 2015, 80 (5), 942-949.
CrossRef - Pobereżny, J.; Wszelaczyńska, E.; Wirchrowska, D.; and Jaskulski, D. Chilean Journal of Agricultural Research, 2015, 75(1), 42-49.
- O’Connell, S.; and Tate, R. Horticultural Science, 2017, 52 (11), 1511-1517.
- Najdenkoska, A. Journal of Agricultural, Food and Environmental Sciences, 2016, 67, 33-39.
- Kmecl, V.; Knap, T.; and Žnidarčič, D. Italian Journal of Agronomy, 2017, 12(2), 79-84.
- Association of Official Analytical Chemists. 2002. Guidelines for Single Laboratory Validation of Chemical Methods for Dietary Supplements and Botanicals. Association of Official Analytical Chemists International. Maryland.
- Narayana, B.; and Sunil, K. Eurasian Journal of Analytical Chemistry, 2009, 4(2), 204-214.
- Cortesi, M.L.; Vollano, L.; Peruzy, M.F.; and Marrone, R.; Mercogliano, R. CyTA – Journal of Food, 2015, 13 (4), 629-634
- Mohammadi, S.; and Ziarati P. Journal of Chemical and Pharmaceutical Research, 2016, 8(6), 335-341.
- Fontenla, R.F.; Prchalb, A.; and Petrinoc, S.E. Journal of Applied Environmental and Biological Sciences, 2017, 7(9), 95-104.
- Ridnour, L.A.; Sim, J.E.; Hayward, M.A.; Wink, D.A.; Martin, S.M.; Buettner, G.R.; and Spitz, D.R. Analytical Biochemistry, 2000, 281, 223-229.
CrossRef - Bryan, N.S.; and Grisham, M.B. Free Radical Biology & Medicine, 2007, 43(5), 645-657.
CrossRef - Rezaei, M.; Fani, A.; Moini, A.L.; Mirzajani, P.; Malekirad, A.A.; and Rafiei, M. International Scholarly Research Notices, 2014, 2014, Article ID 439702.
- Patton, C.J.; and Kryskalla, J.R. 2011. Colorimetric Determination of Nitrate Plus Nitrite in Water by Enzymatic Reduction, Automated Discrete Analyzer Methods. Book 5, Laboratory Analysis, Chapter 8, Section B, Methods of the National Water Quality Laboratory. Virginia, United States Geological Survey.
- Asuero, A.G.; Sayago, A.; and González, A.G. Critical Reviews in Analytical Chemistry, 2006, 36, 41-59.
CrossRef - Ravichandran, V.; Shalini, S.; Sundram, K.M.; and Rajak, H. International Journal of Pharmacy and Pharmaceutical Sciences, 2010, 2(3), 18-22.
- Shrivastava, A.; and Gupta, V.B. Chronicles of Young Scientists, 2011, 2(1), 21-25.
CrossRef - Santamaria, P. Journal of the Science of Food and Agriculture, 2006, 86, 10-17.
CrossRef - Horchani, F.; Hajri, R.; and Smiti, S.A. Journal of Plant Nutrition and Soil Science, 2010, 173(4), 610-617.
CrossRef - Tischner, R. Plant, Cell, and Environment, 2000, 23, 1005-1024.
CrossRef - Czech, A.; Pawlik, M.; and Rusinek, E. Polish Journal of Environmental Studies, 2012, 21(2), 321-329.
- Liu, C.W.; Sung, Y.; Chen, B.C.; and Lai, H.Y. International Journal of Environmental Research and Public Health, 2014, 11, 4427-4440.
CrossRef - Guadagnin, S.G.; Rath, S.; and Reyes, F.G.R. Food Additives and Contaminants, 2005, 22 (12), 1203-1208.
CrossRef - Tamme, T.; Reinik, M.; Roasto, M.; Juhkam, K.; Tenno, T.; and Kiis, A. Food Additives and Contaminants, 2006, 23(4), 355-361.
CrossRef - Parks, S.E.; Irving, D.E.; and Milhamc, P.J. Scientia Horticulturae, 2012, 134, 1-6.
CrossRef - Aires, A.; Carvalho, R.; Rosa, E.A.S.; and Saavedra, M.J. Food Science & Nutrition, 2013, 1(1), 3-7.
CrossRef - Brkić, D.; Bošnir, J.; Bevardi, M.; Bošković, A.G.; Miloš, S.; Lasić, D.; Krivohlavek, A.; Racz, A.; Ćuić, A.M.; and Trstenjak, N.U. African Journal of Traditional, Complementary and Alternative Medicines, 2017, 14(3), 31-41.
CrossRef - Suzuki, T.; and Inukai, M. Chemical Research in Toxicology, 2006, 19(3), 457-462.
CrossRef - Tiso, M.; and Schechter, A.N. Plos One, 2015, 10 (3), e0119712.
- Deutsche Forschungsgemeinschaft. 2014. Nitrate and Nitrite in the Diet: An approach to assess Benefit and Risk for Human Health. Institut für Lebensmitteltoxikologie und Chemische Analytik. Hannover.
- Wang, J.; Yang, H.; Shi, H.; Zhou, J.; Bai, R.; Zhang, M.; and Jin, T. Journal of Chemistry, 2017, 2017, Article ID 6135215.
- Gankhuyag, N.; Lee, K.H.; and Cho, J.Y. Journal of Mammary Gland Biology and Neoplasia, 2017, 22, 159-170.
CrossRef
Accepted on: 23-11-2018


![]()


