Simultaneous Quantification of Vitamin A and E in Pharmaceutical Formulations and fruit Samples Using Fe(II)-1-Nitroso-2-Napthol Complex
Ashwani Kumar and Mamta Kamboj
Department of Chemistry٫ Kurukshetra University٫ Kurukshetra 136119٫ India.
Corresponding Author E-mail: akumarchem@kuk.ac.in
DOI : http://dx.doi.org/10.13005/ojc/340634
Article Received on : 26-10-2018
Article Accepted on : 31-11-2018
Article Published : 05 Dec 2018
A rapid and sensitive spectrophotometric method for the determination of vitamin A and vitamin E using Fe(II)-1-nitroso-2-napthol detection system is reported. The in situ reduced Fe(II) formed green coloured complex with 1-nitroso-2-napthol which gives an absorption maxima at 708nm. Beer’s law was obeyed in the range 4.0-14.0μg/mL for vitamin A and 4.0-24.0μg/mL for vitamin E with relative standard deviation 1.7% for vitamin A and 2.2% for vitamin E. The molar absorptivity was found to be 1.3×10⁴ L mol-1 cm-1 for vitamin A and 2.5×10⁴ L mol-1 cm-1 for vitamin E with the co-relation coefficients 0.996 and 0.935 for vitamin A and vitamin E respectively. Optimization of various factors was done to get the maximum absorption value. The proposed method is utilized satisfactorily for pharmaceuticals, milk sample,fruit sample and different liquid samples of vitamin A and vitamin E by pre treatment of samples.
KEYWORDS:Vitamin A; Vitamin E; Spectrophotometeric Quantitation
Download this article as:| Copy the following to cite this article: Kumar A, Kamboj M. Simultaneous Quantification of Vitamin A and E in Pharmaceutical Formulations and fruit Samples Using Fe(II)-1-Nitroso-2-Napthol Complex. Orient J Chem 2018;34(6). |
| Copy the following to cite this URL: Kumar A, Kamboj M. Simultaneous Quantification of Vitamin A and E in Pharmaceutical Formulations and fruit Samples Using Fe(II)-1-Nitroso-2-Napthol Complex. Orient J Chem 2018;34(6). Available from: http://www.orientjchem.org/?p=53457 |
Introduction
Detection of vitamins by organic metal framework is widely applicable in medicinal, biochemical and general science.1 The solubility of vitamins are differ in different organic and aqueous media, so the detection behaviour of the vitamins also depends on the selected media taken. Vitamin A and E are mainly detected using organic or organic aqueous mixed solvent system.2 Vitamin A belongs to group of fat-soluble retinoid, including retinol, retinal, and retinyl esters.3-5 Vitamin A enhances immune function, reducing the consequences of some infectious diseases. Vitamin A might have additional roles, e.g., as protection against some forms of cancers and in the treatment of skin disorders.6 In human diet vitamin A is present in two forms preformed vitamin A (retinol and its esterified form, retinyl ester) and provitamin A carotenoids.7-8 The major sources of preformed vitamin A are animal sources, including dairy products, fish, and meat (especially liver).9 By far the most important provitamin A carotenoid is beta-carotene; other provitamin A carotenoids are alpha-carotene and beta-cryptoxanthin.Similarly, vitamin E is also a fat miscible and exists in seven different forms which can be classified as α, β, γ, δ, ε, ξ and ɳ tocopherol.10 Out of all α-tocopherol is the most biologically active form of vitamin E. α-tocopherol is used as protective for polyunsaturated fatty acids within membranes and lipoproteins11 because it acts as proxy radical scavenger. In nature vitamin E exists as tocopherols and tocotrienols in the unesterified form, the common food sources of these are vegetable oils, nuts, green leafy vegetables, seeds, fruits and fortified cereals.12 Vitamin A has a vital role in many biologic processes which are essential not only for vision but also for embryonic development and the regulation of proliferation and differentiation of many cell types. Vitamin A has essential role and importance in reproduction: deficiency as well as excess is teratogenic in animals.13
In literature various methods was described for determination of vitamin A in biological, food and pharmaceutical samples such as that includes high-performance liquid chromatography,14-17 fluorimetry18 and chemiluminescence,19-20 voltammetry,21 spectrophotometry / colorimetry.22-26 And vitamin E that are suitable for their determination in feeds, aquatic organisms, biological fluids and in dosage forms by high performance liquid chromatography(HPLC),27-30 HPLC-mass spectra,31 inductively coupled plasma atomic emission spectrometry,32 Voltammetric,33-34 Spectrophotometric,35-39 fluorimetry40 and chronopotentiometry,41 capillary zone electrophoresis.42 The determination of retinol and α-tocopherol in edible materials chemically is rather complicated.43-44 Generally the extraction of lipids containing retinol and tocopherol is done for removal of the interfering substances and determination of the both the vitamins.Frequently, the most suitable method for tocopherol determination is Emmerie and Engel method45 and Carr Prise method46 for the determination of vitamin A.
In the proposed work the antioxidant property of both the fat soluble vitamins is utilized for the quantification of vitamin A and vitamin E in pharmaceutical dosage form, edible material such as fruit sample (Papaya),liquid drinks (Frooti),Infant milk powder and multivitamin syrup. Both the vitamin reduces Fe(III) in Fe(II) which then form coloured complex with the specific reagent 1-nitroso-2-napthol, that absorbance of coloured complex will therefore determine the quantity of fat soluble vitamins in various samples. As the fat soluble vitamins are sensitive to temperature and pH so the solution of vitamins was stored in amber glass bottles at very low temperature in refrigerator and solutions were renewed every month for experimentation.
Experimental
Apparatus
A double beam Systronics UV-Visible Spectrophotometer 117 equipped with quartz cell of 1 cm light path was used to record the molecular absorption spectra and absorbance at selected wavelengths. A Hanna-H -198100 pH meter was used to measured the pH of solutions.
Chemicals and Reagents
All the reagents were of analytical grade and were prepared in ultra high purity water. Retinol (Sigma Aldrich) and α-Tocopherol (Sigma Aldrich) used were prepared in absolute ethanol. Absolute ethanol and light petroleum were prepared from 95% technical alcohol and ether used was of analytical grade.
Solutions
Vitamin A Acetate (Retinol)
Weight 0.1 g of vitamin A acetate and placed it into round bottom flask.In the flask add 2ml potassium hydroxide (50% w/v), 10ml of glycerol and 25ml of ethanol and reflux the contents of round bottom flask for 45 minutes on water bath and then allow it to cool at room temperature. Place the mixture in a separating funnel and extract with 4×25ml of diethyl ether and the combine the ether extract and allow the extract to dry so that ether evaporates and the dried mass is then dissolved in ethanol in a 100ml volumetric flask.
Vitamin E
Tocopherol solution (1mg ml-1) was prepared in absolute ethanol in 100ml volumetric flask. Fe(III) solution (1mg ml-1) was prepared by dissolving 0.1 g of ferric chloride in 100 ml of double distilled water containing 1ml of 0.01 N hydrochloric acid.
0.2% of 1-Nitroso-2-Napthol was prepared in ethanol by dissolving 0.2g of reagent in 100 ml volumetric flask.
1% sodium citrate solution was prepared in water by dissolving 1g of it in 100ml volumetric flask.
Potassium Hydroxide solution (50% w/v) was prepared by dissolving 50g of KOH pellets in 100 ml of double distilled water.
Procedure
Determination of Vitamin A and E using Fe(II)-1-nitroso-2-napthol method
200μg of Fe(III) was placed a 10ml of volumetric flask wrapped with aluminium foil, add to it aliquots of retinol solution then heat it for 1 minute at 70°C then add 1.0ml sodium citrate followed by the addition of 1.0ml of reagent solution. The contents of the flask was diluted with ethanol upto the mark after thorough mixing and the absorbance ofstable green coloured complex was measured at 708 nm against a reagent blank prepared similarly.The standard calibration curve was constructed in an analogous manner by taking different amount of vitamin A and E.
Analysis of Vitamin A/E in Pharmaceutical Formulations
Sample Preparation
Five capsules containing 400mg of vitamin A/E were mixed thoroughly and 0.1g of this oily mass was transferred into 100 ml round bottom flask. In round bottom flask, 2ml of potassium hydroxide solution (50%,w/v), 10ml glycerol and 25ml absolute ehanol was added and reflux it for 50 minutes at temperature 70°C. Cool it at room temperature and then transferred the solution into separating funnel and extract with 30ml of ether for 10 minutes. Discard the aqueous layer and evaporate the etheral layer to dryness and then dissolved the dried mass in 100ml of absolute ethanol.
Procedure
The amount of Vitamin A/E was determined by following the same procedure that was used for Vitamin A/E determination in pure form as described above.
Analysis of Vitamin A/E in Infant Milk Powder
1g of the the infant milk powder was taken for the saponification.Procedure for saponification was same as that for pharmaceutical formulations.
Analysis of Vitamin A/E in Fruit Sample
Quantification of fat soluble vitamin in papaya and mango was done.Take pulp of fruit sample and freeze to dry and then this dry mass of fruit pulp was taken for quantification of vitamins. weight 5g of dry pulp and add to it 2mL of KOH followed by the addition of 10mL of glycerol and 30mL of ethanol and then reflux it for 45 minutes at 70◦C then cool it and extract with 2×30 mL of petroleum ether.Evaporate the contents of ether to dry and then dissolve the dry mass in 10mL of ethanol and dillute the stock solution for further analysis.
Results and Discussion
Fe(II) is known to form green coloured complex with 1-nitroso-2-napthol in between pH range 7.7-7.9 using sodium citrate.Fe(III) gets easily reduced to Fe(II) in the presence of lipid soluble vitamins i.e. retinol and α-tocopherol which then formed complex with reagent and the absorbance of the coloured complex was measured at 708nm and the absorbance due to reagent alone was measured at 412nm. The absorption spectra for both the vitamin A/E vs blank are shown below n figure 1.
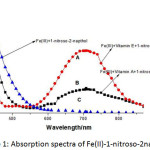 |
Figure 1: Absorption spectra of Fe(II)-1-nitroso-2 napthol. |
Conditions (Fe(III)=200/μg,
Vitamin A=50/μg, Vitamin E=50/μg, 1-nitroso-2-napthol=0.2/%,sodium citrate=1/%)
A, B=measured against blank
C= blank measured against water
The emission spectra of reagent, complex and complex in extracted form were observed. it was found that the fluorescence spectra of the reagent shows quenching when complexed with metal as shown below figure 2.
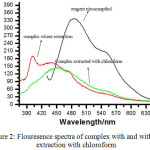 |
Figure 2: Flouresence spectra of complex with and without extraction with chloroform. |
In order to determine the optimum conditions for the quantification of retinol and α-tocopherol, various experimental parameters were investigated and the different optimized parameters were pH, temperature, reaction time and concentration of reagent. All the these parameters were determine by using 50μg of vitamin A and vitamin E dissolved in absolute ethanol and the absorbance of green coloured complex was measured at 708nm by using a UV/Vis spectrophotometer.
Effect of Reagent Concentration
As the concentration of 1-nitroso-2-napthol increases the absorbance was increased upto 1.0 ml after that as the concentration of reagent increases the absorbance started decreasing so 1.0 ml of the reagent concentration is the optimum value of maximum absorbance of the complex as shown in the figure 3.
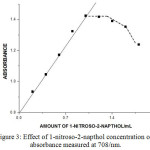 |
Figure 3: Effect of 1-nitroso-2-napthol concentration on absorbance measured at 708/nm. |
Effect of Temperature and Rate of Reaction
Reduction rate of Fe(III) to Fe(II) increases as we increase the temperature. Positive change in absorbance and maximum value of absorbance was measured at temperature 70°C above this temperature absorbance value decreased. Also the reaction rate of vitamin E was found to be more than the reaction rate of vitamin A. Time was almost double for the reduction of Fe(III) by vitamin A than that of vitamin E. Four minute time was selected for quantitative determination of both the vitamins.
Order of Addition
Orders of addition have the key role to get the maximum absorbance. It has been observed that reagent must be added after the fully reduction of Fe(III) to Fe(II) by the vitamins followed by the addition of 1.0mL of sodium citrate solution to have the maximum absorbance. Other orders gave incomplete oxidation-reduction reaction.
Prevention of Photochemical Reaction
Retinol and α-Tocopherol both are light sensitive vitamins and easily oxidized by air.Several investigations were made to solve this problem, the use of dark brown glass bottles was suggested. As both the vitamins were easily oxidized so they should store in refrigerator and determination of vitamins should done in darkened room so,it was suggested that we should use aluminium foil.Covering the flask with aluminium foil provides a dark enviournment for the reaction.
Analytical Data
Under the optimized condition the linear calibration graphs were obtained for Absorbance vs. amount of vitamin A and absorbance vs amount of vitamin E. vitamin A shows a linear calibration graph between the concentration range 4.0-14.0μg/mL with co-relation coefficient (r2) 0.996 and vitamin E shows a linear calibration graph between the concentration range 4.0-24.0 μg/mL with co-relation coefficient 0.935 as shown in table 1. The calibration graph for both the vitamins i.e. vitamin A and vitamin E is shown in figure 4. and figure 5. respectively.
Table 1: Statistical Data for vitamin A and Vitamin E.
|
Parameters |
vitamin a | Vitamin E |
|
λmax.(nm) |
708 | 708 |
|
Beer’s Limit(ᶙg mL-1) |
4.0-14.0 | 4.0-24.0 |
|
Molar Absorptivity(L mol-1cm-1) |
1.3×10⁴ | 2.5×10⁴ |
|
Regression Equation |
Y=0.054x-0.188 | Y=0.059x-0.269 |
|
Slope |
0.054 | 0.059 |
|
Intercept |
0.188 | 0.269 |
|
Correlation Cofficient |
0.996 | 0.935 |
|
Sandell’s Sensitivity(ᶙg cm-2 per 0.001 Abs. unit) |
0.000025 | 0.000017 |
|
Standard Deviation |
0.1941 | 0.4110 |
|
Relative Standard Deviation (%) |
1.7 | 2.2 |
|
pH |
7.7-7.9 | 7.7-7.9 |
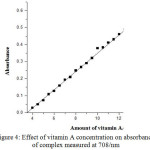 |
Figure 4: Effect of vitamin A concentration on absorbance of complex measured at 708/nm. |
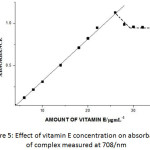 |
Figure 5: Effect of vitamin E concentration on absorbance of complex measured at 708/nm. |
Applications
The proposed procedure for the quantification of vitamin A and vitamin E was applied for various pharmaceutical formulations, oil sample, fruit sample and milk powder etc shown in the tabular form below:
Table 2: Determination of vitamin A and vitamin E in different Formulations.
|
Capsules |
Taken (μg/mL) |
Added (μg/mL) |
Found (μg/mL) |
Relative Standard Deviation (%) |
|
Vitamin A |
20 |
0 |
19.8+0.4 |
|
|
2.0 |
22.2+0.3 |
6.5 |
||
|
2.2 |
23.0+0.1 |
|||
|
2.5 |
23.5+0.2 |
|||
|
E-Rich |
20 |
0 |
20.2+0.1 |
4.4 |
|
2.0 |
21.8+0.6 |
|||
|
2.2 |
22.6+0.3 |
|||
|
2.5 |
22.5+0.4 |
|||
|
Enew |
20 |
0 |
20.2+0.3 |
|
|
2.0 |
21.6+0.2 |
2.9 |
||
|
2.2 |
21.8+0.1 |
|||
|
2.5 |
21.6+0.7 |
|||
|
Native Forte |
20 |
0 |
19.8+0.3 |
|
|
2 |
21.8+0.3 |
4.8 |
||
|
2.2 |
22.3+0.2 |
|||
|
2.5 |
22.4+0.6 |
|||
|
Evion |
20 |
0 |
19.7+0.5 |
|
|
2.0 |
20.9+0.5 |
5.8 |
||
|
2.2 |
21.6+0.7 |
|||
|
2.5 |
23.2+0.2 |
Determination of vitamin A in different Samples
| Sample | Recommended(μg/10mL) | Proposed Method(μg/10mL) |
| MulminR Syrup | 7.2 | 7.7 |
| Frooti | 6 | 6.13 |
| Infant Milk Powder | 6.6 | 5.3 |
| Papaya | – | 10.7μg/mL |
| Dates | – | 6.2μg/mL |
Method Validation
The proposed spectrophotometric method for the determination of vitamin A and vitamin E in different samples such as pharmaceuticals,fruits,syrup,milk powder etc. has been found applicable.
Conclusion
A noval, simple, selective and highly accurate UV-visible spectrophotometric method for determination of vitamin A and E in pharmaceutical formulations and fruit samples was developed and validated. These advantages encourage the applications of this method for the quantification of both the vitamins in different pharmaceutical formulations and fruit samples.
Conflict of Interest
On the behalf of all the authors, corresponding author states that there is no conflict of interest.
Acknowledgements
Authors gratefully acknowledges to the Kurukshetra University for providing laboratory facilities, the financial assistance from UGC, New Delhi, India for carrying out research work.
References
- Tutem, E.; Apak, R.; Gunaydi, E.; Sozgen, K., Talanta, 1997,vol.44, p.249.
CrossRef - Jadoon, S.; Malik, A.; Qazi, M.H.; Aziz, M., Asian J. Research chem., 2013, vol.4, p.6.
- Johnson, E.J; Russell, R.M., Beta-Carotene. In: Coates, P.M; Betz, J.M; Blackman, M.R., et al., eds. Encyclopedia of Dietary Supplements. 2nd ed. London and New York: Informa Healthcare; 2010, p.115.
CrossRef - Ross, C.A., Vitamin A. In: Coates, P.M; Betz, J.M; Blackman, M.R., et al., eds. Encyclopedia of Dietary Supplements. 2nd ed. London and New York: Informa Healthcare; 2010, p.778.
CrossRef - Ross, A. Vitamin A and Carotenoids. In: Shils, M; Shike, M; Ross, A; Caballero, B; Cousins, R., eds. Modern Nutrition in Health and Disease. 10th ed. Baltimore, MD: Lippincott Williams & Wilkins; 2006, p.351.
- Nielsen, K.W., Biologisk Regeneration,1981.
- Solomons, N.W.; Vitamin A. In: Bowman, B; Russell, R., eds. Present Knowledge in Nutrition. 9th ed. Washington, DC: International Life Sciences Institute; 2006, p.157.
- Institute of Medicine. Food and Nutrition Board. Dietary Reference Intakes for Vitamin A, Vitamin K, Arsenic, Boron, Chromium, Copper, Iodine, Iron, Manganese, Molybdenum, Nickel, Silicon, Vanadium, and Zinc. Washington, DC: National Academy Press; 2001.
- Rodriguez-Amaya, D.B.;Arlington, V.A.; JohnSnow, Inc. /OMNI Project. 1997.
- McBride, H.D.; Evans, D.H., Anal. Chem., 1973 ,vol.45, p.446.
- Siluk, D.; Oliveira, R.V.; Esther-Rodriguez-Rosas, M.; Ling, S.; Bos, A.; Ferrucci, L.; Irving,W.; Wainer., J. Pharm. Biomed. Anal., 2007,vol.15, p.1001.
- Hoppe P.P; Krennrich, G., Euro J. Nutr., 2000, vol.39, p.183.
- Combs, G.F. Jr., The Vitamins: Fundamental Aspects in Nutrition and Health, Elsevier Academic Press, USA, 2008.
- Wielinski, S.; Olszanowski, A., Chromatogrophia, 1999, vol. 50, p.104.
- Sharpless, K.E.; Arce-Osuna, M.; Thomas, J.B.; Gill, L.M., AoAC Int., 1999, vol. 82,p.288.
- Huo, H.Z.; Nelis, H.J.; lavens, P.; Sorgeloos, P.; De Leenheer, A.P., J.Chromatogr. Biomed. Appl., 1999, vol. 724, p.249.
- Strohschein, S.; Rentel, C.; Locker, T.; Bayer, E.; Albert, K., Anal.Chem., 1999 ,vol. 71 ,p.1780.
- Masson, P., Spectrochem. Acta., 1999, vol.54B, p.603.
- Suturovic, Z.J.; Marjanovic, N.J., Electroanalysis, 1999, vol.11,p. 207.
- Christie, A.A.; Deam, A.C.; Milburn, B.A.; Analyst, 1973 , vol. 98, p.161.
- Shepperd, A.J.; Hubbard, W.D., J. Assoc. Anal. Chem., 1969, vol. 52,p.442.
- Emmerie, A.; Engel, C., Rev. Trav., Chim.,1937,vol. 58,p.283.
- Caldwell, M.J.; Parrish, D.B., The effect of light on the stability of the carr-price color in the determination of vitamin A,1944.
- Atuma, S.S., J.Sci.Food.Agric.,1975,vol.26, p.393.
- Amin, A. S., Eur. J. Pharm. Biopharm., 2001,vol.51, p.267.
- Prieto, P.; Pineda, M.; Aguilar, M., Anal. Biochem., 1999, vol.269, p.337.
- Tutem, E.; Apak, R.; Gunaydi, E.; Sözgen, K., Talanta, 1997,vol.44,p. 249.
- Devi, I.; Memons, A.; Khuhawar, M.Y., Journal of the Chemical Society of Pakistan, 2004, vol.26 , p.239.
- Jadoon S,; Waseem, A,; Yaqoob, M.; Nabi, A., Chinese Chemical Letters,2010, vol.21 ,p.712.
- Razagui, I. B.; Barlow, P. J.; Taylor, K. D. A., Food Chem. ,1992,vol.44, p.221.
- Mikheeva, E.V.; Anisimova L.S., J. Anal. Chem., 2007, vol.62, p.373.
- Yinfa, M., Quantitative retinol assay for serum and driedblood spots. 1996, US Patent 5532166.
- Kienen, V.; Costa, W. F.; Visentainer, J. V.; Souza, N. E.; Oliveira. C. C., Talanta, 2008, vol. 75,p.141.
- Chavez-Servin, J.L.; Castellote, A.I.; Lopez-Sabater, M.C., J. Chromatogr. A., 2006,vol.1122, p.138.
- Holler, U.; Wolter, D.; Hofmann, P.; Spitzer, V. J., Agric. Food Chem.,2003 ,vol.51,p.1539.
- Momenbeik, F.; Momeni, Z.; Khorasni, J.H. J. Pharm. Biomed. Anal., 2005, vol.37, p.383.
- Kienen, V.; Costa, W.F.; Visentainer, J.V.; Souza, N.E.; Oliveira, C.C. Talanta , 2008,vol. 75,p.141.
- Weinmann, A.R.M.; Oliveira, M.S.; Jorge, S.M.; Martins, A.R. J. Chromatogr. B.,1999 ,vol.729, p.231.
CrossRef - Yaqoob, M.; Waseem, A.; Rishi, L.; Nabi, A.; Luminescence, doi:10.1002/bio.1089,in press.
CrossRef - Waseem, A.; Rishi, L.; Yaqoob, M.; Nabi, A. Anal. Sci., 2009, in press.
- Atuma, S.S.; Lindquist, J.; Lundstrom, K., Analyst,1974, vol.99, p.683.
- Craig, R.G.; Bergquist, L.M.; Searcy, R.L. Anal. Biochem.,1960,vol.1,p.433
CrossRef - Lucy, A.J.; Lichti, F.O., Biochem. J.,1969, vol.112, p.231.
- Bayfield, R.F., Anal. Biochem., 1971,vol.39, p.282.
- Ibrahim, F.A.; Hassan, S.M.; Hefnawy, M.M. Mikrochim. Acta., 1991,vol.1, p.209.
CrossRef - Spatny, N.; Haswell, S.J.; Grasserbauer, M. Anal. Proc. Incl. Anal. Commun.,1995, vol. 32, p.141.
CrossRef

This work is licensed under a Creative Commons Attribution 4.0 International License.
![]()
A New Edition of Web of Science
Journal Impact Factor
2022: 0.5
Five Year: 0.8
Journal is Indexed in

Cabells Whitelist
![]()


