Silver Nanocomposites Decorated Reduced Graphene Oxide Nanosheets for Electrochemical Sensor Applications
 and J. Balavijayalakshmi2
1,2Department of Physics, PSGR Krishnammal College for Women, Coimbatore, Tamilnadu, India.
Corresponding Author E-mail: balavijayalakshmiroopa@gmail.com
DOI : http://dx.doi.org/10.13005/ojc/340626
Download this article as:
![]()
Recently, metal nanoparticles incorporated carbon nanostructures have tremendous applications in the field of nanosensor and technologies. In the proposed work, silver nanoparticles (Ag) decorated reduced graphene oxide nanosheets (rGONS) (rGONS-Ag) are synthesized and developed for the sensitive detection of ortho-Nitrophenol (o-NP) using electrochemical techniques. The rGONS-Ag nanocomposites are synthesized through chemical reduction method. The physical and electrochemical behaviour of the synthesized rGONS-Ag nanocomposites are characterized by using Fourier-transform infrared spectroscopy (FT-IR), X-ray diffraction (XRD), Scanning electron microscope (SEM), Energy dispersive X-ray spectroscopy (EDAX), Transmission electron microscopy (TEM) and Cyclic voltammetry (CV) techniques. The X-ray diffraction analysis reveals the formation of well crystalline silver nanoparticles (AgNp’s) on the surface of rGO nanosheets with the crystallite size of about 22.775 nm. The morphological analysis reveals the formation of well distributed cubic shape AgNp’s on the surface of rGO nanosheets. The rGONS‐Ag nanocomposites modified glassy carbon electrode (GCE) shows the good electrochemical detection performance for ortho-Nitrophenol (o-NP) with the linear detection range from 2 mM to 8 mM and with the sensitivity of about 0.221 mA mM-1 cm-2.
KEYWORDS:O-Nitrophenol and Electrochemical Sensor; Reduced Graphene Oxide Nanosheets; Silver Nanoparticles
Introduction
Automation and urbanization have accumulated the amount of different pollutants in water and environment. This enlarged pollution builds innovative challenges for the protection of water property from the consequence of various anthropogenic actions.1 Various technologies have been developed to determine the pollutants in environment and protect human health from chemicals. Among all the pollutants, Nitrophenol and its derivatives plays a crucial role in hazardous health defects. Nitrophenols are extensively used as intermediates in the manufacturing of pharmaceuticals, pesticides and dyestuffs, such as parathion insecticide.2 Among all the nitrophenol derivatives, ortho-Nitrophenol (o-NP) is an important phenol derivative, which has expended powerful toxic effects on humans, animals, and plants. Based on the above described health defects, it is necessary to develop a new technique capable of rapid determination of o-Nitrophenol in environment.3 Various techniques are routinely investigated for the detection of o-Nitrophenol in environment. The available techniques are spectrophotometry,4 spectrofluorometry,5 high performance liquid chromatography,6 capillary electrophoresis,7 electrochemical techniques8 and GC–MS methods.9 Among all these detection techniques, electrochemical methods have gained considerable assiduity because of their high sensitivity, low cost, simple and stable operations.10
Recently, graphene oxide has received great attention in scientific and industrial research areas because of its tremendous properties such as high thermal conductivity, high electron mobility and high surface area.11 Graphene oxide is single, tightly packed, layer structured of sp2 hybridized carbon atoms arranged in a two dimensional honeycomb lattices. These properties make graphene oxide as an excellent electrode material for the electrochemical applications. But the properties such as hydrophobicity and limited dispersibility of graphene oxide reduce the electrochemical properties of graphene oxide. To enhance these properties of graphene oxides, it is necessary to functionalize graphene oxide with metals and metal oxides. In this work silver nanoparticles are used to functionalize the graphene oxide surface to enhance the electrochemical properties of graphene oxide.1 Several noble metals including silver (Ag), gold (Au), platinum (Pt) and palladium (Pd) have been widely employed as an electrode material for the sensitive determination of o-nitrophenol due to its high activity and good efficiency.9 In this present work, silver nanoparticles decorated reduced graphene oxide nanocomposite (rGONS-Ag) is synthesized and employed for the selective determination of ortho-Nitrophenol (o-NP).
Materials and Methods
Synthesis of rGONS-Ag Nanocomposites
Graphene oxide nanosheets are synthesized via modified Hummer’s method and it was clearly reported in the previous work.12 rGONS-Ag nanocomposites are synthesized by taking 50 mg of graphene oxide in a beaker containing 50 ml of water and then dispersed using ultrasonicator for an hour. Simultaneously, 0.006 M concentration of silver nitrate is taken and dispersed in a 50 ml of distilled water. The dispersed silver nitrate solution is then added drop wise into the graphene oxide suspension followed by the addition of 0.5 M concentration of sodium borohydrate (NaBH4) solution as a reducing agent. The pH of the reaction mixture is adjusted to 10 by using HCL/NaOH. The reaction mixture is then allowed to stirrer for 4 hours at 80°C. Finally, the reaction mixture (rGONS-Ag) is centrifuged using deionised water and dried under vacuum for 4 hours.13-14
Results and Discussion
Fourier Transform-Infrared Spectral Analysis
Fourier transform infrared (FT-IR) spectrum of synthesized rGONS-Ag nanocomposite is shown in the Fig.1. In the Fig. 1, the FT-IR characteristic bands observed at 1218.5 cm-1, 1366.7 cm-1 and 1736 cm-1 are may be attributed to the stretching vibration of C-O epoxy group, bending vibrations of O-H group and stretching vibrations of C=O group. The other characteristic band observed at 1524 cm-1 may be corresponds to the skeletal vibrations of C=C functional groups of reduced graphene oxide nanosheets.15 The bands observed in the range of 500-1000 cm-1 may be due to the silver nanoparticles incorporated on the surface of reduced graphene oxide nanosheets. In the Fig. 1, the intensity of the vibrational bands correspond to the oxygen related functional groups such as C=O and O-H is found to be low which evidences the reduction of graphene oxide to reduced graphene oxide nanosheets during the synthesis of silver nanoparticles decorated reduced graphene oxide (rGONS-Ag) nanocomposites.15
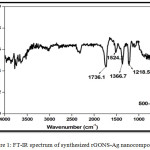 |
Figure 1: FT-IR spectrum of synthesized rGONS-Ag nano composites. |
X-ray Diffraction Structural Analysis
The structure and crystalline nature of the synthesized rGONS-Ag nanocomposites is characterized by using X-ray diffraction analysis (XRD). Fig. 2 shows the X-ray diffraction pattern of synthesized silver nanoparticles decorated reduced graphene oxide (rGONS-Ag) nanocomposites. The characteristic diffraction peak obtained at 9.50C with the crystalline plane of (002) indicates the presence of graphene oxide nanosheets in the synthesized rGNOS-Ag nanocomposite and the other diffraction peaks obtained at 38.4°C, 44.5°C, 64.7°C, and 77.6°C corresponds to the (111), (200), (220) and (311) crystalline planes of face centred cubic structure silver nanoparticles, respectively and are well matched with the JCPDS card No (04-783).1,16-17 The crystallite size of the silver nanoparticles decorated on the surface of reduced graphene oxide nanosheets are calculated using the Debye-Scherrer’s equation18 and are tabulated in the table 1.
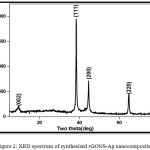 |
Figure 2: XRD spectrum of synthesized rGONS-Ag nano composites. |
![]()
Table 1: Determination of crystallite size of silver nanoparticles incorporated on the reduced graphene oxide nanosheets.
| Sample | 2θCAL(deg) | dCAL(A0) | dJCPDS(Ao) | hkl | CRYSTALLITE SIZE(nm) |
| Silver Np’s | 38.408 | 2.342 | 2.351 | 111 | 24.326 |
| 44.578 | 2.031 | 2.043 | 200 | 20.891 | |
| 64.735 | 1.439 | 1.452 | 220 | 21.157 | |
| 77.644 | 1.229 | 1.231 | 311 | 24.729 | |
| Average crystallite size | 22.775 | ||||
The calculated crystallite size of the silver nanoparticles is found to be around 22.775 nm. In comparison with the diffraction peak intensity of silver nanoparticles, the typical GO diffraction peak intensity is very low, which may be due to the attachment of silver nanoparticles to the interlayers of reduced graphene oxide and also reduction of graphene oxide into reduced graphene oxide nanosheets. This attachment of silver nanoparticles with the reduced graphene oxide nanosheets prevents the restacking nature of reduced graphene oxide nanosheets. At the same time, the diffraction peaks intensity corresponding to silver nanoparticles are very sharp, thereby confirming the formation of high crystalline silver nanoparticles on the surface of reduced graphene oxide nanosheets.11
Scanning Electron Microscopy Analysis
Scanning electron micrographs (SEM) of synthesized rGONS-Ag nanocomposites with two different magnifications (×10,000 and ×20,000) are shown in Fig. 3. Scanning electron micrograph of the rGONS-Ag nanocomposites shows the formation of sheet like morphology of reduced graphene oxide nanosheets where as the bright white spots indicate the formation of silver nanoparticles on the surface of reduced graphene oxide nanosheets. It is observed from the Fig. 3 that the cubic shaped silver nanoparticles are uniformly distributed on the surface of reduced graphene oxide nanosheets without out any agglomeration. The formation of cubic shape silver nanoparticles on the surface of reduced graphene oxide nanosheets is also evidenced by X-ray diffraction analysis.17
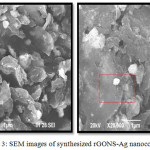 |
Figure 3: SEM images of synthesized rGONS-Ag nano composites.
|
Energy Dispersive X-ray Analysis
The elemental analysis of synthesized rGONS-Ag nanocomposites is done by using Energy dispersive X-ray spectroscopic (EDAX) techniques. Fig. 4 shows the Energy dispersive X-ray spectrum of synthesized silver nanoparticles decorated reduced graphene oxide (rGONS-Ag) nanocomposites. The Energy dispersive X-ray spectrum of synthesized rGONS-Ag nanocomposite shows the strong signals for carbon, oxygen and silver elements and their atomic and weight percentages are tabulated and are shown in the inset of the Fig. 4. The presence of carbon, oxygen and silver elements in the Fig.4 confirms the formation of silver nanoparticles decorated reduced graphene oxide nanocomposites which could also be evidenced from X-ray diffraction and Scanning electron microscopy analysis.17 In comparison with the weight ratio of carbon and silver element, the weight ratio of oxygen element present in the rGONS-Ag nanocomposites is very low which evidences the removal of oxygen functional group from the GO nanosheets during the formation of rGONS-Ag nanocomposites and reduction of GO to rGO nanosheets which will enhances the electrochemical property of rGONS-Ag nanocomposites.
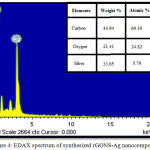 |
Figure 4: EDAX spectrum of synthesized rGONS-Ag nano composites.
|
Transmission Electron Microscopy Analysis
The transmission electron micrograph of the synthesized rGONS-Ag nanocomposite is shown in the Fig. 5. The TEM image depicts that, the synthesized reduced graphene oxide nanosheets are very thin and trasparent. It is also observed from the Fig. 5 that, the silver nanoparticles are well distributed on the surface of rGO nanosheets. The distributions of silver nanoparticles are homogeneous without aggregation, which confirms the successful synthesis of rGONS-Ag nanocomposites.19-20
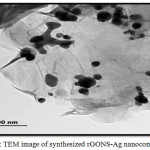 |
Figure 5: TEM image of synthesized rGONS-Ag nano composites.
|
Selected Area Diffraction Analysis
The selected area electron diffraction pattern (SAED) of the synthesized rGONS-Ag nanocomposites is shown in Fig. 6. It is observed from the Fig. 6. that, there are four discrete bright rings which indicates the successful formation of well crystalline face centered cubic structure of silver nanoparticles on the surface of reduced graphene oxide nanosheets. Each rings are corresponds to the (111), (200), (220) and (311) planes of silver nanoparticles, which could also be evidenced from XRD analysis.21
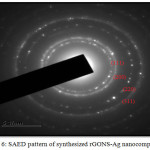 |
Figure 6: SAED pattern of synthesized rGONS-Ag nano composites.
|
Electrochemical Analysis
Fig. 7 shows the electrochemical behaviour of (a) bare GCE and (b) rGONS-Ag nanocomposites modified glassy carbon electrode (GCE) in 0.1 M of pH 7.0 phosphate buffers solution (PBS) containing 10 mM of o-Nitrophenol at the scan rate of 10 mVs-1. As shown in the Fig. 7a, there is no significant redox peak current is observed for the bare GCE in PBS electrolyte containing 10 mM of o-Nitrophenol, thereby confirming that there is no electro-active behaviour between bare GCE and o-nitrophenol. In the Fig. 7b, the rGONS-Ag nanocomposites modified GCE shows the well defined redox peak potential at -0.74V and -0.38V, respectively.10 The reduction and oxidation current response towards the electrochemical reduction of o-nitrophenol is obtained at -0.21 mA and 0.045 mA, respectively. The current response for the rGONS-Ag modified GCE is much higher than that of bare GCE which indicating that the rGONS-Ag modification exhibits a better direct electron transfer performance than bare GCE. The cyclic voltammetry analysis confirms that the synthesized rGONS-Ag nanocomposites have ability to sense o-Nitrophenol.22
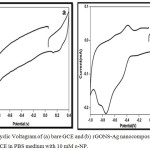 |
Figure 7: Cyclic Voltagram of (a) bare GCE and (b) rGONS-Ag nanocomposites modified GCE in PBS medium with 10 mM o-NP.
|
Effect of Concentration
Cyclic voltammetry (CV) study is performed to examine the sensitivity of rGONS-Ag modified GCE towards the detection of ortho-nitophenol (o-NP) in the phosphate buffer solution (PBS) solution with the pH value of 7.0 at the scan rate of 10 mVs-1 and is shown in the Fig. 8. Electrochemical detection of ortho-nitrophenol is performed in a series of solution containing different concentration of o-nitrophenol from 1 mM to 11 mM. As shown in Fig. 8, the redox peak current corresponds to the electrochemical reduction of o-NP is increases with the increase in concentration of o-NP from 1 mM to 10 mM. This increase in the current response reveals that the reduced graphene oxide nanosheets are excellent platform for the decoration of silver nanoparticles and also the excellent electrocatalytic behaviour of silver nanoparticles10. The rGONS-Ag nanocomposite not only increases the surface area of the modified electrode but also facilitates the electron transfer process to the electrode. With the continuous increase in the concentration of o-NP above 10 mM the redox peak current get decreases which indicating that the electrochemical reduction of o-NP by the rGONS-Ag modified GCE reaches its saturation.22
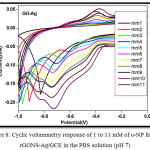 |
Figure 8: Cyclic voltammetry response of 1 to 11 mM of o-NP for the rGONS-Ag/GCE in the PBS solution (pH 7).
|
Linear Range and Limit of Detection
Linearity graph is plotted between the 2 mM- 10 mM concentrations of ortho-nitrophenol to the detection current response using the cyclic voltammetry study for the rGONS-Ag nanocomposites modified GCE and is shown in the Fig. 9. The graph is plotted between 2 mM to 10 mM concentration of o-NP due to the reason that the rGONS-Ag/GCE does not show any sensing behaviour for the 1mM concentration and the detection response is started to decrease above the 10 mM concentration of o-NP. As shown in Fig. 9, the reduction peak current value is found to be linear with the concentration of ortho-nitrophenol in the range of 2 mM to 8 mM22. For the concentrations of o-NP above 8 mM, the graph is not linear which confirms that the linear detection range of the synthesized rGONS-Ag nanocomposite is from 2 mM to 8 mM and the sensitivity of the rGONS-Ag/GCE nanocomposites is found to be 0.221 mA mM-1 cm-2.
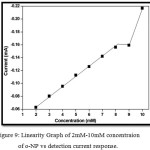 |
Figure 9: Linearity Graph of 2mM-10mM concentraion of o-NP vs detection current response.
|
Conclusion
The present work illustrates the synthesis of silver nanoparticles decorated reduced graphene oxide (rGONS-Ag) nanocomposites and the sensitive electrochemical determination of ortho-Nitrophenol. The structural analysis revealed that the silver nanoparticles decorated on the surface of reduced graphene oxide nanosheets are well crystalline with fcc structure and the calculated crystallite sizes of the silver nanoparticles are found to be 22.775 nm. Morphological investigation showed the cubic shapes of the silver nanoparticles on the surface of reduced graphene oxide nanosheets. The electrochemical behaviour of the synthesized rGONS-Ag nanocomposites is examined for the detection of o-Nitrophenol. The rGONS-Ag nanocomposites modified glassy carbon electrode showed a good electrochemical behaviour for the detection of o-Nitrophenol, due to the good electrochemical activity between rGNO-Ag nanocomopsite and ortho-Nitrophenol.
Conflict of Interest
There is no conflict of interest.
Acknowledgements
This research did not receive any specific grant from funding agencies in the public, commercial, or not-for-profit sectors.
References
- Dubey, S.P.; Nguyen, T.M.; Kwon, Y.N.; Lee, C. J. Ind. Eng. Chem., 2006, 16, 653-663.
- Cheng, Y.; Li, Y.; Li, D.; Zhang, B.; Hao, R.; Sang, S. Int. J. Electrochem., Sci., 2017, 12, 7754 – 7764.
CrossRef - Liu, J.; Chen, Y.; Guo, Y.; Yang, F.; Cheng, F. Journal of Nanomaterials., 2013, 4, 1-6.
CrossRef - Niazi, A.; Yazdanipour, A. Journal of Hazardous Materials., 2007, 146, 421-427.
CrossRef - Nistor, C.; Oubi, A.; Marco, M.P.; Barcelo, D.; Emneus, J. Analytica. Chimca. Acta., 2001, 426, 185-195.
CrossRef - Thompson, M.J.; Ballinger, L.N.; Cross, S.E.; Roberts, M.S. J. Chromatogr. B. Biomed. Appl., 1996, 677, 117-122.
CrossRef - Guo, X.; Wang, Z.; Zhou, S. Talanta., 2004, 64, 135-139.
CrossRef - Liu, Z.; Du, J.; Qiu, C. Electrochemistry Communications., 2009, 11, 1365-1368.
CrossRef - Yang, L.; Zhang, H.; Yu, S.; Ding, Y.; Cao, Y.; Yang, F.; Zhang, X.; Lia, S. Journal of The Electrochemical Society., 2016, 163, 188-191.
CrossRef - Zhang, C.; Govindaraju, S.; Giribabu, K.; Huh, Y.S.; Yun, K. Sensors and Actuators B., 2017, 252, 616-623.
CrossRef - Gurunathan, S.; Han, J.W.; Park, J.H.; Kim, E.; Choi, Y.J.; Kwon, D.N.; Kim, J.H. Int. Journal of Nanomedicine., 2015, 10, 6257-6276.
CrossRef
- Ramalakshmi, V.; Balavijayalakshmi, J. Mechanics, Materials Science & Engineering., 2018, 14, 1-14.
- Bhunia, S.K.; Nikhil, R.; Jana. Appl. Mater. Interfaces., 2014, 6, 20085-20092.
CrossRef - Das, R.M.; Rupak, K.S.; Ratul Saikia, Vinayak, S.K.; Manjusha, V.S.; Sengupta, P. Colloids and Surfaces B: Biointerfaces., 2011, 83, 16–22.
CrossRef - Soumen, D.; Chaiti, R.; Sougata, S.; Mukul, P.; Yuichi, N.; Tarasankar, P. Appl. Mater. Interfaces., 2013, 5, 8724-8732.
CrossRef - Anandalakshmi, K.; Venugobal, J.; Ramasamy, V. Applied Nanoscience., 2016, 6, 399-408.
CrossRef
- Vi, T.T.T.; Kumar, S.R.; Rout, B.; Liu, C.H.; Wong, C.B.; Chang, C.W.; Chen, C.H.; Chen, D.W.; Lue, S.J. Nanomaterials., 2018, 8, 1-15.
- Jobitha, G.; Rajeshkumar, S.; Annadurai, G.; Kannan, C. J. Environ. Nanotechnol., 2013, 2, 04-10.
- Hui, Y.; Ma, X.; Hou, X.; Chen, F.; Yu, J. Ionics., 2014, 21, 1751-1759.
CrossRef - Xing, Y. J. Phys. Chem. B., 2004, 108, 19255-19259.
CrossRef - Liu, W.; Li, C.; Gu, Y.; Tang, L.; Zhang, Z.; Yang, M. Electroanalysis., 2013. 25, 1-10.
CrossRef - Li, F.; Aimin, Y. Sensors and applications., 2014. 14, 1-6.
Accepted on: 30-11-2018


![]()


