Oxidative Coupling: A Tranquil Approach for Determination of Selexipag by Visible Spectrophotometry

1Department of Chemistry, Acharya Nagarjuna University, Nagarjuna Nagar-522510, India.
2GITAM University – Bengaluru, Karnataka-562163, India.
Corresponding Author E-mail: doctornadh@yahoo.co.in
DOI : http://dx.doi.org/10.13005/ojc/340656
Download this article as:
![]()
The present study is a first report on development of a spectrophotometric method for determination of selexipag (used to cure pulmonary arterial hypertension) in bulk and tablet formulation and its validation. The basis of the proposed method is formation of a chromophore (of λ max 600 nm) in presence of acidic ferric chloride by oxidative coupling reaction between selexipag and MBTH (3-methylbenzo-thiazolin-2-one hydrazone) solution. Regression analysis (r > 0.999) shows that the plotted calibration curve exhibits good linearity in the studied range of concentration (5 – 30 μg mL-1). As per the existing guidelines of ICH, various parameters of the method were tested for validation. Low values of R.S.D. (< 2 %) were observed indicating that the proposed method is reproducible, accurate and precise.
KEYWORDS:Colorimetry; MBTH; Oxidative Coupling; Selexipag; Validation
Introduction
Selexipag belongs to a class of organic compounds known as dialkylarylamines.1 The drug is used for treatment of high blood pressure in the lungs called PAH (pulmonary arterial hypertension). Selexipag aids to prolong the progression of disease and hence decreases the threat of hospitalization.2 It was approved by FDA in 2015. The active metabolite of the drug is ACT-333679 and earlier it was familiar as MRE-269. It also acts as an agonist to the IP (prostacyclin) receptor so that vasodilation increases in the pulmonary circulation which ultimately results in blood supply to the lungs due to a reduction in raised pressure in the blood vessels.3 IUPAC name of the drug is 2-{4-[(5,6-diphenylpyrazin-2-yl)(propan-2-yl)amino]butoxy}-N-methanesulfonylacetamide (Figure 1).
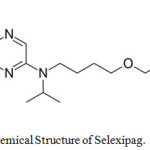 |
Figure 1: Chemical Structure of Selexipag. |
Literature review shows that only one HPLC method is reported for determination of selexipag4 and no report of any visible spectrophotometric method. Hence, in the current study, an attempt has been made to develop a flexible and sensitive spectrophotometric method in the visible region to determine the amount of selexipag in bulk drug as well as tablet dosage formulations using a coupling agent like 3-methylbenzothiazolinone hydrazone (MBTH).
Materials and Methods
TECHOMP (UV 2310) double beam UV-Visible Spectrophotometer with HITACHI software version 2.0 was used to measure the absorbance. Quartz cuvetts (10 mm path length) were used for the analysis. Digital pH meter (Elico LI-120) and balance (Shimadzu AUX-220) were used to weigh the samples and to measure pH respectively. Spectroscopic measurements were conducted at room temperature (25 ± 5°C). All chemicals used in the present study were AR grade. In the entire process, used water was double distilled.
Preparation of Reagents
Ferric chloride (3% w/v) solution was prepared in 1 molar hydrochloric acid. MBTH reagent (3-Methyl-2-benzothiazolinone-hydrazone HCl – 0.5% w/v) and selexipag solutions (standard stock and working) were prepared using in distilled water and methanol respectively.
Results and Discussions
Absorption Spectrum of Coloured Complex
A characteristic absorption maximum was observed at 600 nm for the developed chormophore in determination of selexipag by visible spectrophotometry (Figure 2).
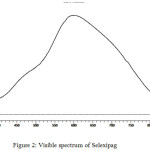 |
Figure 2: Visible spectrum of Selexipag. |
Reaction Conditions and their Optimization
Optimized the reaction conditions which affect chromophre (colored complex) formation. Study was carried out on parameters like type and quantity of oxidant, MBTH concentration, temperature, acidity, sequence of reagents addition and diluting solvents. To determine the amount of selexipag in bulk and tablet dosage form, the optimized conditions were maintained throughout the process. Out of the various oxidants used (K2Cr2O7, FeCl3, NaIO4, Ce(NH4)4(SO4)4, K3[Fe(CN)6] and chloramine-T), FeCl3 was proved to be the best taking into consideration of sensitivity, speed of formation and stability of the formed coloured complex. Persistent colour intensity was achieved by using 0.5% MBTH (3 mL) and 3% ferric chloride solution (3 mL) along with an incubation time of 15 minutes. The developed complex exhibited maximum intensity when the sequence of reagents addition was drug, MBTH and Fe+3 solutions. In spite assorted reports on this sequence, the present order was followed by earlier researchers while using Fe+3 as oxidant.5-8 Though, the colour development was not influenced by acidity, one molar acidity was optimized to help dissolution and stabilization of Fe+3 ions. Comparable results were observed on usage various solvents (methanol, water, ethanol and acetone) as diluents. Taking into consideration of availability and cost, water was chosen as a diluting solvent. A raise of temperature from room temperature to higher (35°C, 40°C and 45°C) resulted in a significant decrease of intensity. Hence, all the experiments were performed at ambient temperature in view of coloured complex instability leading to precipitate formation at elevated temperatures.
Chromophore Formation and Chemistry
Various pharmaceutical compounds containing aromatic amines, salicylic amines and polyhydroxy compounds were determined by colorimetric reaction with MBTH.18-21 In the present study, bluish green coloured product is formed due to reaction of MBTH with selexipag in presence of FeCl3 in acidic medium. An electrophilic intermediate (II) is formed due to lose of 2 e– and one H+ in the oxidation of MBTH (I) by Fe+3 (Fig. 3). On oxidizing the MBTH (I) with ferric chloride, an oxidizing agent, an electrophilic intermediate (II) is formed by the loss of 2 electrons and a proton (Figure 3). The so formed (II) acts as an active coupling species.9 1:1 (Selexipag:MBTH) stoichiometry (obtained from limiting logarithmic method10) indicates mono substitution of (II) on selexipag. The tentative reaction scheme was given in Figure 4.
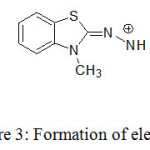 |
Figure 3: Formation of electrophile (E+). |
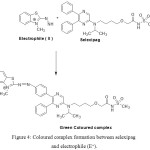 |
Figure 4: Coloured complex formation between selexipag and electrophile (E+). |
Optimized Method Procedure
3 mL each of the above prepared MBTH reagent and FeCl3 solutions were added to all flasks containing an aliquot of standard working solution of drug (100 µg mL–1) taken in a 10 mL volumetric flask. Then allowed to react for 15 min with intermittent stirring. Distilled water was used to makeup to the mark of flask. Absorbance of the so generated bluish green coloured chromophore was measured against the blank at λ max 600 nm.
Validation of Method
Linearity and Range
The calibration curve was constructed by plotting a graph between absorbance versus concentrations and was found to be linear (Fig. 5). Three independent measurements of absorbance were carried out for each concentration (5 – 30 μg mL-1) and mean value represents the point present on the calibration curve (Table 1). y = 0.0374 x + 0.0217 was the linear regression equation. The correlation coefficient was greater than 0.999 and hence, the linearity of the proposed analytical method was tested. Table 2 represents different optical and regression parameters.
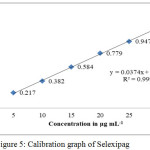 |
Figure 5: Calibration graph of Selexipag. |
Table 1: Calibration Curve Values.
|
Conc. (µg mL-1) |
Absorbance* |
|
5 |
0.217 |
|
10 |
0.382 |
|
15 |
0.584 |
|
20 |
0.779 |
|
25 |
0.947 |
|
30 |
1.148 |
*Average value of three independent determinations.
Table 2: Key Parameters of Method Development & Validation.
|
S. No. |
Concerned parameter |
Observed value |
|
Optical characteristics |
||
| 1. | Sandell’s sensitivity | 0.0255 µg cm–2 |
| 2. | Apparent molar absorptivity | 4.84×10⁴ L mol-1 cm-1 |
|
Regression analysis |
||
| 1. | Slope | 0.0374 |
| 2. | Intercept | 0.0217 |
| 3. | Regression coefficient (r) | 0.999 |
|
Validation parameters |
||
| 1. | λ max | 600 nm |
| 2. | LOQ | 0.30 μg mL-1 |
| 3. | Linearity Range (Beer’s Law Limit) | 5-30 μg mL-1 |
| 4. | LOD | 0.09 μg mL-1 |
Accuracy
Percent recovery values were determined to know current method accuracy. This was accomplished by the addition of various quantities (50% to 150%) of selexipag bulk sample to fixed quantify (10 μg mL-1) in order to maintain the total amount of drug (theoretical) concentration within the linearity range. Table 3 shows that the % recovery values fall in 98.95 – 99.95 range. Current method can be considered to be of highly accurate due to small values of % RSD as well as S.D.
Table 3: Recovery of Selexipag.
|
Recovery level (%) |
Recovered amount of drug (µg mL-1) (Practical) |
Statistical evaluation |
% Recovery = Practical x 100% / Theoretical |
|
50 |
14.89 |
Mean:14.87 SD: 0.02 %RSD: 0.11 |
99.26 |
|
14.88 |
99.20 |
||
|
14.85 |
99.00 |
||
|
100 |
19.79 |
Mean: 19.90 SD: 0.08 %RSD: 0.43 |
98.95 |
|
19.94 |
99.70 |
||
|
19.99 |
99.95 |
||
|
150 |
24.86 |
Mean: 24.91 SD: 0.04 %RSD: 0.16 |
99.44 |
|
24.91 |
99.64 |
||
|
24.96 |
99.84 |
Nominal concentration used (a) : 10 µg mL-1
Amount of drug added (b) : 5, 10 and 15 µg mL-1
Total amount of drug (a + b) (Theoretical): 15, 20 and 25 µg mL-1
Precision
Inter-day and intraday precisions were studied by selecting different three concentrations of selexipag in the above selected range for linearity (5 – 30 μg mL-1). Analysis of each concentration (of six independent series) was carried out out on consecutive days (six in numbers) as well as on the same day (Table 4). %RSD results of both precision studies were observed in the range 0.33 – 0.96 and 0.51 – 1.19 respectively, indicating the satisfactory precision of the method.
Table 4: Precision Studies.
|
Selexipag (μg mL-1) |
Observed amount* |
|||
|
Intraday** |
% RSD |
Inter-day** |
% RSD |
|
|
5 |
5.19±0.05 |
0.96 |
5.03±0.08 |
1.19 |
|
10 |
9.70±0.06 |
0.62 |
10.11±0.09 |
0.89 |
|
15 |
15.00±0.05 |
0.33 |
14.82±0.08 |
0.54 |
* Average of six determinations.
** Values of Mean ± SD in μg mL-1
Ruggedness
Assay of different amounts of selexipag (5, 10 and 15 μg mL-1) was carried out by two different analysts on different days under the above given method optimized conditions in order to appraise the ruggedness of the current developed method. Lack of significant difference in the values produced by different analysts indicates the evidence for reproducible results (Table 5). Hence, ruggedness of this method is confirmed.
Table 5: Selexipag Determination Method Ruggedness.
|
Conc. of Selexipag (μg mL-1) |
Observed Conc. * |
|
|
Mean ± SD (μg mL-1) |
% RSD
|
|
|
5 |
5.17±0.04 |
0.77 |
|
10 |
9.69±0.08 |
0.82 |
|
15 |
15.04±0.15 |
0.99 |
* Average of six determinations.
Limits of Detection and Quantification
As per the ICH guidelines (2005), LOD and LOQ were calculated to determine the sensitivity of the proposed method using formula (3.3 × σ /S) and (10 × σ /S) respectively taking into consideration of ratio between signal and noise,11-12 where S (calibration curve slope) and σ (S.D. of the response). The corresponding calculated values for selexipag determination are given below.
LOD = 0.30 μg mL-1 and
LOQ = 0.09 μg mL-1
Analysis of Pharmaceutical Formulations
Considering the average weight as basis, the amount of API present in formulation (Tablet) was determined by measuring the absorbance values of chromophores derived from the extracts of selexipag tablets (Uptravi®) (Table 6). To determine the amount of selexipag present in the tablet formulations, the above suggested method can be used because the recovery values of the API is good. It indicates the non-interference to the above method from common excipients. In developing countries, the most opted analytical technique is spectrophotometry to carry out the routine analysis in QC laboratories of industries.13-15 Hence, the above method which comprises MBTH as a coupling agent can be applied to determine the quantity of selexipag present in pure and tablet formulations.
Table 6: Estimation of Selexipag From Its Formulation by Visible Spectrophotometric Method.
|
Formulation |
Labeled Amount (µg) |
Amount found* Mean ± SD (µg) |
% Drug Recovered |
%RSD |
|
Uptravi® Tablets |
200 |
199.26 ± 0. 280 |
99.63 |
0.14 |
* Average of three determinations
Conclusions
The proposed method is simple and straightforward as there is no need to main complicated conditions (like intricate sample treatment, tiresome liquid-liquid extractions of chromophores, vigilance to maintain critical optimum pH etc) and can be performed without usage of expensive or sophisticated instrumentation. All these advantages help to encourage the proposed method in routine analysis of selexipag (bulk drug and pharmaceutical dosage forms) in quality control laboratories, as alternatives to the HPLC and LCMS/MS methods.
Acknowledgements
Authors are thankful to Acharya Nagarjuna University and GITAM-Bengaluru Campus for providing facilities to carry out the present research work.
References
- Sitbon, O.; Morrell, N. Eur. Respir. Rev., 2012, 21(126), 321-327.
CrossRef - Sharma, K. Expert Rev. Respir. Med., 2016, 10(1), 1-3. doi: 10.1586/17476348.2016.1121103.
CrossRef - Kaufmann, P.; Okubo, K.; Bruderer, S.; Mant, T.; Yamada, T.; Dingemanse, J.; Mukai, H., Am. J. Cardiovasc. Drugs, 2015, 15(3), 195-203.
CrossRef - Snigdha, D. Int. J. Phar. Biol. Sc., 2017, 7(4), 84-92.
- Razeq, S.A.; Alarfaj, N.A. Eg. J. Anal. Che., 2008, 17, 85-97.
- Raja, G.V.; Gopal, G.V.; Mounika, V.; Satyavathi, S.; Lavanya, C. I. J. Pharma Scie. Res., 2010, 1(2), 90-94.
- Kumari, K.R.; Rao, G.D. I. J. Pha. Res. Dev., 2010, 2(1), 1-5.
- Rao, L.V.; Ramu, G. ; Kumar, M.S.; Rambabu, C. I. J. PharmTech Res., 2012, 4(3), 957-962.
- J. Rose, Advanced Physio-Chemical Experiments, Pitman Publishers, London, 1964.
- Alarfaj, N.A.; Altamimi, S.A.; Almarshady, L.J. Asian J. Chem., 2009, 21(1), 217-226.
- P.D. Sethi, HPLC quantitative analysis of pharmaceutical formulations, CBS publications, India, 2001.
- ICH guidelines, Validation of Analytical Procedures: Text and Methodology, Q2 (R1), 8-13 2015.
- Kiran Kumar, K.; Venkata Nadh, R.; Nagoji, K.E.V. Oriental J. Chem. 2013, 29(1), 263-269. DOI:10.13005/ojc/290142.
CrossRef - Sudhir, M.S.; Venkata Nadh, R.; Oriental J. Chem. 2013, 29(4), 1507-1514. DOI:10.13005/ojc/290429.
CrossRef - Kiran Kumar, K.; Venkata Nadh, R.; Nagoji, K.E.V. Oriental J. Chem. 2014, 30(2), 905-910. DOI:10.13005/ojc/300272.
CrossRef
Accepted on: 24-11-2018


![]()


