Optimized Phosphate Recovery Through MAP Precipitation in an Air Agitated Column Reactor
L. Edahwati1 , S.Sutiyono1, S. Muryanto2, J. Jamari3 and A. P. Bayuseno3
1Department of Chemical Engineering, Universitas Pembangunan National “Veteran” Jawa Timur, Indonesia.
2Department of Chemical Engineering, UNTAG University in Semarang, Bendhan Dhuwur Campus, Semarang 50233, Indonesia.
3Department of Mechanical Engineering, Diponegoro University, Tembalang Campus, Semarang, Indonesia.
Corresponding Author E-mail: edahwatiluluk@yahoo.com
DOI : http://dx.doi.org/10.13005/ojc/340646
Article Received on : 05-01-2018
Article Accepted on : 30-04-2018
Article Published : 12 Dec 2018
In this work, the experimental design methodology was applied to optimize phosphate recovery percentage occurred in an air agitated column reactor from an aqueous solution containing MAP (magnesium, ammonium, and phosphate) ions. The reactor has three feed ports for fluid intake, while pH solution (8, 9 and 10) was examined to control the levels of supersaturation. The precipitated salts were subjected to characterization through different chemical techniques confirming the presence of high purity of struvite with impurity of sylvite as a mixed slow release fertilizer. Independent variables (pH and the fluid intake rate) in experimental design were used to model and optimize the operating parameters. The optimum operating conditions were quite efficient in trapping 38.02 % recovered phosphorus in synthetic solution at pH of 8-10, and fluid intake rate of 30.81 ml/min. Therefore, these optimized conditions could be valuable input data for engineering design-software for successive equipment required in wastewater treatment plant.
KEYWORDS:Air Agitated Column Reactor; Fluid Intake Rate; MAP Precipitation; Struvite; Surface Response Methodology (SRM)
Download this article as:| Copy the following to cite this article: Edahwati L, Sutiyono S, Muryanto S, Jamari J, Bayuseno A. P. Optimized Phosphate Recovery Through MAP Precipitation in an Air Agitated Column Reactor. Orient J Chem 2018;34(6). |
| Copy the following to cite this URL: Edahwati L, Sutiyono S, Muryanto S, Jamari J, Bayuseno A. P. Optimized Phosphate Recovery Through MAP Precipitation in an Air Agitated Column Reactor. Orient J Chem 2018;34(6). Available from: http://www.orientjchem.org/?p=53814 |
Introduction
MAP precipitation is a promising method for recovery of phosphorus and nutrients present in the wastewater, which in turn results in struvite (MgNH4PO4·6H2O). For instance, municipal/industrial/agricultural liquid wastes and manure leachates are rich in phosphate and ammonium ions, which are potential for use as resources in struvite crystal growth through MAP precipitation. Subsequently, the precipitated solid product may be utilized as a valuable mineral fertilizer.1
Struvite precipitation occurs within a reactor system related to nucleation and crystal growth process, of which depends on the supersaturated solution and can be tempted by the adjusting of Mg2+ ion concentration in a feeding solution and/or mean residence time of suspension and temperature.2 Moreover, the induced MAP precipitation by the addition of Mg ion source is the desired method for a sustainable water treatment. In this way, magnesium chloride (MgCl2) or Mg(OH)2 is typical for the low-cost magnesium sources for inducing MAP precipitation.3 Additionally, pH is a factor determining the supersaturated solution. When the pH solution is low (acidic solution), the solubility of struvite increases. Conversely, the increase in pH value leads to considerably decrease in the induction time of the nucleation process.4,5,6 However, struvite becomes highly insoluble in an alkaline pH environment. Consequently, the favorable precipitation of struvite occurs in supersaturated aqueous solutions of phosphate, magnesium, and ammonium ions within the pH range of 7-11 at room temperature (T = 298 OK).7,8
Further, mixing of the processed solution with agitation speed influences on hydrodynamic conditions which in turn results in significantly reducing the induction time by. In particular, micromixing and dissipation of kinetic energy of whirls within the system could intensify the ion diffusion processes. Correspondingly, struvite could be precipitated at a considerably higher rate compared to the process in a stagnant environment. This improved condition has been demonstrated in a DT-type (Draft Tube) reactor equipped with a propeller agitator, of which the selected process parameters: ionic reagent concentrations, pH, and average residence time of suspension influencing on the kinetics of the continuous process of struvite reaction-crystallization.9
Furthermore, the chemical composition of wastewater can control the final results of the struvite reaction crystallization process.8 Impurities, namely metal ions, sulfates, nitrates, carbonates may also control struvite crystallization in wastewater, which in turn plays a critical role in the nucleation and its crystal growth, shape and agglomeration, chemical composition of the final product in addition to co-precipitated sparingly soluble hydroxides or phosphates of the selected metal ions.10,11 Moreover, catalyst or chemical inhibitor of individual ionic impurities12 has a significant effect on the struvite reaction crystallization mode, which may change crystallized type and the operational parameters to be selected. Here, the change of reaction crystallization in the recovery of struvite due to the presence of calcium ions has been demonstrated in a batch crystallizer13 and in a continuous crystallizer.14,15 Correspondingly, reaction crystallization of struvite for recovery of phosphate ions from wastewaters is a complex technological challenge.16,17,18 This requires fully controlled conditions for struvite production and partly purifying wastewater systems,17 while desirable amounts of precipitated struvite can be recovered by typically control of the precipitating process in the reactor system.
Also, successful recovery of phosphate as mineral fertilizer in agriculture requires struvite crystals with prismatic or needle-like morphology, and the grain should be homogeneous in size and possibly large.19,20 The fertilizer product should not compose of the too large amount of impurities co-precipitated from the wastewater10. Additionally, the supersaturation control strategy and residence time are important variables influencing the recovery efficiency of phosphate in the reactor.9 In this way, multiple variables could be optimized using a response surface methodology (SRM) due to the availability of experimental design software, which has become now the most efficient way of modifying the experimentation. The SRM has been successfully applied to optimize crystallization processes of struvite in wastewater systems1 and this approach may also be suitable for an experimental design to optimize phosphorus recovery in the continuous airflow reactor.
The present research was undertaken to optimize phosphate recovery by SRM in the vertical column reactor. In this work, the central composite design (CCD) (various pH and fluid intake rate) was used for modeling and optimization of yield response of phosphorus recovered. The crystalline solid product was then characterized using XRPD Rietveld method for mineral composition and SEM-EDX for morphology and chemical element analysis, while the remaining phosphate ion in the filtrate was determined by x-ray fluorescence (XRF).
Materials and Methods
Solution Preparation and MAP Precipitation System
The reactor employed in the study consists of two zones, the reaction zone with working volume of 0.5 l; and the liquid-solid separation zone on the bottom of the conical reactor (Figure 1). Feed and sampling ports are located at the top and the bottom of the reactor, respectively. Double-distilled, deionized water was employed in all experiments. Analytical grade powder of ammonium hydroxide, potassium tri-hydrogen phosphates, and magnesium chloride were supplied from Merck, Germany. Here’s a stock solution containing NH4OH (0.706 M), H3PO4 (1.412 M), and MgCl2 (1.059 M) was prepared in each glass beaker with a volume of 500 ml to adjust the concentration of MAP to the equal molar ratio. Subsequently, the three stock solutions were filtered through 0.45 mm paper filter and kept at least 24 hours just prior to experiments.
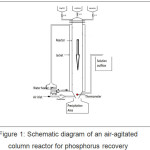 |
Figure 1: Schematic diagram of an air-agitated column reactor for phosphorus recovery. |
During the experiments, the three kinds of solutions were allowed to flow from each feed ports into the mixing chamber. The air was pumped from the bottom of the reactor at a flow rate of 0.25 ml/min for upward circulation of suspension in a mixing chamber. The feed rate of each intake solution was fixed at 16 ml/min; 20 ml/min; 25 ml/min; 30 ml/min; and 38 ml/min, respectively. The pH solution (8, 9 and 10) was adjusted by injection of 1 N KOH from the bottom mixed with air. The estimated retention time within the reactor was to be 13, 17, 20, 25, 31 minutes, while the reaction temperature was fixed at 30°C. In this study, pH was observed every 5-minute intervals. Then the crystalline solid was formed in the bottom of the reactor, whereas the liquid left from the conical part of the reactor owing to an overflow system. After the process completed, the precipitate was filtered off in a paper (Schleicher & Schuell no. 604), washed with distilled water and dried at room temperature for 48 hours. The filtrate liquid solution was subjected to analysis using XRF (x-ray fluorescence) instrument (Minipal 4; PAN Analytical) for remaining phosphorous ions.
Materials Characterization
The dried crystallization product was subsequently analyzed by XRPD Rietveld analysis for mineralogical phase composition. Initially, the dried samples were ground and placed in the Al-sample holder for the XRPD measurement. Subsequently, the measured XRPD data were collected by A Philips PW 1710 Diffractometer equipped with a Cu-tube radiation (λ= 1.542 Å) at 50 KV, 40 mA, and scanning speed of 0.02° sec.–1. The reflection peaks between 2θ = 5° and 90° were measured. Phase identification of crystalline sample was carried out by the computerized search-match of MATCH software equipped with PDF (Powder Diffraction File). The crystalline phases identified by the search match method were then justified by the Rietveld refinement method with Program Fullprof-2k, version 3.30.21 The Rietveld refinement was performed using the crystal structure model of a database (AMCSD-American mineralogist of crystal structure database). The full-width at half-maximum (FWHM) of XRPD peak profiles as a function of tan (θ) was refined by the Fullprof program using the u-v-w formula.22 Determination of the weight. % levels of mineralogical phases were performed using the refined cell parameters. Calculation procedures of the refinement have been discussed elsewhere.23
Furthermore, the precipitating solid was examined through SEM (scanning electron microscope) coupled with an energy dispersive X-ray analysis (SEM-EDX) for morphology and elemental analysis. For this measurement, the ground samples were then placed in the Al-sample holder and coated on the surface with carbon sputtering to provide electrical conductivity. The micrographs were taken with SEM (JEOL 5410) at 20 kV.
Mathematical Modeling of RSM Method
The RSM was employed in this study for modeling and creating a response of interest. This response consists of the experimental domain (D) and the target values.24 The first step in RSM was to find a suitable approximation of the true functional relationship between the value y and the set of independent variables (xi). Here a polynomial model could be generated using the established experimental design, i.e. sets of experimental conditions. The second-order model is commonly recommended because the first order model has the higher lack-of-fit. Here, the second order RSM model for the experimental response (y) is given in Equation 2.
yi = b0 + b1x1 + b2x2 + … + bkxk ++ b11x12 + b22x22 + … + bkkxk2 +
b12x1x2 + … + b1kx1xk + … + bk-1,k xk-1xk x1 (2)
Where xk+1,xk+2, …, xp are the cross-products and powers of the k factors; x1, x2…xk, are the codified factors. Moreover, the central composite design is commonly employed in SRM, while the researcher can select the most suitable one for approaching the optimization problem.
Results and Discussion
Properties of Solid Precipitated Crystals
The corresponding crystal solids were then subjected to XRPD search match method providing that the XRPD patterns of the precipitating solid with feed intake rate of 16 mlminute, accordingg to PDF#71-2089 for struvite; PDF#70-2345 for newberyite [MgHPO (×3H2O] and PDF#76-3368 for sylvite (KCl). The finding of minerals was subsequently confirmed by the full profile Rietveld refinement (Figure 2a). The peaks of phases had been overlapped in the search match or mistakenly assigned phases, which are shown to be clearly stand out in the difference plot of the calculated and the measured diffraction profile25. Accordingly, the intensity of most peaks could be well represented in the calculated diffractogram. In this analysis, the crystalline nature of the precipitates was shown and no significant amorphous phase could be seen from the XRPD background profile (Figure 2b).
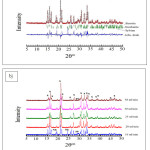 |
Figure 2a: XRPD Rietveld plot of solid crystal obtained from feed intake rate of 16 ml/minute; b) XRPD diffractogram obtained from precipitates with various feed intake rates. |
Upon XRPD quantitative analysis, the crystals are mainly composed of struvite and co-precipitated sylvite (KCl) during crystallization. In this case, the quantitative XRPD Rietveld analyses confirmed that struvite was precipitated as a major mineral (about 99 wt.%) with a small percentage of sylvite (<0.5 wt.%) in the precipitates.
Morphological features of the microcrystalline for MAP precipitate were examined by SEM (Fig. 3). The precipitated crystals were agglomerated, indicating the presence of struvite with small-sized crystals (about 100 mm), in which a prismatic like shape morphology was observed in the air-agitated reactor with feed intake rate of 16 ml/minute. Comparison of these micrographs indicates that the MAP precipitation with high feed intake rate (25 or 38 ml/minute) yielded in a large number of the crystal with big size (Figures 3b-c). The micrograph of microcrystalline shows at various grain structures observed with different feed intake rates. It seems that the induced crystallization for phosphorus recovery may also improve the crystal morphology and quality of crystallized products.
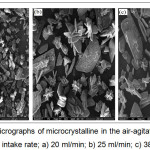 |
Figure 3: SEM micrographs of microcrystalline in the air-agitated crystallization column with feed intake rate; a) 20 ml/min; b) 25 ml/min; c) 38 ml/min. |
Predicted Model and Statistical Analysis
Model of response variables was optimized using SRM with the input data of CCD. In this study, the CCD was used to determine the optimum conditions for phosphorus recovery. The environmental factors investigated in the present study were varying pH and fluid intake rate. These factors were defined as X1, X2, X3 and X4 (Table 1), respectively. The rates of fluid intake, varying pH, and phosphorus recovery was measured and analyzed by the Statistica 6 software. The rate of phosphorus recovery was considered the responses (dependent variables) for the optimization. The whole design of yield response is presented in Table 2. The RSM analyses showed that phosphorus recovery significantly affected the pH and fluid rates. In the experiments, the phosphorus recovery was observed to be between 38 and 43 %. It was found that low pH and flow fluid intake rate led to high phosphorus recovery, while high pH and high fluid intake rate resulted in reduced phosphorus recovery. These results are in agreement with previous work1.
Table 1: Design of experiments with independent variables.
| pH(X1) | pH(X2) | pH(X3) | Fluid intake rate (ml/min)(X4) |
| 7.89 / A | 8.98 / F | 10.01 / K | 16 |
| 8.02 / B | 9.01 / G | 9.98 / L | 20 |
| 8.01 / C | 8.98 / H | 10.01 / M | 25 |
| 7.98 / D | 9.01 / I | 10.01 / N | 30 |
| 7.98 / E | 9.01 / J | 9.98 / O | 38 |
Table 2: The predicted results of the response.
| Run | pH (A-E) | pH (F-J) | pH (K-O) | Fluid intake rate (ml/min) | Response-P (%) |
| 1 | 7.89 | 8.98 | 9.98 | 16 | 42.13 |
| 2 | 7.89 | 8.98 | 9.98 | 38 | 38.13 |
| 3 | 7.89 | 8.98 | 10.01 | 16 | 38.00 |
| 4 | 7.89 | 8.98 | 10.01 | 38 | 42.35 |
| 5 | 7.89 | 9.01 | 9.98 | 16 | 41.00 |
| 6 | 7.89 | 9.01 | 9.98 | 38 | 38.90 |
| 7 | 7.89 | 9.01 | 10.01 | 16 | 38.75 |
| 8 | 7.89 | 9.01 | 10.01 | 38 | 41.19 |
| 9 | 8.02 | 8.98 | 9.98 | 16 | 38.36 |
| 10 | 8.02 | 8.98 | 9.98 | 38 | 40.13 |
| 11 | 8.02 | 8.98 | 10.01 | 16 | 38.11 |
| 12 | 8.02 | 8.98 | 10.01 | 38 | 40.19 |
| 13 | 8.02 | 9.01 | 9.98 | 16 | 39.02 |
| 14 | 8.02 | 9.01 | 9.98 | 38 | 38.82 |
| 15 | 8.02 | 9.01 | 10.01 | 16 | 38.32 |
| 16 | 8.02 | 9.01 | 10.01 | 38 | 38.52 |
| 17 | 7.82 | 8.99 | 9.99 | 27 | 41.19 |
| 18 | 8.08 | 8.99 | 9.99 | 27 | 38.36 |
| 19 | 7.95 | 8.96 | 9.99 | 27 | 40.13 |
| 20 | 7.95 | 9.02 | 9.99 | 27 | 38.11 |
| 21 | 7.95 | 8.99 | 9.96 | 27 | 40.19 |
| 22 | 7.95 | 8.99 | 10.02 | 27 | 40.19 |
| 23 | 7.95 | 8.99 | 9.99 | 5 | 39.02 |
| 24 | 7.95 | 8.99 | 9.99 | 49 | 38.82 |
| 25 | 7.95 | 8.99 | 9.99 | 27 | 38.51 |
| 26 | 7.95 | 8.99 | 9.99 | 27 | 38.51 |
The predicted results were also analyzed in chart Pareto (Figure 4). Upon the analysis, p-value less than 0.05 is regarded to have an insignificant effect on the response. It shows the signification of coefficients provided the higher signification level for b1, b2, and b3 which became the most affecting parameters, confirming adequate accuracy and general availability of the polynomial model. Moreover, pH (A-E) (X1) has a major linear (L) effect for controlling phosphorus recovery. However, the quadratic and linear effects of pH and fluid intake rate can be ignored because they provide insignificant factors on the yield response of phosphorus recovery.
To confirm this validity of the results was subjected to the analysis of variance (ANOVA). In the RSM, R2 value is considered to be significant if it should be above 0.60, and the larger the R2 the more statistically significant is the most developed model24. In the study, the R2 value obtained was 0.964 (Table 3) indicating that our statistical model can explain 96.4% of the variability in the response.
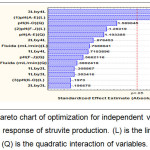 |
Figure 4: Pareto chart of optimization for independent variables on the yield response of struvite production. (L) is the linear and (Q) is the quadratic interaction of variables. |
Table 3: ANOVA (Analysis of Variance) for the response of phosphorus recovery- P (%).
| Source | Sum of | Degree | Mean | F-value | F-table | R2 |
| Squares | of Freedom | Square | ||||
| S.S. Regression | 30.4748 | 14 | 30.4748 | 25.14924 | 3.05 | 0.964 |
| S.S. Error | 13.3293 | 11 | 1.21176 | |||
| S.S. Total | 43.8041 | 25 |
Furthermore, multiple regression analyses were performed, and it was shown that the fluid intake rate factors not only have insignificant linear interactions with the response but also have quadratic effects. Only pH (A-E) has significant linear interaction with the response. Thus, an inverse polynomial equation was fitted to the results of the CCD. The regression equation predicted by the software was presented below:
P (%)- Y = 210990.79011 + 439.257X1 + 74.423X12 – 8810.1665X2 + 663.0555X22 -34495.154X3 + 1860.83328X32 – 40.575X4 + 0.00083X42 – 87.1794X1X2 – 85.641X1X3 + 0.27535X1X4 -240.55558X2X3 – 1.46515X2X4 + 5.15606X3X4
In which X1 = pH (A-E), X2 = pH (F-J), X3 = pH (K-O), and X4 = fluid intake rate (ml/min).
Optimization of Independent Variables for the Optimum Phosphorus Recovery
The graphical results of interactive independent and dependent variables are presented by 3D contour plots, which enable us to determine the optimum phosphorus recovery (P %). The mutual effects of factors, pH, and fluid intake rate are represented in Figs. 5-7. The results suggest that the high phosphorus recovery can be achieved if the pH and the feed intake rate in the mixing chamber are set at the lower values.
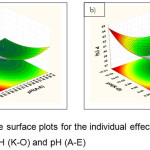 |
Figure 5: Response surface plots for the individual effects of a) pH (F-J) and pH (A-E); b) pH (K-O) and pH (A-E).Click here to View figure |
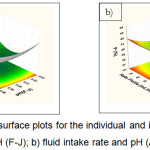 |
Figure 6: Response surface plots for the individual and interactive effects of a) pH (K-O) and pH (F-J); b) fluid intake rate and pH (A-E).Click here to View figure |
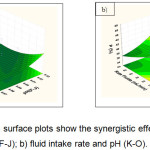 |
Figure 7: Response surface plots show the synergistic effects of a) fluid intake rate and pH (F-J); b) fluid intake rate and pH (K-O).Click here to View figure |
Figure 5a shows the individual effect between pH (F-J) and pH (A-E) for the production of phosphorus recovery. As expected, the increased yield of phosphorus recovery occurred at the lowest pH (7). However, the increased pH of the solution made the increased phosphorus recovery (Fig.5b). Additionally, Figure 6a presents the individual effects of pH (K-O) and pH (F-J) on the yield of phosphorus recovery. When increasing the pH value were reached about 10, the higher percentage of phosphorus could be obtained. In contrast, the synergistic effects of fluid intake rate and pH (A-E) show the decreased pH to the value of about 7 leading to the increased recovery of phosphorus (Fig 6b). Moreover, when increasing at the fluid intake rate followed by the decreased pH, leads to increases in phosphorus recovery (Fig 7a,b).
Table 4 summarizes the application of RSM (Response Surface Methodology) yielded the following regression equation which was an empirical relationship between % (Y1) recovered from the synthetic solution and the test variables in coded units. It is shown that the optimum conditions were quite efficient to trap 38.02 % recovered phosphorus in synthetic solution at varying pH of 8.02, 9.02, and 9.99, and fluid intake rate of 30.81 ml/min, the temperature of 30 °C. The dependence of phosphorus recovery was very clear through the validated model to be highly influenced by fluid intake rate and pH of the medium. For the fourth parameter, pH between reactants was automatically adjusted to the center point of study range using applied software for model validation.
Table 4: Four factors tested after optimization and the optimized phosphorus recovery.
| Factor | Optimized | P (%) optimized |
| pH (A-E) | 8.02 | 38.02 |
| pH (F-J) | 9.02 | |
| pH (K-O) | 9.99 | |
| Fluid intake rate (ml/min) | 30.81 |
Conclusions
The optimum values of pH and the fluid intake rate were investigated using the RSM to maximize phosphorus recovery. The results demonstrated that the phosphorus recovery in term of struvite precipitation requires the medium pH (8-9), and the high fluid intake rate. Furthermore, it was shown that the struvite precipitation is directly related to phosphorus recovery as previously suggested. The RSM was shown to be a robust method for phosphate studies to determine confluent effects of environmental variables and determine the optimum conditions not only for growth but also for the struvite production.
Acknowledgments
The authors express their gratitude to the Universitas Pembangunan National “Veteran” Surabaya, East Java, Indonesia for providing this PhD research project.
References
- Shalaby, M.S.; El-Rafie, Sh.; Hamzaoui, A.H.; M’nif, A. Chem. Biochem. Eng. Q. 2015, 29, 35-46.
CrossRef - Muryanto, S.; Bayuseno, A.P. Powder Technol. 2014, 253, 602-607.
CrossRef - Peng, C.; Chai, L-Y.; Tang, C-J.; Min Ali, X-B. M.; Song, Y-X.;Qi, W-M. J. Chem. Technol. Biotechnol. 2017, 92, 325-333.
CrossRef - Bouropoulos, N. C.; Koutsoukos, P. G. J. Cryst. Growth. 2000, 213, 381-388.
CrossRef - Kofina, A. N.; Koutsoukos, P. G. Cryst. Growth Des. 2005, 5, 489-496.
CrossRef - Le Corre, K. S.; Valsami-Jones, E., Hobbs, P.; Parsons, S. A. Environ. Technol. 2007, 28, 1245-1256.
CrossRef - Doyle, J.D.; Parsons S.A. Water Res. 2002, 36, 3925-3940.
CrossRef - Bhuiyan, M. I. H.; Mavinic, D. S.; Beckie, R. D. Environ. Technol. 2007, 28, 1015-1026.
CrossRef - Kozik, A.; Hutnik, N.; Piotrowski, K.; Matynia, A. Chem. Eng. Res. Des. 2014, 92, 481-490.
CrossRef - Hutnik, N.; Kozik, A.; Mazienczuk, A.; Piotrowski, K.; Wierzbowska, B.; Matynia, A. Water Res. 2013, 47, 3635-3643.
CrossRef - Perwitasari, D.S.; Edahwati, L.; Sutiyono, S.; Muryanto, S.; Jamari, J.; Bayuseno. A. P. Environ. Technol. 2017, 38, 2844-2855.
CrossRef - Hutnik, N.; Piotrowski, K.; Wierzbowska, B.; Matynia, A. Cryst. Res. Technol. 2011, 46, 443-449.
CrossRef - Le Corre, K. S; Valsami-Jones, E.; Hobbs, P.; Parsons, S. A. J. Cryst. Growth. 2005, 283, 514-522.
CrossRef - Barakat, M.A. Arabian J. Chem. 2011, 4, 361-377.
CrossRef - Koralewska, J.; Piotrowski, K.; Wierzbowska, B.; Matynia, A. Chem. Eng. Technol. 2007, 30, 1576–1583.
CrossRef - Doyle, J. D.; Parsons, S. A. Wat. Sci. Tech. 2004, 49, 177-182.
- Wang, H.; Wang, X-J.; Wang, W-S.; Yan, X-B.; Xia, P.; Chen, J.; Zhao. J-F. J. Chem. Technol. Biotechnol. 2016, 91, 3045-3052.
CrossRef - Rahman, M. M.; Salleh, M. A. M.; Rashid, K.; Ahsan, A.; Hossain, M. M.; Ra, C. S. Arab J. Chem. 2014, 7, 139-155.
CrossRef - de-Bashan, L. E.; Bashan, Y. Water Research, 2004, 38, 4222-4246.
CrossRef - Latifian, M.; Liu, J.; Mattiasson, B. Environ. Technol. 2012, 33, 2691-2697.
CrossRef - Rodriguez-Carvajal, J. Program Fullprof 2k, version 3.30, Laboratoire Leon Brillouin, France, June 2005.
- Caglioti, G.; Paoletti, A.; Ricci, F.P. Nucl. Instrum. 1958, 35, 223-228
CrossRef - Mahieux, P.-Y.; Aubert, J.-E.; Cyr, M.; Coutand, M.; Husson, B. Waste Manage. 2010, 30, 378-388.
CrossRef - Montgomery, D.C.R., Hubele, C.G.N.F., 2011. Engineering Statistics, 5th ed. John Wiley & Sons, Inc., New Jersey.
- Rietveld, H.M. J. Appl. Crystallogr. 1969, 2, 65-71.
CrossRef

This work is licensed under a Creative Commons Attribution 4.0 International License.
![]()
A New Edition of Web of Science
Journal Impact Factor
2022: 0.5
Five Year: 0.8
Journal is Indexed in

Cabells Whitelist
![]()


