Operational Aspects of Silicon Oxidereduction Process and Their Effects on the Material and Thermal Flows Balance in Carbothermic Reactors
Nikolay Nikolayevich Zobnin , Gleb Vladimirovich Mandryukov and Ainur Abzelovna Kuzembaeva
Asyl Bolatovich Kusainov, Tau-KenTemir LLP, Kazakhstan, Karaganda, 100018, Oktyabrsky district, the accounting quarter 018, building 133, Chemical and Metallurgical Institute, Karaganda, 100009, Kazakhstan, Yermekova street, 63, Karaganda State Industrial University, Kazakhstan, Temirtau, 101400, Republic Avenue, 30, Kazakhstan.
Corresponding Author E-mail: zobninnn@mail.ru
DOI : http://dx.doi.org/10.13005/ojc/340651
Article Received on : 03-05-2018
Article Accepted on : 01-11-2018
Article Published : 17 Nov 2018
The article deals with the influence of operational aspects on the performance of the reduction process in reactors with submerged electrical arc. Experiments were conducted in the large-scale laboratory conditions in one-electrode furnace with a capacity of 200 kVA at Chemical and Metallurgical Institute (Karaganda, Kazakhstan). Also limited industrial research in the furnace with the capacity of 30 MVA at LLP ‘Tau-KenTemir’ was conducted.In the process of the research, evidence was achieved that increasing the interval between the furnace top treatments up to 30 minutes, and achieving a balance between the material and thermal flows in a reactor allow increasing silicon yieldup to 10-15% minimum. Fluctuations in the phase currentstabilize. It was proved that on the basis of the concept of balancing it is possible to bringan industrial reactor out of complex crisis statesrather quickly.
KEYWORDS:Current Distribution; Loading; Operating; Silicon; Thermal and Material Balance
Download this article as:| Copy the following to cite this article: Zobnin N. N, Mandryukov G. V, Kuzembaeva A. A. Operational Aspects of Silicon Oxidereduction Process and Their Effects on the Material and Thermal Flows Balance in Carbothermic Reactors. Orient J Chem 2018;34(6). |
| Copy the following to cite this URL: Zobnin N. N, Mandryukov G. V, Kuzembaeva A. A. Operational Aspects of Silicon Oxidereduction Process and Their Effects on the Material and Thermal Flows Balance in Carbothermic Reactors. Orient J Chem 2018;34(6). Available from: http://www.orientjchem.org/?p=52733 |
Introduction
The problem of improving technical siliconproduction remains acute. Positive results1,2,5 have been achieved. Often, however, the results are not stable. Stability is determined by the operation electrical mode of carbothermic reactor for siliconreduction or silicon smelting furnace. The size of current, proceeding through each electrode, is important. However, it is also important how the current size will change with time. An example of a diagram of phase current at the silicon production FESIL RANA Metal AS is presented in Figure 1.2 In the ideal conditions of silicon smelting process, phase amperage must be constant. In reality, however, it is not possible. Changes in the current are defined by operational aspects. The most important aspects are the modes of charge materials loading and furnace top processing. Feeding the furnace with raw materials is made by a circular pattern. At the first stage, fresh raw materials are fed into the furnace top.They stay on the top of the furnace for some time without moving.
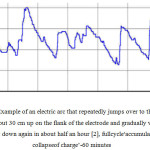 |
Figure 1: Example of an electric arc that repeatedly jumps over to the cavity wall about 30 cm up on the flank of the electrode and gradually works its way down again in about half an hour,2 fullcycle‘ accumulation- collapse of charge’-60 minutes. |
They are heating while moisture and volatiles are being removed. Mean while the fresh charge is supported by the layer of baked into the monolith raw materials. This monolith forms a cover of the gas cavity, shown in Figure 2. At the bottom of the cavity there are thermally prepared materials that fell there in the previous period. This period is called ‘accumulation’. At the bottom of the cavity reduction processes with liquid silicon accumulation occur. At this period the volume of the cavity increases. An electric arc is moved from the flank of the electrode down onto the bottom part. The main part of the current goes through the liquid melt but not through the solid wall of the cavity. Electric resistance of the smelting bath decreases. This leads to a gradual increase in current from minimum to maximum values shown in Figure 1. At the end of the accumulation process, the baked layer below the fresh charge partially melts and flows down. Fresh charge during this time manages to heat up, lose moisture and volatiles. Thickness of the baked layer at the top of the cavity is reduced, and a new portion of charge begins to fail into the cavity due to its own weight. This period is called the ‘collapse’ of the charge. The new portion of raw materials at the bottom of the cavity cools the melt down, reduces its electrical conductivity. Amperage arc in the lower part of the electrode is reduced. There is a redistribution of current towards increase in current of a flank arch (flank current). As electrical resistance of the smelting bath grows, the current slowly begins to fall. As seen from the diagram in Figure 1, the periods of accumulation and collapse last for about 30 minutes each. However, there are anomalies.So, after the end of the collapse at around 10:15, there has been a dramatic increase in current within 5 minutes period, figure 1. Such drastic changes are not desirable.Cycles are broken, power consumption increases and silicon yield decreases. This could be explained in different ways. This is partly due of the operator of the carbothermic reactor. An operator carries out the reactor feeding. Then, with a special machine, raw materials are distributed on the surface, Figure 3.
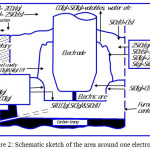 |
Figure 2: Schematic sketch of the area around one electrode. |
The figure is based on a drawing by Schei, Tveit and Tuset.1
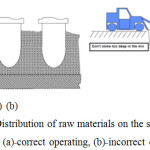 |
Figure 3: Distribution of raw materials on the surface of the reactor, (a)-correct operating, (b)-incorrect operating. |
If the operator immerses working machine into the reactor too deeply, he destroys the walls of the cavity. The composition of the wall includes silicon carbide. This material has a low electric resistance. When carbide falls onto the bottom of the cavity, amperage increases quickly. This occurs due to low resistance of silicon carbide. A similar effect of carbides on the distribution of current (flank and bottom) is described in literature.3,7 This is a negative point. The mechanism of the process is changing. Carbide in good condition is a collector of gaseous silicon monoxide. Reaction 1 is taking place. Reaction 2 takes place in case of the carbide fall onto the bottom of the cavity,6 When silicon carbide ends in a wall cavity, then silicon monoxide starts to be taken out by the off-gas from the reactor. Silicon yield decreases.
SiC (s) + SiO (g) = 2Si (l) + CO (g) (1)
2SiC (s) + SiO2(l) = 3Si(l) + 2CO (g) (2)
In addition, charge at the top of the reactor has no time to heat and falls down into a cavity too early. Cold charge reduces the temperature at the bottom of the cavity and is mixed with liquid products. At the bottom of the cavity, magmatic swamp with high baked layer formed. In the process of liquid silicon tapping, this magma overlaps the outlet and does not let the liquid silicon flow out. Highly viscous magma has to be retrieved through the tapping hole with hand tools. Figure 4 presents an example of such materials taken out through the tapping hole.
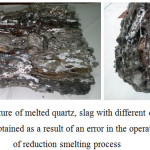 |
Figure 4: Igneous mixture of melted quartz, slag with different content of residual silicon oxide, obtained as a result of an error in the operational mode of reduction smelting process. |
Igneous mixture is in the shape of a cylinder with a diameter of 100-150 mm and a length of 3-4 meters with transverse incisions from hand tools.
In case of bad skills of carbothermic reactor operators, errors, mentioned above, amplify. Trying to expedite the process, the operator gives furnace charge more often and produces intensive tilling of raw materials in the upper part of the body of the reactor. He plunges the working part of the processing machine deep into the charge. As a result, the current diagram takes the form presented in Figure 5. This diagram is obtained in the context of LLP ‘Tau-Ken Temir’. This enterprise and its furnaces were described in our previous article.10 As can be seen from Figure 5, phase current is not very stable. Partially these effects are explained by phase transformation processes of quartz into its modification-cristobalite, and physical processes of softening and melting of quartz.4,9 From the position of physical modeling, the cyclical nature of current distribution on the flank and bottom surface is described by the authors.7 However, one must correlate process model and practical operating.
Intensive furnace charge loosening leads to an imbalance between material and heat flows in the reactor. By reducing the cavity volume, an illusion appears in the need to give the next portion of furnace charge into the reactor. The operator’s actions are based on the subjective assessment of the needs of the reactor feeding.The quantity of charge forcibly fed into the reactor is not provided with energy.
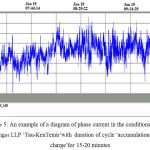 |
Figure 5: An example of a diagram of phase current in the conditions of wrong operatingat LLP ‘Tau-Ken Temir’ with duration of cycle ‘accumulation-collapse of charge’for 15-20 minutes. |
The importance of accurate exergetic balancing was described by the authors.8 However, this technique should also be associated with the operator’s actions.One needs to download the raw materials per unit of time, consistent with the consumption of electricity over the same length of the previous period. If there is a shortage of energy, the reaction cannot be completed. The reaction stops at the stage of formation of silicon monoxide. Partly it explains the increased formation of micro silica in the context of LLP ‘Tau-Ken Temir’-1 t/t Si.
It is also important to tap liquid silicon not at any random moment, but at the end of 1-2 cycles ‘collapse of charge –accumulation’,at the moment of accumulation completion with a maximum phase current. If silicon tapping occurs during the collapse, then the charge, fallen on to the bottom of the cavity, will prevent tapping.
Not all experts in this field believe that such an approach to the operating carbothermic reactors with submerged arc for silicon production is correct. This article is aimed to prove the correctness of the point of view described above.
Material and Method
At the initial stage, studying of the features of operating was conducted in a large-scale laboratory electric arc furnace with a capacity of 200 kW at the Chemical and Metallurgical Institute (Karaganda, Kazakhstan). The main raw material used for the research was Sarykul deposit quartz. Chemical, granulometric composition of raw materials and carbon reducing agents were presented in our previous work.10
Two-electrodeelectric furnace with one electrode coked in the bottom with hearth mass (Figure 6), i.e. electric furnace has a structure similar to the furnaces of ‘Miguet’ type. Transformer power voltage is 380 V. Furnace feeding was carried out from two transformers OSU-100/0.5 connected in parallel.
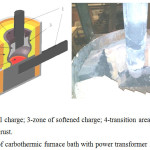 |
Figure 6: Structure of carbothermic furnace bath with power transformer 200 kVA. |
Temperature of the electric arc 2500-4500oC is provided by graphite electrode with a diameter of 150 mm. The furnace is lined with fireclay brick. The furnace bath is round with diameter 40 cm (Figure 6). The distance from the electrodes to the tap unit is 21-22 cm; to the back wall of the furnace is 29-30 cm. The bath depth is 40 cm. Hearth bottom up to the level of tap hole is baked from electrode mass subjected to coking during 12 hours under current with periodic disconnection of the furnace. Moving electrode is carried out manually. The furnace is equipped with an electric meter, connected through a current transformer 400/5 (with coefficient of 80). There are also instruments for measuring the secondary and primary current and also secondary voltage. Current change limits at low voltage side are 0-4000 A, voltage at low voltage side is 0-50V. Silicon tapping is through the tapping hole, which is closed and opened with a wooden pole. There is a possibility of secondary voltage step changing. The furnace transformer has four steps: 18.4; 24.5; 36.8 in and 49.0 in. The voltage reduction in the furnace is about 4-8 V depending on voltage levels. Greater fall comes at high levels.
Basic electrical characteristics of the carbothermic electric power transformer of 200 kVA are shown in table 1.Before the research start, the carbothermic furnace was prepared for electro smelting. The furnace was being heated for 12 hours on a coke cushion used as a conductor of electric current and to save the bottom.
Table 1: Nominal electric characteristics of transformer 100/0-OSU, 5х2 with total capacity 200 kVA.
|
Power, kVA |
Highvoltage side |
Low voltage side |
||||||
|
Electric exits |
U,B |
I,A |
Connections |
Electric exits |
U,B |
I,A |
Connections |
|
|
200 |
AX |
380 |
526 |
x-(a)1, x-a |
x3-a |
49.0 |
4070 |
– |
|
150 |
AX |
380 |
395 |
x-a x2-a |
x3-a |
36.8 |
4070 |
a3-x4 |
|
100 |
AX |
380 |
263 |
(a)1-x1 |
x3-a |
24.5 |
4070 |
x1-a,2 |
|
75 |
AX |
380 |
197.6 |
a2-x2 |
x3-a |
18.4 |
4070 |
a4-x2 |
On completion of the period of heating the furnace was completely cleared from the coke residue. Electric mode of the heating period: secondary voltage 24.6; amperage from the side of high voltage – 150-200.
The furnace started heating on December 2, 2017 at 20:00. On December,4 at 3:00 the first portion of silicon was tapped. Next tappings took place every two hours. From that point, excess reducing agent was optimized at the level 15-25% and actual research started. Counting of gained silicon and working mixture used for its production started since the second tapping.
In large-scale laboratory terms, the influence of characteristics of operating aspects on the process indicators was studied. The time between the top processing operations and their intensity were varied. Silicon yield was also observed. The study was conducted in two phases. In the first phase for 14 hours smelting was led in the mode of constant processing of the top, and new portions of the charge were loaded with minor interruptions in this process. Cavities were deliberately pierced, and new portions of charge were loaded into the holes. Such is the typical process at LLP ‘Tau-Ken Temir’. After reviewing the interim results, it was decided to proceed to the second mode. In this mode the exposure time between the top treatments was 30 minutes. There, changing the structure of the cavities occurred only naturally. The duration of the second phase was 65.5 hours.
After the completion of the large-scale laboratory studies,limited industrial research was made in the conditions of LLP ‘Tau-Ken Temir’ using the equipment, which we previously used.10
The technique of achieving a balance between material and thermal flows in industrial reactor in the conditions of LLP ‘Tau-Ken Temir’ was the following. Control devices were used to determine the amount of electricity consumed by the furnace during the reporting period, e.g. every hour (reading). The reading per hour was 19.5 Mw × h active power. Hence the raw material consumption per elementary silicon should be-19.5/12.5 = 1.56 t/h. Here, 12.5 Mw ×h/t-conventional energy consumption for 1 ton of technical silicon (solid) product according to literature data.1,2,5 Per silicon dioxide it will reach 1.56 × 60/28 = 3.3428 t/h. In terms of LLP ‘Tau-Ken Temir’ it is accepted to account consumed charge in weighed portions. Weighed portion is the charge portion of a specific composition. Usual weight is 1100-1200 kg. The amount of quartz in the weighed portion is always fixed-600 kg (0.6 tonnes). So, the number of the weighed portions should be 3.3428/0.6 = 5.57 weighed portions per hour. In weight it would be 5.57 × 1.15 = 6.4 t of charge per hour. Available control system makes it impossible to take into account the amount of charge that is loaded for the specified period of time. Therefore, to take account of and maintain a fixed charge flow, the following method was used. The charge was loaded approximately 2 times per hour to reach the cycle presented in Figure 1. Thus, for one upload we should put into the furnace reactor-6.4/2 = 3.2 t of charge. The charge is loaded evenly out of the six furnace dosing bins. Each dosing bin-3.2/6 = 0.53 tonnes. The control of furnace dosing bin has the property of discreteness. Pressing the control button gives a fixed amount of charge. For our conditions it is approximately 0.25 t. In each particular case, this value must be determined experimentally. It means feeding a charge out of each dosing bin, the operator must press the button no oftener than 0.53/0.25 » 2 times.The amount of charge can be increased by about 20%, taking into account the possible silicon yield of 80%. The key moment here is the human factor. The operator shall not charge the reactor more than calculation allows. Even if subjectively it seems to him that this is not enough. The art of the operator is to allocate the estimated amount of charge so that to cover evenly the entire top and prevent the development of local gas emissions. The technologist must watch the readings hourly and make adjustments of the amount of loaded charge if there are changes in the active power consumption.
In real,it was not always possible to observe a 30-minute interval between the treatments of the top. Besides, different operators act in different ways in the course of processing. Someone is conducting this operation faster, someone slower. In this regard, industrial conditions used a special figure– intensity of the top treatment – Ik. Under this definition we mean the ratio of the time spent on the top treatment to the total processing time and the time to wait between treatments. The figure was evaluated in the process of work every hour.
Not always the importance of balanced charge loading was understood by each operator. It could be explained by a lack of experience of the operators. In this connection, at certain periods of time, the furnace was charged either more or less than the norm. To assess the balance of loading, we used the notion of ‘excess charge’ in relation to the needs in the charge at the current furnace capacity. Let’s take this value as a ratio between actually uploaded into the furnace weighed portions to calculated ones. This value is also counted every hour. Silicon yield was calculated by weight of solid technical silicon after the refining stage.
Results and Discussion
Raw material consumption and silicon output obtained during the research in the furnace with the capacity of 200 kVA are presented in table 2, where Consumed for a stage – (CS, kg)Consumption norm–(CN, t/t).
Table 2: The raw material consumption and silicon output obtained during the research in the furnace with a capacity of 200 kVA.
|
Smelting campaigns |
Stone coal |
Charcoal |
Quartz |
Spec. coke |
Woodchips |
Silicon, kg |
|
|
The first stage |
(CS, kg) |
45 |
35 |
90 |
13 |
5 |
28 |
|
(CN, t/t) |
1.61 |
1.25 |
3.21 |
0.18 |
0.46 |
||
|
The second stage |
(CS, kg) |
134 |
128 |
340 |
8 |
46 |
126 |
|
(CN, t/t) |
1.06 |
1.02 |
2.70 |
0.06 |
0.37 |
||
Asseen from the results presented in table 2,changing the operating modes of the to pand charging have significantly reduced the consumption norms. So, quartz consumption amounted to 2.7 t/t of silicon and approached the indicators derived from the production of silicon in Norway-2.5 t/t.1,2 The size of phase current has stabilized considerably. The cavity had a big and constant volume. Silicon tapping occurred without obstacles.
There were also counted the most important technological parameters: silicon yield – (XSi, %); the amount of energy spent for a stage reading– (R, kW×h); specific energy consumption for one kg of silicon (Wt,kW×h/kg);average active power of the furnace – (Pa, kW); furnace productivity – (G, kg/h); power per unit of the furnace bottom area -(WS, kW/m2). These indicators are presented in table 3.
Table 3: Main technological parameters of technical silicon smelting during the study.
|
Stage |
(R, kW×h) |
(Pa, kW) |
(Wt, kW×h/kg) |
(XSi, %) |
(G, kg/h) |
(WS,kW/m2) |
|
The first stage |
1096 |
78,2 |
39,14 |
63.62 |
2.00 |
622.6 |
|
The second stage |
5112 |
78, 0 |
40,50 |
78.07 |
1.92 |
621.0 |
As can be seen from table 3, by modifying the way of operating, ongoing in the reduction process, silicon yield increases significantly. But the power and productivity don’t increase as well as in.2 This may be due to a short duration of the experiment. In case of longer duration of the experience, you can expect other positive changes. In addition, at the second stage of the experiment, there occurred a number of technical problems, not technology-related. These problems could partially distort the results.Calculation of the yield of silica, iron, aluminum and calcium out of charge in technical silicon alloy with other elements is presented in tables 5 and 6 in the form of balance of the process of reduction smelting on the first and second stages of the research. In table 4 the weight calculation is presented for each of the above mentioned elements that passed into technical silicon at the first stage of the study. These data were used in the calculation of material balance. As can be seen from the results, silicon yield is justified and considers technical weight of silicon at each stage and its chemical composition. The results are also confirmed by the coincidence of balance process for iron, which, according to the literature, fully goes into the silicon smelt. Conducted experiments prove this statement here. There is no complete certainty in part of aluminum and calcium yield.
Table 4: Calculation of the weight of iron, aluminum, calcium, silicon, passed into technical silicon during the reduction process.
|
Tapping No. |
Technical silicon, kg |
Fe |
Al |
Ca |
Si |
||||
|
% |
kg |
% |
kg |
% |
kg |
% |
kg |
||
|
2 |
2.2 |
3.03 |
0.066 |
3.99 |
0.087 |
0.12 |
0.002 |
92.36 |
2.031 |
|
3 |
4.3 |
2.4 |
0.103 |
3.66 |
0.157 |
0.21 |
0.009 |
93.28 |
4.011 |
|
4 |
2.2 |
2.57 |
0.056 |
3.8 |
0.083 |
0.23 |
0.005 |
92.96 |
2.045 |
|
5 |
0.8 |
2.67 |
0.021 |
2.97 |
0.023 |
0.2 |
0.001 |
93.68 |
0.749 |
|
6 |
3 |
2.77 |
0.083 |
2.48 |
0.074 |
0.16 |
0.004 |
94.27 |
2.828 |
|
7 |
4.7 |
2.7 |
0.126 |
3.21 |
0.150 |
0.26 |
0.012 |
93.49 |
4.394 |
|
8 |
6 |
2.17 |
0.130 |
3.6 |
0.216 |
0.3 |
0.018 |
93.61 |
5.616 |
|
9 |
4.9 |
1.1 |
0.121 |
3.93 |
0.192 |
0.31 |
0.015 |
92.9 |
4.552 |
|
the Sum |
28 |
0.709 |
0.986 |
0.068 |
26.228 |
||||
At the first stage, aluminum yield is 78%, and 46% at the second, while silicon yield increases. Aluminum yield at the first stage is close to the literary data-85%.5 Possibly, deviation at the second stage is due to variations in the chemical composition of quartz raw materials. This usually occurs due to changes in the proportion of alumina in the form of inclusions and clay impurities. Resolving this contradiction requires longer research. Calcium yield is relatively low, but stable-8-13%. This is somewhat less than commonly acceptable level-40-70%. However, this can be attributed to conducted minimization of carbon excess in the charge concerning the stoichiometry.
Table 5: Balance of the process of reduction smelting for iron, aluminum, calcium and silicon for the first stage of the research, where The weight of the charge – (Wch, kg).
|
Input |
(Wch, kg) |
Fe |
Al |
Ca |
Si |
|||||||||||||||||||||
|
% |
kg |
% |
kg |
% |
kg |
% |
kg |
|||||||||||||||||||
| Quartz |
90 |
0.65 |
0.59 |
1.14 |
1.03 |
0.50 |
0.45 |
44.88 |
40.39 |
|||||||||||||||||
| Stone coal |
45 |
0.19 |
0.09 |
0.44 |
0.20 |
0.16 |
0.07 |
1.71 |
0.77 |
|||||||||||||||||
| Wooden charcoal |
35.1 |
0.22 |
0.08 |
0.04 |
0.01 |
0.73 |
0.25 |
0.10 |
0.04 |
|||||||||||||||||
| SpecialCoke |
5.4 |
0.17 |
0.01 |
0.38 |
0.02 |
0.17 |
0.01 |
0.52 |
0.03 |
|||||||||||||||||
|
The sum |
0.76 |
1.26 |
0.79 |
41.22 |
||||||||||||||||||||||
|
Output |
Fe |
Al |
Ca |
Si |
||||||||||||||||||||||
|
kg |
XFe,% |
kg |
XAl,% |
kg |
XCa,% |
kg |
XSi,% |
|||||||||||||||||||
| Silicon | 0.71 | 93.86 | 0.99 | 78.09 | 0.07 | 8.71 | 26.23 |
63.62 |
||||||||||||||||||
Table 6: Balance of the process of reduction smelting for iron, aluminum, calcium and silicon at the second stage of the research,where The weight of the charge – (Wch, kg).
|
Input |
(Wch, kg) |
Fe |
Al |
Ca |
Si |
||||||||||||||||||||
|
% |
kg |
% |
kg |
% |
kg |
% |
kg |
||||||||||||||||||
| Quartz |
340.3 |
0.70 |
2.38 |
1.14 |
3.89 |
0.50 |
1.70 |
44.85 |
152.61 |
||||||||||||||||
| Stonecoal |
134.3 |
0.19 |
0.26 |
0.44 |
0.60 |
0.16 |
0.22 |
1.71 |
2.29 |
||||||||||||||||
| Wooden charcoal |
8.1 |
0.22 |
0.02 |
0.04 |
0.00 |
0.73 |
0.06 |
0.10 |
0.01 |
||||||||||||||||
| SpecialCoke |
18.7 |
0.17 |
0.03 |
0.38 |
0.07 |
0.17 |
0.03 |
0.52 |
0.10 |
||||||||||||||||
|
The sum |
2.69 |
4.56 |
2.01 |
155.01 |
|||||||||||||||||||||
|
Output |
Fe |
Al |
Ca |
Si |
|||||||||||||||||||||
|
kg |
XFe,% |
kg |
XAl,% |
kg |
XCa,% |
kg |
XSi,% |
||||||||||||||||||
|
Silicon |
2.67 |
99.28 |
2.14 |
46.86 |
0.28 |
13.94 |
121.01 |
78.07 |
|||||||||||||||||
In general, adequacy of the obtained results can be noted. Adequacy is confirmed by the fact that silicon yield at the first stage of the research coincides with the results obtained in conditions of LLP ‘Tau-Ken Temir’ at equal operational aspects.Basing on the results of the research conducted in the large-scale laboratory conditions, it was decided to try out new approaches to operating the process of reduction smelting of silicon in the industrial conditions. Research has been conducted in limited industrial conditions of LLP ‘Tau-Ken Temir’. The research results are presented in figure 7, 8, 9 and table 7. On the first day of the tests we did not intervene in existing operating process. Similar problems were observed by investigators7,8 with a negative distribution of the electric current in the cavity. As seen from the results of 26.12.17, currently used mode is characterized by great instability. Excess of charge can be 70-90%. The cavities are small. The furnace cannot gain full power due to regular collapses of not thermally prepared charge onto the bottom of the cavity. As a consequence there is heavy violation of technology and poor technical indices of the process. Silicon yield was severely hindered by heavy slag clots, Figure 4. The next two days (8 hours a day) there were attempts to restrain excess charge within 10-40%. Initially, the level of charge in the reactor declined significantly. However, later on, the cavitygained a stable frame. The top became tighter, less friable. The charge level got back to normal. The charge came down by itself without forced processing. Within two days the furnace has been led out of the crisis. But the research was stopped because of the disputes and disagreements between developers and specialists of LLP ‘Tau-Ken Temir’on the question of the effectiveness of further use of the balanced charge supply. Later on, operating was granted at the discretion of the operators, as it used to be before.
Table 7: Comparative analysis of different options of operating of the process of reduction smelting of technical silicon in terms of LLP ‘Tau-Ken Temir’, where Weighed portions – (Wp, pcs.); Technical silicon outcome – (TSO, kg); Readings of energy – (Re, Mw× h), silicon yield – (XSi, %).
|
Date |
Income |
(TSO, kg) |
(Re, Mw × h) |
Wt, kWh/kg |
XSi, % |
|
|
(Wp, pcs.) |
Quartz, tons |
|||||
| 26.12.2017 |
55.862 |
55.862 × 0.6 = 33.5172 |
6240 |
162.9 |
162.9/6.24 = 26.1 | 39.89 |
| 27.12.2017 |
58.313 |
58.3131 × 0.6 = 34.987 |
11140 |
174.7 |
174.7/6.24 = 15.68 | 68.22 |
| 28.12.2017 |
51.2054 |
51.2054 × 0.6 = 30.7232 |
10620 |
154.2 |
154.2/10.62 = 14.52 | 74.07 |
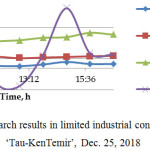 |
Figure 7: Research results in limited industrial conditions of LLP ‘Tau-KenTemir’, Dec. 25, 2018. |
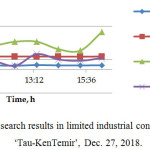 |
Figure 8: Research results in limited industrial conditions of LLP ‘Tau-Ken Temir’, Dec. 27, 2018. |
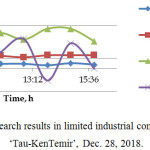 |
Figure 9: Research results in limited industrial conditions of LLP ‘Tau-Ken Temir’, Dec. 28, 2018. |
Conclusions
Basing on the research, we believe that it could be considered proven that operational aspects influence the reduction process indicators in submerged arcfurnaces. Increasing the interval between the top treatments to 30 minutes and achieving a balance between the material and thermal flows in a reactor allow increasing silicon yield up to 10-15% minimum. Fluctuations in the phase currentstabilize. Basing on the concept of balancing it is possible quickly to lead the industrial furnace out of difficult crisis conditions. It is necessary to study the question of harmonizing the top treatment and silicon tapping from the furnace. Promising is developing operating in which tapping of liquid silicon is made at the moment of accumulation completion using a maximum force of phase current. The authors are prepared to consider any variants of cooperation to further practical implementation of the new aspects of operating in the production of technical silicon.
Acknowledgements
The authors express their deep gratitude to the top management of JSC ‘NGK Tau-Ken Samruk’, which is the parent company in respect of LLP ‘Tau-Ken Temir’. Special thanks to the Chief Director of business development JSC ‘NGK Tau-Ken Samruk’ Arshabekov A.N. who supported the financing of the research within the framework of execution of the contract No. 04-02-437 dated November 10, 2017 on the theme: ‘Development of smelting technology of technical silicon using briquetted monocharge obtained from different types of low-cindery reductants and dust of gas cleaning (microsilica)’. We thank all the operators and employees of LLP ‘Tau-KenTemir’ and ChMI, who showed patience and understanding in carrying out this work and we hope to continue mutually beneficial cooperation.
References
- Schei A.; Tuset J. Kr.; TveitN., Production of high silicon alloys products. Tapir, Trondheim, Norway. 1998, 89-91.
- AndresenB., Operational aspects of the metallurgical silicon process. Silicon for the chemical and solar industry XIII, Kristiansand, Norway. June 13-16, 2016, 63-74.
- Tesfahunegn Y.; Magnusson T.; Tangstad M.; Saevarsdottir G., Effect of carbide configuration on the current distribution in submerged arc furnaces for silicon production-A modeling approach. Minerals, Metals and Materials Series, Part F3. 2018, 175-185.
- Ringdalen E.; Tangstad M., Softening and melting of SiO2, an important parameter for reactions with quartz in Si production. Advances in Molten Slags, Fluxes, and Salts: Proceedings of the 10th International Conference on Molten Slags, Fluxes and Salts. 2016, 43-51.
CrossRef - Tangstad M., Ferrosilicon and silicon technology. Handbook of ferroalloys. 2013, 179-220.
CrossRef - Ringdalen, E.; Tangstad M., Reaction mechanisms in carbothermic production of silicon, study of selected reactions. TMS Annual Meeting.2012,195-203.
CrossRef - SaevarsdottirG.; Bakken J.A., Current distribution in submerged arc furnaces for silicon metal/ferrosilicon production. Proceedings of the 12th International Ferroalloys Congress: Sustainable Future. 2010, 717-728.
- Borset M. T.; Kolbeinsen L.; Tveit H.; Kjelstrup S., Exergy efficiency based indicators for the silicon furnace. Energy. 2015,90, 1916-1921.
CrossRef - Ringdalen, E., Changes in quartz during heating and the possible effects on Si production. JOM. 2015, Volume67, Issue 2, 484-492.
CrossRef - Zobnin N. N.;Torgovets A. K.;Pikalova I. A.;YussupovaY. S.; AtakishiyevS. A., Influence of thermal stability of quartz and the particle size distribution of burden materials on the process of smelting of electrothermal metallurgical silicon. Oriental Journal of Chemistry. 2018, Vol. 34, no. (2), 1120-1125.

This work is licensed under a Creative Commons Attribution 4.0 International License.
![]()
A New Edition of Web of Science
Journal Impact Factor
2022: 0.5
Five Year: 0.8
Journal is Indexed in

Cabells Whitelist
![]()


