Novel Nickel (II), Copper (II) and Cobalt (II) Complexes of Schiff Bases A, D and E: Preparation, Identification, Analytical and Electrochemical Survey
 , Hanaa H. Hadadd and Baydaa H. Jaaz
Department of Chemistry, College of Science, University of Basrah, Basrah, Iraq.
Corresponding Author E-mail: alriyaheea@yahoo.com
DOI : http://dx.doi.org/10.13005/ojc/340632
Download this article as:
![]()
A novel set of Cobalt(II), Copper(II) and Nickel(II) complexes of ligands, (E)-2-(((2,5-difluorophenyl)imino) methyl)phenol (A), (E)-2,4-dibromo-1-((2-hydroxybenzylidene) amino)anthracene-9,10-dione (D) & (Z)-1-((1-([1,1'-biphenyl]-4-yl)-2-bromoethylidene) amino)-2,4-dibromo anthracene-9,10-dione (E) were synthesized and characterized. Their structures were investigated on the basis of CHN, conductance measurements and spectral studies (H1-NMR & C13-NMR,FT-infrared and Electronic spectroscopies), cyclic voltammetry. It has observed from spectral and analytical studies that metal complexes have the composition of (ML2.X2) and one mole of ligand behaves as bidentate chelating agents around the corresponding metal ion. From solubility test, we obtained that metal complexes of ligands A, D and E had no ionic properties and dissolve partially in polar and slightly in nonpolar solvents. These results confirmed the behavior of metal complexes as weak electrolyte from their low value of molar conductivity. Conductance data and solubility test of the complexes enhanced them to be (1:2 M:L ratio). All data confirmed an octahedral geometry of these complexes and their structures as {[M (A, D or E)2(CH3COO)2], when M= Co or Ni} and {[Cu (A, D or E)2 Cl2]}. Cyclic voltammetry measurements were accomplished of Cobalt(II), Copper(II) and Nickel(II) complexes using Pt wire as counter electrode and Ag/AgNO3 as reference electrode and (Bu4N+PF6+) as supporting electrolyte. The result exhibit the irreversible process showing single one electron transfer process of Cobalt(II) and Nickel(II) complexes and unique quasi-reversible redox couple is attributed to Cu(II) complexes.
KEYWORDS:Cobalt; Copper; Cyclic Voltammetry; Metal Nomplexes; Nickel; Schiff Bases
Introduction
Schiff base was invented by Hugo-Schiff which is named after line,1 They are defining as condensation results of the reaction between aldehyde or ketone with primary amine and theses are including azomethine functional group (HC=N), which is reversible reaction and commonly carry out in acid or base medium, or with high temperature.2 Synthesis of Schiff base depends on the dehydration of carbinolamine which considers as the rate determination step of the reaction and this is the reason of using acid as catalyst.3 They comports as a Flexi-dentate ligand and generally coordinates by the oxygen phenolic group and the nitrogen atom of azometheine group.4 In Schiff base, azomethine N-atom and other donor atom such as O-atom act a necessary role in coordination chemistry and easily coordinate to metal atoms to obtain various complexes.5,6,7 The aromatic aldehyde Schiff bases having effective conjugation and are more stable.8 It should not use high acid concentration due to the basicity of amine compounds, so if the amine protonation happens and turns to non-neucleophilic, the equilibrium is drawn to the left and this will ban carbinolamine formation. Thus, different Schiff bases preparation are best accomplished at modestly acidic PH.9 Schiff bases are considered as useful chelates due to their differentspecification such as easy synthesis, precise steric, structural varieties and electronic control on their structure. Lately, worthy utility have progressed in the preparation and identification of the complexes including Schiff bases for using as catalysts.10,11,12,13,14 Schiff base compounds have been vastly studied for their antibacterial, antifungal, antitumor activities.15,16,17 CV defines as a kind of potentiodynamic electrochemical study. In CV technique, the relation between the potential of working electrode and time is linear.18,19 CV is drawn between the current of the working electrode and the applied voltage.20 CV is usually employed to explore the electrochemical features of an analyte in solution or of the compound which is adsorbed on the electrode surface.21 The advantage of CV is quite based on the analyte under survey. The substance should be redox active with in the potential window to be scanned.22 In reversible couples, the substances frequently shows irreversible cyclic voltammetry wave, which is watched when foremost substance can be recovered after a forward and reverse scan in the same cycle. In the spite of reversible couples are easier to analyze, they provide less information than more complexes wave forms.23 The wave form of reversible couple is complex due to the united effects of polarization and diffusion, this variation mainly result from this effect, of analyte diffusion rates, the wave form is influenced too by the electron transfer rate.24
Because of broad area of applications of the metal complexes of Schiff bases, we now report this present investigation which deals with new octahedral Cobalt(II), Copper(II) and Nickel(II) complexes with Schiff bases A, D and E. We have synthesized, characterized these compounds using CHN, FT-Infrared, electronic spectroscopy, 1H and C13 NMR and studied analytical and electrochemical features, which were achieved by CV technique of Schiff base ligands as co-ligands for their coordination behavior in their complexes using various techniques.
Experimental Materials
All reagents, starting materials as well as solvents are employed to prepare Schiff bases in addition to their metal complexes were obtained from Aldrich, BDH, Fluka and Merck and were used as received. Tetrabutyl ammonium tetrafluroborate (TBATFB) which act as supporting electrolyte was purchased from Aldrich Chemical Co.
Instrumentation
All m.p. in degree Celsius were checked with a capillary devices and were recorded on electro thermal VeeGo Digital model VMP-D.Jenway. All the compounds were routinely characterized and checked by FT-IR, 1H NMR and C13-NMR, CHN, electronic spectroscopies and CV. Infrared spectra were measured in KBr disc (400-4000 cm-1) in Japan (a Shimadzu model 8400S FTIR spectrometer). 1HNMR and C13-NMR were measured on Bruker 400 MHz spectrometer in Deuterochloro form and Deuterated dimethyl sulfoxide solvents. CHN analysis were recorded by Perkin CE-440 elemental analyzer. Electronic absorption spectra in aqueous solution were recorded by using UV-9200, Biotech Engineering Management Co.LTD (UK) Single beam in the region 230–1100 nm. Molar conductance was recorded on W.T.W conductivity Master LBR meter. Electrochemical properties of the synthesized metal complexes were examined by carried out the cyclic voltammetry (CV) experiments with CH Instruments, USA, Digi-Ivy (Model DY2300 Series-potenstiostate/ biopotensiostate, electrochemical analyzer), in absolute ethanol in the presence of tetrabutylammonium hexafluoroborate (TBATFB) (0.10 mol L−1) as supporting electrolyte and about 10-3 M complexes. All CV measurements were measured at r.t. (approximately 25oC) with keeping N2 atmosphere above the solution surface with coupling with Electrochemical System software (GPES version 4.7 for Windows). Typical model three electrodes array composed of Pt -wire working electrode, Pt counter electrode, and an Ag/AgNO3 as reference electrode under nitrogen were utilized. Potentials were recorded against Ag/AgNO3 and to eliminate interfering oxygen and purging the setup, before each experiment the solutions were bubbled with nitrogen gas. Before each measurement the working electrode was smoothed by sand paper to improve electrochemical sensitivity, providing active surface.
Synthesis of ligands (A, D and E)
The preparation method of ligands A, D, E was carried out according to method reported elsewhere by mixing equal amounts (1:1 mole ratio) each aldehyde or ketone with suitable amine.25 They were synthesized in ethanol medium using glacial acetic acid as catalyst by the reaction from salicyladehyde, 2-bromo-4-phenol acetophenone or 1-([1,1′-biphenyl]-4-yl)-2-bromoethan-1-one as based ligands and two amines: 2,5-difluoro aniline or 1-amino-2,4-dibromo anthraquinone.
Synthesis of ligand A
(2.44 g, 20 mmol) salicylaldehyde in 10 ml warm ethanolic solution (40-50)oC with (1-2) drops of glacial acetic acid were mixed with (4.64 g, 20 mmol) 2,5-difluoro aniline in ethanol solvent. Then the mixture was reflexed for 2 hours and cooled to r.t.. The mixture was filtered and the precipitate was washed and recrystallized with absolute ethanol and then dried to obtain yellow crystals. Yield: (4.59 g, 99%); m.p: 104-106oC; FT-IR (cm-1): ѵ(O-H) stretch 3410, ѵ(C=N) 1604, ѵ(C=C) 1558, ѵ(C-N) 1371, ѵ(C-O) stretch 1281, ѵ(C-O) bending 1157; UV-Vis. spectrum, λmax nm: π→π* 266, n→π* 320; 1H-NMR (400 MHz, DMSO-d6), δ(ppm): 12.74 (1H, s, O-H), 9.05 (1H, s, -CH=N-), 7.75 (1H, d, Ar JHH =7.5 Hz ), 7.61 (1H, d, Ar JHH =7.5 Hz), 7.50 (1H, t, Ar, JHH =5 Hz), 7.33 (1H, t, Ar, JHH =5 Hz), 7.17 (1H, s, Ar, JHH =5 Hz), 6.88 (2 H, d, Ar, JHH =5 Hz); 13C-NMR (100 MHz, DMSO-d6), δ(ppm): 166.25 (C-OH), 160.65 (-CH=N-), 159.70 (C-F), 157.66 (C-F), 152.80, 150.60, 133.75, 132.50, 118.80, 118.01, 117.50, 116.85, 114.35. Calculated for C13H9F2NO: C, 66.95; H, 3.89; N, 6.01. Found: C, 67.00; H, 3961; N, 6.00.
Synthesis of ligand D
Same procedure as above is followed to synthesis ligand D by using the following weights: (1.22 g, 10 mmol) salicylaldehyde and (3.81 g, 10 mmol) 1-amino-2,4-dibromo anthraquinone). Red crystals; Yield: (1.69 g, 45%); M.p: 230-232oC; FT-IR (cm-1): ѵ(O-H) stretch 3401, ѵ(C=O) 1683, ѵ(C=N) 1594, ѵ(C=C) 1488, ѵ(C-N) 1388, ѵ(C-O) stretch 1280, ѵ(C-O) bending 1194; UV-Vis. spectrum, λmax nm: π→π* 250, n→π* 300; 1H-NMR(400 MHz, DMSO-d6), δ(ppm): 9.75 (1H, s, O-H), 8.38 (1H, s,-CH=N-), 7.55 (1H, s, Ar), 7.44 (2H, t, Ar JHH = 5Hz), 7.22 (2H, t, Ar JHH = 5Hz), 7.01 (2H, d, Ar JHH = 7.5 Hz), 6.89 (2H, d, Ar JHH = 7.5 Hz), 13C-NMR (100 MHz, DMSO-d6), δ(ppm): 190.00 (C=O), 185.01 (C=O), 165.13 (C-OH), 163.01(-CH=N-), 145.51, 144.92, 130.32, 129.18, 127.54, 126.03, 126.30. Calculated for C21H11Br2NO3: C, 51.99; H, 2.29; N, 2.89. Found: C, 50.23; H, 2.433; N, 3.886.
Synthesis of ligand E
Same procedure as above is followed to synthesis ligand E by using the following weights: (2.75 g, 10 mmol) [1,1′-biphenyl]-4-carbonyl bromide and (3.81 g, 10 mmol) 1- amino-2,4-dibromo anthraquinone). White crystals; Yield: (3.24 g, 85%); m.p: 128-130oC; FT-IR (cm-1): ѵ(C=O) 1679, ѵ(C=N) 1590, ѵ(C=C) 1485, ѵ(C-O) 1284, ѵ(C-N) 1388; UV-Vis. spectrum, λmax nm: π→π* 230, n→π* 319; 1H-NMR(400 MHz, DMSO-d6), δ(ppm): 8.13 (2H, t, Ar JHH = 5Hz), 8.00 (2H, d, Ar JHH = 5Hz), 7.91 (2H, m, Ar),7.75 (4H, m, Ar), 7.47 (4H, m, Ar), 2.5 (2H, s, CH2 group),13C-NMR (100 MHz, DMSO-d6), δ(ppm): 193.65(-C=N-), 191.04(C=O), 186.21(C=O), 144.88, 138.75, 138.11, 133.03, 132.45, 131.05, 130.31, 130.01, 129.40, 128.75, 128.10, 127.50, 127.33, 127.11, 126.70, 126.25, 65.00 (-CH2-Br). Calculated for C28H16Br3NO2: C, 52.70; H, 2.53; N, 2.19 Found: C, 53.15; H, 2.952; N, 2.880.
Synthesis of Cobalt(II), Copper(II) and Nickel(II) complexes
Synthesis of the prepared metal complexes with ligands A, D and E were synthesized by the reaction between M(II) salt with the ligand under reflux.
Synthesis of ACo complex. [Co(A)2(CH3COO)2]
(5 ml) of the ligand A (0.232 g, 1 mmol) in ethanol is added (5 ml) ethanolic solution of the (0.125g, 0.5 mmol) Co(CH3COO)2.4H2O. The mixture was refluxed for 2 hours, then cooled. Brown precipitate was filtered and washed with absolute ethanol and then dried. Light brown precipitate; Yield: (0.172 g, 74%); D.p: 253oC; FT-IR (cm-1): ѵ(O-H) stretch 3423, ѵ(C=N) 1604, ѵ(C=C) 1564, ѵ(C-N) 1415, ѵ(C-O) stretch 1240, ѵ(C-O) bending 1141, ѵ(Co-O) 525, ѵ(Co-N) 469; UV-Vis. spectrum, λmax nm: π→π* 286, n→π* 310, LMCT 488, d-d 530. Calculated for C30H24F4N2O6Co: C, 56.00; H, 3.76; N, 4.35 Found: C, 58.12; H, 3.532; N, 4.126.
Synthesis of ACu complex. [Cu(A)2Cl2]
The preparation method is similar to the above, using (0.085g, 0.5 mmol) CuCl2.2H2O instead of Co(CH3COO)2.4H2O. Dark brown precipitate; Yield: (0.186 g, 80%); D.p: 288oC; FT-IR (cm-1): ѵ(O-H) stretch 3435, ѵ(C=N) 1602, ѵ(C=C) 1552, ѵ(C-N) 1400, ѵ(C-O) stretch 1219, ѵ(C-O) bending 1135, ѵ(Cu-O) 541, ѵ(Cu-N) 473; UV-Vis. spectrum, λmax nm: π→π* 272, n→π* 322, LMCT 475, d-d 967. Calculated for C26H18F4N2O2CuCl2: C, 51.97; H, 3.02; N, 4.66 Found: C, 52.415; H, 2.770; N, 4.842.
Synthesis of ANi complex. [Ni(A)2(CH3COO)2]
The preparation method is similar to the ACo, using (0.124g, 0.5 mmol) Nickel acetate tetra hydrate instead of Cobalt acetate tetra hydrate. Green precipitate; Yield: (0.153 g, 66%); D.p: 130oC; FT-IR (cm-1): ѵ(O-H) stretch 3438, ѵ(C=N) 1601, ѵ(C=C) 1587, ѵ(C-N) 1379, ѵ(C-O) stretch 1224, ѵ(C-O) bending 1142, ѵ(Cu-O) 534, ѵ(Cu-N) 464; UV-Vis. spectrum, λmax nm: π→π* 278, n→π* 310, LMCT 434, d-d 731. Calculated for C30H24F4N2O6Ni: C, 56.02; H, 3.76; N, 4.36 Found: C, 56.675; H, 3.556; N, 4.491.
Synthesis of DCo complex. [Co(D)
The preparation method is similar to the ACo, using ligand D (0.49 g, 1 mmol) instead of ligand A. Red precipitate; Yield: (0.358 g, 73%); D.p: 240oC; FT-IR (cm-1): ѵ(O-H) stretch 3439, ѵ(C=N) 1564, ѵ(C=O) 1546, ѵ(C=C) 1417, ѵ(C-N) 1340, ѵ(C-O) stretch 1269, ѵ(C-O) bending 1131, ѵ(Cu-O) 533, ѵ(Cu-N) 477; UV-Vis. spectrum, λmax nm: π→π* 260, n→π* 310, LMCT 488. Calculated for C46H28Br4N2O10Co: C, 48.16; H, 2.46; N, 2.44 Found: C, 50.087; H, 2.774; N, 2.345.
Synthesis of DCu complex. [Cu(D)2Cl2]
The preparation method is similar to the ACu, using ligand D (0.49g, 1 mmol) instead of ligand A. Red precipitate; Yield: (0.421 g, 86%); D.p: 233oC; FT-IR (cm-1): ѵ(O-H) stretch 3437, ѵ(C=O) 1633, ѵ(C=N) 1587, ѵ(C=C) 1505, ѵ(C-N) 1383, ѵ(C-O) stretch 1265, ѵ(C-O) bending 1122, ѵ(Cu-O) 560, ѵ(Cu-N) 480; UV-Vis. spectrum, λmax nm: π→π* 260, n→π* 320, LMCT 470, d-d 960. Calculated for C42H22Br4N2O6CuCl2: C, 45.66; H, 2.01; N, 2.54 Found: C, 46.078; H, 1.984; N, 2.621.
Synthesis of DNi complex. [Ni(D)2(CH3COO)2]
The preparation method is similar to the ANi, using ligand D (0.49g, 1 mmol) instead of ligand A. Gray precipitate; Yield: (0.431 g, 88%); D.p: 124oC; FT-IR (cm-1): ѵ(O-H) stretch 3444, ѵ(C=N) 1541, ѵ(C=C) 1494, ѵ(C-N) 1421, ѵ(C-O) stretch 1262, ѵ(C-O) bending 1120, ѵ(Cu-O) 555, ѵ(Cu-N) 475; UV-Vis. spectrum, λmax nm: π→π* 230, n→π* 320, LMCT 429, d-d 738. Calculated for C46H28Br4N2O10Ni: C, 48.17; H, 2.46; N, 2.44 Found: C, 49.641; H, 2.567; N, 2.965.
Synthesis of ECo complex. [Co(E)2(CH3COO)2]
The preparation method is similar to the ACu, using ligand E (0.64 g, 1 mmol) instead of ligand A. Pink precipitate; Yield: (0.346 g, 54%); D.p: 230oC; FT-IR (cm-1): ѵ(C=O) 1687, ѵ(C=N) 1599, ѵ(C=C) 1442, ѵ(C-N) 1336, ѵ(Co-O) 540, ѵ(Co-N) 471; UV-Vis. spectrum, λmax nm: π→π* 213, n→π* 290, LMCT 478. Calculated for C60H38Br6N2O8Co: C, 49.59; H, 2.64; N, 1.93 Found: C, 51.013; H, 2.687; N, 2.237.
Synthesis of ECu complex. [Cu(E)2Cl2]
The preparation method is similar to the ACu, using ligand E (0.64g, 1 mmol) instead of ligand A. red precipitate; Yield: (0.454 g, 71%); D.p: 132oC; FT-IR (cm-1): ѵ(C=O) 1687, ѵ(C=N) 1599, ѵ(C=C) 1483, ѵ(C-N) 1383, ѵ(Cu-O) 562, ѵ(Co-N) 474; UV-Vis. spectrum, λmax nm: π→π* 240, n→π* 330, LMCT 467, d-d 954. Calculated for C56H32Br6N2O4CuCl2: C, 47.68; H, 2.29; N, 1.99 Found: C, 48.932; H, 2.936; N, 2.168.
Synthesis of ENi complex. [Ni(E)2(CH3COO)2]
The preparation method is similar to the ACu, using ligand E (0.64g, 1 mmol) instead of ligand A. red precipitate; Yield: (0.403 g, 63%); D.p: 130oC; FT-IR (cm-1): ѵ(C=O) 1665, ѵ(C=N) 1597, ѵ(C=C) 1412, ѵ(C-N) 1364, ѵ(Cu-O) 555, ѵ(Co-N) 470; UV-Vis. spectrum, λmax nm: π→π* 225, n→π* 300, LMCT 426, d-d 744. Calculated for C60H38Br6N2O8Ni: C, 49.60; H, 2.64; N, 1.93 Found: C, 50.489; H, 2.731; N, 1.964.
Results and Discussion
Synthesis and Characterization
New Schiff bases A, D, E were prepared by combination of aldehyde or ketone and suitable amine as described below in experimental procedures (Scheme 1). Their structures were confirmed by elemental analysis, solubility test, conductance measurements and spectral studies (H1-NMR, C13-NMR,FT-IR and UV-Vis spectroscopy), determination of ligand-metal bonded ratio and cyclic voltammetry. Scheme 2 illustrates the reaction of Schiff base ligands A, D and E with Cobalt acetate tetra hydrate, Copper chloride di hydrate and Nickel acetate tetra hydrate which gave solids compounds [ACo, ACu and ANi], [DCo, DCu and DNi] and [ECo, ECu and ENi]. All these compounds were stable and they are isolated in good yields. Their analytical data are corresponding to their experimental and composition section.
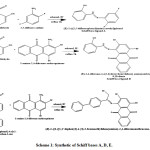 |
Scheme 1: Synthetic of Schiff bases A, D, E (Scheme 2): Synthetic of Schiff bases A, D, E complexes. FT-IR spectral studies. |
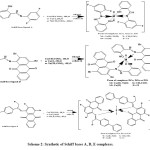 |
Scheme 2: Synthetic of Schiff bases A, D, E complexes. |
The infrared data provide considerable sign of the formula of ligands A, D and E and their metal complexes. The FT-infrared spectra gives the worthy information relating to the behavior of functional groups coordinated to the M(II) ions. However, the existence of a strong and sharp peak at (1590-1604 cm-1) which is related to C=N stretching frequency and sharp peak at (1371-1388 cm-1) due to C-N stretching frequency in ligands confirm the formation of ligands. These results are in good agreement with another studies reported elswhere.26,27,28 As compared with the corresponding starting materials aldehyde or ketone with amines, the absence of peak around 1690 cm-1 of C=O stretching band in ligands and their complexes consider as good indication to reaction and formation of Schiff bases. The downward shift of υ (C=N) band by (7-53 cm-1), the downward shifts of υ (C-N) band by (9-48) cm-1 in all prepared metal complexes suggested the coordination of nitrogen in (-CH=N-) group with metal ion center and formation of M-N band.29, 30 A medium peaks at 3410 and 3401 cm-1 in IR spectra of Schiff base A and D are due to υ (O-H) stretch. The same spectra showed strong bands in 1281 and (1157- 1194 cm-1) is assigned to υ (C-O) stretch and υ (C-O) bending respectively. The change of the position of υ (O-H) and downward shift of υ (C-O) stretch and υ (C-O) bending by (13-43 cm-1), (11-78 cm-1), (15-74 cm-1) respectively in the complexes suggested coordination of the (O-H) phenolic in Schiff base A and D with metal ion center and formation of M-O band.31, 32 A strong peak at 1679 cm-1 in FT-infrared spectrum of ligand E was due to υ (C=O) stretching frequency. The change of the position of υ (C=O) in FT-IR spectra of metal complexes of Schiff base E as compared with free ligand is considered good indication to take part of O-atom in carbonyl group in the coordination sphere. Furthermore, the stretching of two new bands, M(II)-O and M(II)-N appeared in lower wavelength region ranging 525-562 and 464-480 cm-1 respectively. Which also enhance the suggestion of the coordination through nitrogen atom from (-CH=N-) group from Schiff base ligands A, D and E in their complexes (ACo, ACu and ANi), (DCo, DCu and DNi) and (ECo, ECu and ENi). In the other side, the oxygen atom from (O-H) group from A and D ligands and oxygen atom from C=O group in ligand E, take part of the coordination sphere. The important FT-IR bands for Schiff bases A, D and E and their Cobalt(II), Copper(II) and Nickel(II) complexes are given in Table (1).
Table 1: Selected FT-IR bands (cm-1) for Schiff bases A, D and E and their Cobalt(II), Copper(II) and Nickel(II) complexes.
|
(υ(M-O Stretch |
(υ(M-N Stretch |
(υ(C=O Stretch |
(υ(C-O bending |
(υ(C-O Stretch |
(υ(C-N Stretch |
(υ(C=C Stretch |
(υ(C=N Stretch |
(υ(O-H Stretch |
Comp |
|
– |
– |
– |
1157 |
1281 |
1371 |
1558 |
1604 |
3410 |
A |
|
541 |
473 |
– |
1135 |
1219 |
1400 |
1552 |
1602 |
3435 |
ACU |
|
525 |
469 |
– |
1141 |
1240 |
1415 |
1564 |
1604 |
3423 |
ACO |
|
534 |
464 |
– |
1142 |
1224 |
1379 |
1587 |
1601 |
3438 |
ANI |
|
– |
– |
1683 |
1194 |
1280 |
1388 |
1488 |
1594 |
3401 |
D |
|
560 |
480 |
1633 |
1122 |
1265 |
1383 |
1505 |
1587 |
3437 |
DCU |
|
533 |
477 |
1546 |
1131 |
1269 |
1340 |
1417 |
1564 |
3439 |
DCO |
|
555 |
475 |
– |
1120 |
1262 |
1421 |
1494 |
1541 |
3444 |
DNI |
|
– |
– |
1679 |
– |
– |
1388 |
1485 |
1590 |
– |
E |
|
562 |
474 |
1687 |
– |
– |
1383 |
1483 |
1599 |
– |
ECU |
|
540 |
471 |
1687 |
– |
– |
1336 |
1442 |
1599 |
– |
ECO |
|
555 |
470 |
1665 |
– |
– |
1364 |
1412 |
1597 |
– |
ENI |
Electronic Spectral Studies
The UV-Vis spectra taken in range of (210-1100 nm) in ethanol solution of ligands A, D and E and their metal complexes and electronic data are presented in Table 2. Data of ligands A, D and E show the same behavior in 210-400 nm. They exhibit two intense absorption bands at short wavelengths, (230-266) and (300-320 nm) which are assigned to aryl (π→π* transition),azomethine and carbonyl groups (n→π* transition) respectively. 33,34,35 The UV-Vis spectra of ligands A, D and E are prevailed by intra-ligand transitions related to aryl ring and azomethine group parts. UV-Vis data of the metal complexes show variation of theelectronictransitions in UV region to (213-286) and (290-330 nm) upon coordination which are corresponding to π→π* and n→π* respectively. This is due to the coordination of the Cobalt(II), Copper(II) and Nickel(II) ions with ligands A, D, E via azomethine and carbonyl groups. The new single charge transfer (LMCT) band is assigned in Copper(II) and Nickel(II) complexes at (426-475 nm). In accordance with previous articles of Copper(II) complexes, band centered in (476-434 nm) 21000–23000 cm-1 is due to phenolate O→Cu(II) LMCT transition.36 Further, after complexation new peaks (Two peaks of Cobalt(II) complexes, a single peak of Copper(II) complexes and three bands for Ni(II) complexes) appear in UV-Visible region. UV-Vis of Cobalt(II) complexes, ACo, DCo and ECo show two peaks (915-933 nm), (474-488 nm) assigned to 4T1g(F)→4T2g(F) and 4T1g(F)→4T2g(P) transitions respectively. New peaks are attributed to high spin octahedral Cobalt(II) complexes. The 4T1g(F)→4A2g(F) is not observed in the spectra may be it has been shielded by the broad band of 4T1g(F)→4T2g(P) transition. This is similar to study reported elsewhere for Co(II) complex which exhibit two absorption bands fall of 917 nm and 435 nm attributed to 4T1g(F)→4T2g(F) and 4T1g(F)→4T2g(P).37 A single band in ACu, DCu and ECu complexes at (954-967 nm) is assigned to T2g→eg transition supporting a regular six coordinate octahedral Cu(II) complexes.38 While three spin allowed transitions in ANi, DNi and ENi are attributed to 3A2g→3T2g, 3A2g→3T1g(F) and 3A2g→3T1g(p) ranging (1060-1084 nm), (731-744 nm) and (475-491 nm) respectively which support six coordinate Oh Nickel(II) complexes, which is in usual scale of reported octahedral complexes.37 Figures (1 and 2) show the electronic spectra of ACu and ENi respectively.
Table 2: Electronic data (nm) of ligands A, D, E and their Cobalt(II), Copper(II) and Nickel(II) complexes.
|
3A2g→3T2g |
3A2g→3T1g (F) |
3A2g→3T1g (p) |
T2g→eg |
4T1g(F)→4T2g (F) |
4T1g(F)→4T2g (P) |
MLCT |
n–π* |
π–π* |
Comp |
|
– |
– |
– |
– |
– |
– |
– |
320 |
266 |
A |
|
– |
– |
– |
– |
930 |
488 |
– |
310 |
286 |
ACo |
|
– |
– |
– |
967 |
– |
– |
475 |
322 |
272 |
ACu |
|
1060 |
731 |
475 |
– |
– |
– |
434 |
310 |
278 |
ANi |
|
– |
– |
– |
– |
– |
– |
300 |
250 |
D |
|
|
– |
– |
– |
933 |
488 |
– |
310 |
260 |
DCo |
|
|
– |
– |
– |
960 |
– |
– |
470 |
320 |
260 |
DCu |
|
1067 |
738 |
484 |
– |
– |
429 |
320 |
230 |
DNi |
|
|
– |
– |
– |
– |
– |
– |
319 |
230 |
E |
|
|
– |
– |
– |
915 |
474 |
– |
290 |
213 |
ECo |
|
|
– |
– |
– |
954 |
– |
– |
467 |
330 |
240 |
ECu |
|
1084 |
744 |
491 |
– |
– |
426 |
300 |
225 |
ENi |
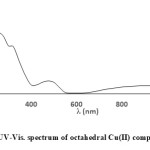 |
Figure 1: UV-Vis. spectrum of octahedral Cu(II) complex ACu |
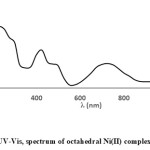 |
Figure 2: UV-Vis, spectrum of octahedral Ni(II) complex ENi. |
NMR spectral Analysis
The 1H-NMR and 13C-NMR spectra of ligands A, D, E were obtained using DMSO-d6 solvent at room temperature, (See experimental section). The 1H-NMR spectrum of ligand A exhibited two singlet peaks at δ 12.74 ppm and δ 9.05 ppm attributed to (O-H) group and (-CH=N-) azomethine proton respectively, and different peaks arranged around δ 6.88-7.75 ppm distributed among singlet, doublet and triplet due to seven aromatic protons. While (O-H) proton and (-CH=N-) azomethine proton appeared in the spectrum of Schiff base ligand D as two singlet peaks at δ 9.75 ppm and δ 8.38 ppm respectively, and different peaks arranged around δ 6.89-7.55 ppm due to nine aromatic protons. Which is in the usual range of reported Schiff base complexes.39 The 1H-NMR spectrum of ligand E exhibited a singlet peak at δ 2.5 ppm is assigned to (-CH2-Br) group attached to azomethine group when the other peaks which appeared around δ 7.47-8.13 ppm is attributed to fourteen aromatic rings. The 13C NMR of the Schiff base ligand A showed spectral signals at 166.25 ppm, 160.65 and around 159.70-114.35 ppm assigned to (C-OH), (-CH=N-) and carbon atoms in aromatic rings. The spectrum of Schiff base ligand D showed signals attributed to carbon atoms in (C=O), (C-OH), (-CH=N-) and aromatic rings around 185.01-190.00, 165.13, 163.01 and around 126.30-145.51 ppm respectivly. While in 13C-NMR spectrum of ligand E, (-C=N-) and (C=O) signals appeared at 193.65 and around 191.04-186.21 ppm. The spectra signals at 126.25-144.88 ppm is assigned to aromatic rings and signal at 65.00 ppm due to (-CH2-Br-) attached to azomethine group. This direct attachment caused big shift of azomethine group in ligand E to high chemical shift (deshielding, low magnetic field) as compared with ligands A and D and this is attributed to the electron withdrawing effect of (substituted-CH2Br). 1H and 13C NMR spectra gives further proof for the composition and the structure for ligands A, D and E by providing diagnostic information for the clarification of the protons position. Assignments of signals depend on the NMR spectrum which containing chemical shifts and intensity patterns. Unfortunately and logically, it is not useful to use the 1H and 13C NMR techniques to confirm the formation of ACo, ACu, ANi, DCo, DCu, DNi, ECo, ECu and ENi complexes and this is due to the paramagnetic nature of an octahedral d7 Cobalt(II), d9 Copper(II) and d8 Nickel(II) ions.
Solubility Test
Ionic and nonionic behavior of ligands A, D, E and [ACo, ACu and ANi], [DCo, DCu and DNi] and [ECo, ECu and ENi] complexes were investigated using solubility test. Different solvents were used in this test depending on their polarity such as (acetone, H2O, ethanol and DMSO) as polar solvents and (CCl4, toluene and cyclohexane) as nonpolar solvents. Solubility test of Schiff base ligands A, D, E and their complexes in different solvents is given in Table 3. We obtained from solubility test that Schiff base ligands D and E are nonsoluble or poor soluble in polar and nonpolar solvents when Schiff base ligand A is soluble in most of these solvents. The smaller size of Schiff base ligand A than D and E may be the reason of its good solubility. It was clear that [ACo, ACu and ANi], [DCo, DCu and DNi] and [ECo, ECu and ENi] are neutral and do not have ionic properties and this is due to their non-solubility in polar solvents (acetone, H2O) and partially or poor solubility in ethanol and nonpolar solvents (CCl4, toluene and cyclohexane). All these complexes are soluble completely in DMSO solvent and this related with very big polarity of solvent and the complexation between these complexes with DMSO which soluble in it.
.Table 3: Solubility test of ligands A, D, E and Cobalt(II), Copper(II) and Nickel(II) complexes
|
Comp |
Acetone |
H2O |
Ethanol |
DMSO |
CCl4 |
Toluene |
Cyclohexane |
|
A |
Soluble |
Nonsoluble |
Poor Soluble |
Soluble |
Soluble |
Soluble |
Soluble |
|
D |
Soluble |
Nonsoluble |
Poor Soluble |
Soluble |
Poor Soluble |
Poor Soluble |
Poor Soluble |
|
E |
Poor Soluble |
Nonsoluble |
Poor Soluble |
Soluble |
Poor Soluble |
Poor Soluble |
Poor Soluble |
|
ACo |
Nonsoluble |
Poor Soluble |
Poor Soluble |
Soluble |
Poor Soluble |
Poor Soluble |
Poor Soluble |
|
DCo |
Nonsoluble |
Poor Soluble |
Poor Soluble |
Soluble |
Poor Soluble |
Poor Soluble |
Poor Soluble |
|
ECo |
Nonsoluble |
Nonsoluble |
Poor Soluble |
Soluble |
Poor Soluble |
Poor Soluble |
Poor Soluble |
|
ACu |
Poor Soluble |
Nonsoluble |
Poor Soluble |
Soluble |
Poor Soluble |
Soluble |
Poor Soluble |
|
DCu |
Poor Soluble |
Nonsoluble |
Poor Soluble |
Soluble |
Poor Soluble |
Soluble |
Poor Soluble |
|
ECu |
Poor Soluble |
Nonsoluble |
Poor Soluble |
Soluble |
Poor Soluble |
Soluble |
Poor Soluble |
|
ANi |
Nonsoluble |
Nonsoluble |
Poor Soluble |
Soluble |
Poor Soluble |
Poor Soluble |
Poor Soluble |
|
DNi |
Nonsoluble |
Nonsoluble |
Poor Soluble |
Soluble |
Poor Soluble |
Poor Soluble |
Poor Soluble |
|
ENi |
Nonsoluble |
Nonsoluble |
Poor Soluble |
Soluble |
Poor Soluble |
Poor Soluble |
Poor Soluble |
Molar Conductance Measurements
While concentration of the solution was increased, the conductivity raised. This characteristic is due to increasing of the number of ions that are settled in the solution, this rising of conductivity perhaps is due to the change in the concentration of the electrolyte or the change in the degree of dissociation.40 For these reasons, molar conductance should be used to investigate the difference of the chemical conductivity with concentration. The molar conductance of [ACo, ACu and ANi], [DCo, DCu and DNi] and [ECo, ECu and ENi] were investigated in dimethyl sulfoxide (DMSO) as solvent and concentration of these complexes were (10-4-10-5 M) at 25oC. Equation (1) which known as Kolorash equation was applied and Λm vs. (C)1/2 were plotted of all these complexes, for examples see Figures (3, 4 and 5).
Λm = Λo – S (C)1/2 ……….… (1)
It was provided that molar conductance for these complexes raised in dilute concentration. These measurements are useful to explore the presence of anions outside the coordination sphere for metal complexes. Molar conductivity values are given in Table (4). The complexes showed a lower molar conductivity values ranging 13-30 ohm-1 cm2 mole-1 which indicated their weak-electrolytic nature in DMSO solvent. We gained from molar conductance measurements that all prepared complexes behave as neutral with nonionic shape and the mole ratio is 1:2 (M : L). These results are similar with the results of solubility test that showed these complexes did not dissolve in polar solvents and poor soluble in nonpolar solvents so these complexes have neutral and nonionic form and nonionic properties.
Table 4: Molar conductivity values of Cobalt(II), Copper(II) and Nickel(II) complexes.
|
(Λm (ohm-1 cm2 mole-1 |
Complex |
NO |
|
16 |
ACo |
1 |
|
21 |
DCo |
2 |
|
20 |
ECo |
3 |
|
13 |
ACu |
4 |
|
14 |
DCu |
5 |
|
16 |
ECu |
6 |
|
18 |
ANi |
7 |
|
30 |
DNi |
8 |
|
22 |
ENi |
9 |
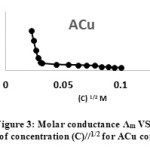 |
Figure 3: Molar conductance Λm VS. Square root of concentration (C)//1/2 for ACu complex. |
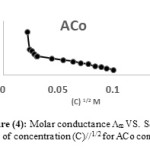 |
Figure 4: Molar conductance Λm VS. Square root of concentration (C)//1/2 for ACo complex.Click here to View Figure |
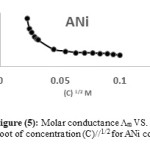 |
Figure 5: Molar conductance Λm VS. Square root of concentration (C)//1/2 for ANi complex. |
Determination of the stability constant for the transition metal complexes.
It is very important to study stability constant for the transition metal complexes due to the importance of the free electron pair in Schiff base ligands to form complexes between these ligands and metal ion. There are different ways are used to calculate stability constant while the determination of the concentration of complexes are preferred when the complex is colored.41
α =Am-As/Am …… (1)
Where α = degree of analysis, 42, 43 As = Absorbance of the same quantities of Ligand: Metal, Am=Absorbance of excess quantity of ligand with constant volume of metal L : M (1:1), see equation (2). Where C= Concentration of the ligand when C ligand = C metal.
K=1-α/α2C …….. (2)
K=1-α/4α3C2 …….. (3)
In our work, the mole ratio [L: M, 2: 1]is confirmed so we used equation (3) to calculate stability constant. Table 5 show that the stability of Ni(II) complexes [ANi, DNi, ENi] more than Cobalt(II) and Copper(II) complexes [ACo, DCo, ECo] and [ACu, DCu and ECu] respectively while Cu(II) complexes [ACu, DCu and ECu] less stability than the others. For a specific ligand, the stability of complexes of metal ions having the same charge decreases with the increase of the size of the central metal ion. Thus the size of the cations increases in the same period.44, 45 This fact explain the higher stability of the prepared Ni(II) complexes than the others.
Table 5: Stability constant of the prepared complexes with ligands A, D and E.
|
K×109 |
α |
Am |
AS |
Comp |
|
1.350 |
0.1655 |
0.145 |
0.121 |
ACo |
|
1.344 |
0.362 |
0.346 |
0.232 |
DCo |
|
1.202 |
0.434 |
0.276 |
0.264 |
ECo |
|
1.293 |
0.366 |
0.131 |
0.083 |
ACu |
|
1.048 |
0.388 |
0.345 |
0.211 |
DCu |
|
1.139 |
0.379 |
0.345 |
0.214 |
ECu |
|
1.370 |
0.368 |
0.122 |
0.077 |
ANi |
|
1.705 |
0.339 |
0.286 |
0.189 |
DNi |
|
1.870 |
0.212 |
0.367 |
0.289 |
ENi |
Determination of the metal-Schiff base ligand bonded ratio in the prepared transition metal complexes
The mole ratio method and continuous variation method are applied together separately to confirm the ratio of the metal to ligand to form the Cobalt(II), Copper(II) and Nickel(II) complexes with ligands A, D and E. The mole ratio method is used as easy way for deducing the stoichiometry in the complexes.46 It depends on the quantity of one reactant, commonly the moles of metal, is kept constant, whereas the quantity of ligand is changed. The mole ratio method is considered as another option to the method of continuous variations 47 which is also called Paul Job’s method and used in analytical chemistry to assign the stoichiometry of a binding event and used in instrumental analysis. The obtained results suggest (Metal 1 : 2 ligand mole ratio in their complexes). Figures (6a-8b) show the application of mole ratio and continuous change methods on the prepared metal complexes.
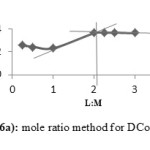 |
Figure 6a: Mole ratio method for DCo complex. |
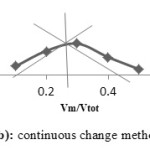 |
Figure 6b: Continuous change method for DCo |
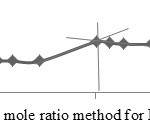 |
Figure 7a: Mole ratio method for ECu complex. |
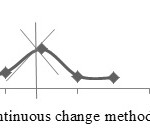 |
Figure 7b: Continuous change method for ECu complex. |
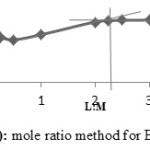 |
Figure 8a: Mole ratio method for ENi complex. |
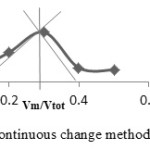 |
Figure 8b: Continuous change method for ENi complex. |
Therefore, depending on the above analytical, spectral evidences, solubility test, molar conductance data and an octahedral d7 Cobalt(II), d9 Copper(II) and d8 Nickel(II) paramagnetic nature, it is confirmed that two molecules of the ligands A, D or E are coordinated as bidentate ligands through (-CH=N-) N-atom and the phenolate group O-atom in ACo, ACu, ANi, DCo, DCu and DNi. While ECo, ECu and ENi complexes exhibit coordination via azomethine N-atom and the carbonyl O-atom with corresponding metal ions. Accordingly CHN data (experimental section) and the other measured data, the other sites, fifth and sixth in the sphere coordination of octahedral structure are filled in two Cl– ions in Cu(II) complexes, ACu, DCu and ECu. While these sites filled in two CH3COO– ions in Co(II) and Ni(II) complexes, ACo, ANi, DCo, DNi, ECo and ENi. It is reported that octahedral geometry is the most preferred structure for six coordinated Cobalt(II), Copper(II) and Nickel(II) complexes.48
Electrochemical Studies
Ligand basicity may be affected on the metal ion oxidation state during complexation between ligand and metal ion so it is very important to use electrochemical process to be sure on the metal ion oxidation state. The significance of cyclic voltammetry results from its capability to rapidly supply considerable information over a broad potential range on the thermodynamics of redox processes, on coupled chemical reactions, transport properties of electrolysis reactions, the presence of intermediates and the stability of reaction products of the redox reactions and determine the reversibility of a reaction. Different factors are effecting of the electrochemical properties and the redox behavior of the transition metal complexes such as axial ligation degree, charge type, coordination number, division of unsaturation, substitution manner and size of the chelate ring.49,50,51,52,53,54 In our study to promote an understanding of the redox behavior of nine six-coordinate, three each of Cobalt(II), Copper(II) and Nickel(II) complexes of ligands A, D and E, cyclic voltammetric measurements of the complexes were recorded in ethanolic solution in range from +2.0 to -2.0 V using 0.1 Molar [Bu4N][BF4] at sweep rate of 0.1 V.Sec-1. Same cell setup was used in all CV measurements and the ferrocene/ ferrocenium couple (Fc/Fc+), E1/2= 0.505 V, ∆Ep= 130 mV) was employed as a criterion. We expected the redox potentials of Cobalt(II) and Nickel(II) acetate complexes would shift to more positive potentials relative to their Cu(II) chloride complexes, as it was expected from the electron-withdrawing and inductive effects of chloride with comparison to acetate group. The cyclic voltammograms of free Schiff base ligands A, D and E do not show any oxidation or reduction peak in the potential range used. Cyclic voltammograms of the Cobalt(II), Copper(II) and Nickel(II) complexes show metal centered processes. The electrochemical data of Copper(II) complexes are tabulated in Table (6) while electrochemical data of Cobalt(II) and Nickel(II) complexes are tabulated in Table (7). Cyclic voltammogram of the redox process for Cu(II) complexes is exhibited in Figure 9 when the cyclic voltammogram for irreversible process of Cobalt(II) and Nickel(II) complexes is shown in Figures 10 and 11. The cyclic voltammograms of Cobalt(II) and Nickel(II) complexes, [ACo, DCo and ECo] and [ANi, DNi and ENi] are very similar and show an irreversible anodic wave in the positive range (+1.109 – +1.288) and (+0.752 – +1.251) respectively which can be attributed to Cobalt(II)/Cobalt(III) and Nickel(II)/Nickel(III) processes respectively couple and this is in good agreement to the articles published elsewhere.48, 55 Cyclic voltammograms of the Cu(II) complexes, [ACu, DCu and ECu] are very similar and exhibit a single quasi-reversible one electron oxidation process (+0.719 – +0.818) (vs Fc/Fc+), with very large peak to peak separations being observed (318-375 mV). This redox process associated with Cu(II)/Cu(III) couple and this is in good agreement to the articles published before.56, 57 The redox process which is assigned in Cu(II) complexes is quasi-reversible as is clear from the standards adopted: values of Ipa and Ipc should not be identical and the ratio of the peak currents (Ipa/ Ipc) is not equal to one (such as 0.136 – 0.441), the E1/2 values are independent of sweep rate; the voltage separation between two peaks Δep lightly raises with increasing sweep rate (50–500 mV⋅S−1) and is clearly greater than 59 mV. Anyway, the peak current increases with the increase of the square root of the sweep rates. This confirm the electrode process as diffusion controlled. The oxidation potentials of [ACu, DCu and ECu] complexes are shifted to lower potential relative to the corresponding [ACo, DCo and ECo] and [ANi, DNi and ENi] complexes with comparison to the redox couple potentials of Cu(II) chloride complexes with the potentials of Cobalt(II) and Nickel(II) acetate complexes. This manner can be attributed to the electron withdrawing properties of chloride regarding to acetate. The stability of the resulting Cobalt(II), Copper(II) and Nickel(II) complexes was assigned to presence of the coordinated azomethine groups and stabilization by nitrogen donor atoms. 58
Table 6: Electrochemical parameters for the quasi-reversible process vs. Fc/Fc+ exhibited by Cu(II) complexes, [ACu, DCu and ECu] in ethanol solution at 100 mv/sec.
|
Ipc/Ipa |
Ipc μA |
Ipa μA |
E1/2(V) |
EP ∆ (mV) |
EPc (V) |
EPa(V) |
Complex |
|
0.136 |
5.14 |
37.86 |
0.5905 |
321 |
+0.430 |
+0.751 |
ACu |
|
0.441 |
12.75 |
28.89 |
0.6595 |
318 |
+0.501 |
+0.818 |
DCu |
|
0.342 |
26.15 |
76.41 |
0.5315 |
375 |
+0.344 |
+0.719 |
ECu |
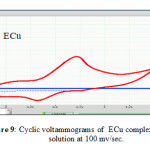 |
Figure 9: Cyclic voltammograms of ECu complex in ethanol solution at 100 mv/se. |
Table 7: Electrochemical parameters of the irreversible process exhibited by Cobalt(II) and Nickel(II) complexes, [ACo, DCo, ECo] and [ANi, DNi and ENi] in ethanol solution at 100 mv/sec.
|
EP (V) vs Fc/Fc+ irreversible oxidative process |
Complex |
|
+1.288 |
ACo |
|
+1.109 |
DCo |
|
+1.213 |
ECo |
|
+1.251 |
ANi |
|
+0.868 |
DNi |
|
+0.752 |
ENi |
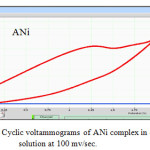 |
Figure 10: Cyclic voltammograms of ANi complex in ethanol solution at 100 mv/sec. |
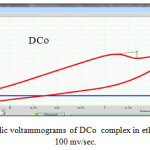 |
Figure 11: Cyclic voltammograms of DCo complex in ethanol solution at 100 mv/sec. |
Conclusion
The pharmacological properties and the ability to form complexes of Schiff bases make them highly important class of organic compounds. Our team has been a great attracted in preparation of Schiff base derivatives. The new prepared ligands, (E)-2-(((2,5-difluorophenyl)imino) methyl)phenol (A), (E)-2,4-dibromo-1-((2-hydroxybenzylidene) amino)anthracene-9,10-dione (D) and (Z)-1-((1-([1,1′-biphenyl]-4-yl)-2-bromoethylidene) amino)-2,4-dibromo anthracene-9,10-dione (E) were synthesized in good yields and identified minutely and utilized for complexation with Cobalt acetate tetra hydrate, Copper chloride di hydrate and Nickel acetate tetra hydrate metal salts. Ligands A, D, E and its Cobalt(II), Copper(II) and Nickel(II) complexes were prepared and identified elaborately based on the basis of different physicochemical techniques like elemental analysis, conductance measurements and spectral studies (H1-NMR & C13-NMR,FT-IR, UV-Vis spectroscopy) and cyclic voltammetry. According to results obtained from all measurements, analysis and spectral studies above mentioned, all complexes are mononuclear and octahedral six-coordinate geometry around Cobalt(II), Copper(II) and Nickel(II) ions in their complexes have been proposed. This study reveals that all complexes have the composition of (ML2.X2) and one mole of ligand behaves as neutral bidentate chelating agents around the corresponding metal ion. Ligands play as N2O2 donor group in their metal complexes coordinating through N-atom in (-CH=N-) group and the phenol group oxygen atom (O-H) in the metal complexes of Schiff bases A and D. While ligand E complexes exhibit coordination through the azomethine (-CH=N-) N-atom and the carbonyl (C=O) O-atom with corresponding metal ions. The study will also give a better understanding on the electrolyte manner of these complexes. Electrochemical study was carried out on Cobalt(II), Copper(II) and Nickel(II) complexes to support the ion oxidation state. The redox manner of Cobalt(II), Copper(II) and Nickel(II) species has been probed by cyclic voltammetry. CV of the Copper(II) complexes exhibit a single quasi-reversible one electron oxidation process which attributed to Cu(II)/Cu(III) couple. While CV of the Cobalt(II) and Nickel(II) complexes show an irreversible anodic wave in the positive range which can be attributed to Cobalt(II)/Cobalt(III) and Nickel(II)/Nickel(III) processes.
Conflict of Interest
The authors declare that there is no conflict of interests regarding the publication of this paper.
Acknowledgment
We gratitude to chemistry department in college of science, University of Basra, Basra, Iraq for technical assistance and providing the necessary research facilities to accomplish this work.
References
- Uyar, Z.; Erdener, D.; Koyuncu, I.; Arslan, Ü.; JOTCSA, 2017, 4(3), 963-980.
- Ahmed, B. M.; Rudell, N. A.; Soto, I..; Mezei, G.; J. Org. Chem., 2017, 82(19), 10549–10562.
CrossRef - Girganokar, M. V.; Sgirodkar, S. G.; Res. J. Chem. Sci., 2012, 1, 110-116.
- Xavier, A.; Srividhya, N.; Journal of Applied Chemistry, 2014, 7(11), 06-15.
- Sherif, O. E.; Abdel-Kader, N. S.; Arabian Journal of Chemistry, 2018, 11(5), 700-713.
CrossRef - Zhang, C. X.; Cui, C.; Lu, M.; Yu, L.; Zhan, Y. X.; Synth React Inorg Met-Org Nano-Met Chem., 2009, 39, 136-138.
- Jambol, A. A.; Abdul Hamid, M. S.; Mirza, A. H.; Islam, M. S.; Karim, M. R.; International Journal of Organic Chemistry, 2017, 7, 42-56.
CrossRef - Abbasi, Z.; Salehi, M.; Kubicki, M.; Khaleghian, A.; Journal of Coordination Chemistry, 2017, 70(18), 3132-3146.
CrossRef - Salaam, S. S. A.; Mehveen, N.; EUROPEAN JOURNAL OF PHARMACEUTICAL AND MEDICAL RESEARCH, 2017, 4(8), 751-789.
- Quiruga, A.G.; Ranninger, C. N.; Coord. Chem. Rev., 2004, 248, 119-133.
CrossRef - Rai, B. K.; Kumari, R.; Oriental J. Chem., 2013, 29, 1163-1167.
CrossRef - Vigato, P. A.; Tamburini, S.; Bertolo, L.; Coord. Chem. Rev., 2007, 251, 1311-1492.
CrossRef - Lobana, T. S.; Sharma, R.; Bawa, G.; Khanna, S.; Coord. Chem. Rev., 2009, 253, 977-1055.
CrossRef - Reiss, A.; Chifiriuc, M. C.; Amzoiu, E.; Spînu, C. I.; Bioinorganic Chemistry and Applications, 2014, Volume 2014, Article ID 926287, 17 pages.
- Hearn, M. J.; Cynamon, M. H.; Chen, M. F.; Coppins, R.; Davis, J.; Kang, H. O.; Noble, A.; Tu-Sekine, B.; Terrot, M. S.; Trombino, D.; Thai, M.; Webster, E. R.; Wilson, R.; Eur J Med Chem., 2009, 44, 4169- 4178.
CrossRef - Ejidike, I. P.; Ajibade, P. A.; Bioinorganic Chemistry and Applications, 2016, Volume 2016, Article ID 9672451, 11 pages.
CrossRef - Ejidike, I. P.; Molecules, 2018, 23,1581.
- Scott, K.; Yu, E. H.; “Microbial Electrochemical and Fuel cells, Fundamentals and Applications”, 2016, Woodhead publishing series in energy: Number 88, Elsevier Ltd.
- Nicholson, R. S.; Wilson, J. M.; Olmstead, M. L.; “Theory of stationary Electrode polarography single scan and cyclic, 1964, 36(4), 706-723.
- Pandiarajan, M.; Rajendran, S.; bama, J. S.; Rathis, R. J.; Prabha, S. S.; Int J Nano Corr Sci and Engg., 2016, 3(4), 166 –180.
- Elgrishi, N.; Rountree, K. J.; MecCarthy, B. D.; “A practical Beginner, Guide to cyclic Voltammetry” J. Of Chemical Education, 2017.
- Saveant, J. M.; Elements of molecular and Biomolecular Electrochemistry: An Electrochemical Approach to electron transfer chemistry. John, Wiley &Sons. 2006, P. 455.
CrossRef - Batchelor-McAuley, C.; Kätelhön, E.; Barnes, E. O.; Compton, R. G.; Laborda, E.; Molina, A.; ChemistryOpen., 2015, 4(3), 224–260.
CrossRef - Masek, A.; Chrzescijanska, E; Kosmalska, A; Zaborski, M.; “Characteristics of compound in hops using cyclic voltammetry, UV-Vis, FT-IR, and GC-Mas analysis”. Food chemistry, 2014, 156, 353-361.
CrossRef - Idemudia, O. G.; Sadimenko, A. P.; Afolayan, A. J.; Hosten, E. C.; Bioinorganic Chemistry and Applications, 2015, 2015, Article ID 717089, 1-14.
- Canpolat, E.; Polish J Chem. 2005, 79, 619-625.
- Reiss, A.; Samide, A.; Ciobanu, G.; Dabuleanu, I.; J. Chil. Chem. Soc., 2015, 60(3), 3074-3079.
CrossRef - Khera, B.; Sharma, A. K.; Kaushik, N. K.; Polyhedron, 1983, 2, 1177-1180.
CrossRef - Sliverstein, R.; Bassler, G.; Morrill, T.; Spectrometric Identification of Organic Compounds, 2005, 7th ed. John-Wiley, New York.
- Kumar, V. A.; Sarala, Y.; Siddikha, A.; Vanitha, S.; Babu, S.; Reddy, A. V.; Journal of Applied Pharmaceutical Science, 2018, 8(04), 071-078.
- Elsayed, B. A.; Elhenawy, A. A.; Sultanah, A. S. A.; International Journal of Chemistry and Materials Research, 2014, 2(1), 1-16.
- Nakamoto, K.; Infrared of Inorganic and Coordination Compounds, 1997, 6th ed. John-Wiley, New York.
- Ahmed, A.; Lal, R. A.; Arabian journal of chemistry, 2017, 10, S901-S908.
CrossRef - Parkash, A.; Adhikari, D.; International J. of chem. Tech. Research, 2011, 3(4), 189-196.
- Silverstion, R. M.; Bassler, G. C.; “Spectrophotometric Identification of Organic Compounds” 2nd ed. John wiely, New York, 1967.
- Borthakur, R.; Kumar, A.; De, A. K.; Lal, R. A.; Arabian journal of chemistry, https://doi.org/10.1016/j.arabjc. 2014.12.040.
- Singh, K.; Thakur, R.; Kumar, V.; Journal of basic and applied sciences, 2016, 5, 21-30.
CrossRef - Lever, A. B. P.; INORGANIC ELECTRONIC SPECTROSCOPY (Studies in Physical and Theoretical Chemistry), Elsevier Science Ltd, 1984.
- Neelofar, Ali, N.; Khan, A.; Amir, S.; Khan, N. A.; Bilal, M.; Bull. Chem. Soc. Ethiop., 2017, 31(3), 445-456.
CrossRef - Martínez, L.; Quim. Nova, 2018, 41(7), 814-817.
- Kasprzak, M. M.; Erxleben, A.; Ochocki, J.; J. RSC Adv., 2015, 57, 45853-45877.
CrossRef - Lancashire, R. J.; “Stability, Chelation and the Chelation and Effect” Lecture 5. CHEM 1902 Coordination Chemistry. 2005, 1-5.
- Zhang, Y.; Xiang, L.; Wang, Q.; Duan, X. F.; Zi, G. Z.; Inorganica Chimica Acta, 2008, 361, 1254.
- Bosch, M.; Zhang, M.; Zhou, H. C.; Advances in Chemistry, 2014, Article ID 182327, 1-8.
- Halcrow, M. A.; Crystals, 2016, 6(58), 1-20.
- Wacker, M.; Seubert, A.; J. Anal. At. Spectrom., 2014, 29, 707-714.
CrossRef - Ulatowski, F.; Dąbrowa, K.; Bałakier, T.; Jurczak, J.; J. Org. Chem., 2016, 81(5), 1746–1756.
CrossRef - Khan, S. A.; Asiri, A. M.; Al-Amry, K.; Malik, M. A.; The Scientific World Journal, 2014, 1-9.
- Rizvi, M. A.; Russian Journal of General Chemistry, 2015, 85(4), 959–973.
CrossRef - Streeky, J. A.; Pillsbury, D. G.; Busch, D. H.; Inorg. Chem., 1980, 19, 3148.
CrossRef - Botcher, A.; Takeuchi, T.; Hardcastle, K.I.; Meade, T. J.; Gray, H. B.; Cwikel, D.; Kapon, M.; Dori, Z.; Inorg. Chem., 1997, 36, 2498.
CrossRef - Connick, P. A.; Macor, K. A.; Inorg. Chem., 1991, 30, 4654.
CrossRef - Shakir, M.; Bano, N.; Rauf, M. A.; Owais, M.; J. Chem. Sci., 2017, 129 (12),1905–1920.
CrossRef - Shiekh, R. A.; Rahman, I. A.; Malik, M. A.; Luddin, N.; Masudi, S. M.; Al-Thabaiti, S. A.; International Journal of Electrochemical Science, 2013, 8(5), 6972–6987.
- Ramírez-Delgadoa, V.; Manzanera-Estardaa, M.; García-Ramosb, J. C.; Hernández-Ayalab, L. F.; Flores-Alamob, L.; Ruíz-Azuarab, L.; Procedia Chemistry, 2014, 12, 115 – 120.
CrossRef - Bouwman, E.; Driessen, W. L.; Reedijk, J.; Smykalla, C.; Smits, J. M. M.; Beurskens, P. T.; Laschi, F.; Zanello, P.; Inorg. Chem., 1990, 29, 4881.
CrossRef - John, R. P.; Sreekanth, A.; Rajakannan, V.; Ajith, T. A.; Prathapachandra Kurup, M. R.; Polyhedron, 2004, 23, 2549–2559.
CrossRef - Bartyzel, A.; J Therm Anal Calorim., 2017, 127, 2133–2147.
CrossRef
Accepted on: 01-12-2018


![]()


