Emulsion Liquid Membrane Design in Vitro for Removal of Lead from Aqueous Solution
Masoud Nasiri Zarandi and Amirhossein Soltani
Faculty of Chemical, Petroleum and Gas Engineering, Semnan University, Semnan, Iran.
Corresponding Author E-mail: mnasiri@semnan.ac.ir
DOI : http://dx.doi.org/10.13005/ojc/340609
Download this article as:
![]()
The purpose of this study was to investigate the extraction of lead by emulsion liquid membrane as an effective alternative to conventional lead extraction methods. The emulsion included D-2-ethylhexyl phosphoric acid (D2EHPA) as a carrier, paraffin and kerosene composition as an organic solvent, Span 80 as an emulsifier and sulfuric acid as an internal stripping phase. In this project, 7 effective factors in extraction of lead were chosen by emulsion liquid membrane, which included concentration of sulfuric acid in the internal phase, volume ratio of the emulsion to external phase (Rew), the ratio of organic phase to internal phase (Roi), initial pH of external phase, contact time of the emulsion and external phase, carrier concentration and concentration of surfactant in the membrane phase. After the initial experiments to make a stable emulsion, membrane phase mix (70% paraffin and 30% kerosene), homogenizer speed (12000 rpm) and mixer speed (309 rpm) were selected. The final experiments were designed by Taguchi statistical method. Optimization was done according to higher extraction rate and the effect of each of these factors and their optimal values as well as optimal conditions were determined. By verification test, it was shown that more than 92% of lead can be extracted from a solution with a concentration of 2000 ppm.
KEYWORDS:Emulsion Liquid Membrane; Extraction; Lead; Taguchi Analysis; Wastewater
Industrial wastewaters contain high levels of heavy metals, including lead, which are highly toxic.1 Lead is also used as an essential raw material for manufacture of batteries, pigments, fuel, photographic materials and explosives.2,3 Learning and behavioral disorders in children, damage to liver, kidney and heart and impaired immune system result from lead contamination.4 There are various methods for removing heavy metals from industrial effluents, which include chemical and biological methods. These methods include chemical deposition, adsorption, ion exchange and solvent extraction, which are still in use. However, industries are looking for competitive alternative technologies which can overcome a number of major disadvantages of these methods. One of the promising methods for separating heavy metals from wastewater is emulsion liquid membrane process.3
Emulsion liquid membrane was first introduced in 1968 by Li and was initially most used in separation of hydrocarbons.5,6,7,8,9,10,11 Separation of zinc, copper, gold, chromium and compounds such as phenols was well done by a variety of liquid membranes. If downstream processes where separation and condensation are done both preferably in one step can be designed and implemented, considerable savings can be made. Liquid membranes have this potential, that is, they can perform purification and condensation in one step.3,12,13
In the emulsion liquid membrane, the membrane is actually a liquid phase in the form of emulsion (Fig 1). Emulsion liquid membranes are necessarily double emulsions, such as water/oil/water (w/o/w) systems, which is liquid membrane of the oil phase. The emulsion liquid membrane involves the receiver phase which is placed in the membrane phase and forms the emulsion, and this emulsion is dispersed again in the feed phase and forms a double or secondary emulsion. Components are absorbed from the feed phase in the membrane phase and penetrate into the receiver phase where they are ultimately discharged into.14,15
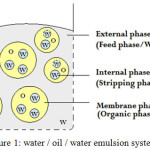 |
Figure 1: water /oil/ water emulsion system16 |
The operation performed in an emulsion liquid membrane separation process consists of four steps (Fig 2):2
Emulsification.
Dispersion of the emulsion in contact with the continuous external phase for extraction.
Deposition for separating emulsion from external phase.
Decomposition of emulsion for membrane phase retrieval.
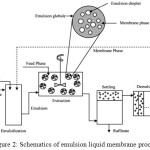 |
Figure 2: Schematics of emulsion liquid membrane process17 |
Taguchi’s method is a powerful statistical method for determining optimal arrangement of factors of a process, thereby achieving better process efficiency, reducing variability and producing better products. In fact, the strength of Taguchi’s method is to integrate statistical methods and engineering process. This method has been used successfully in industries such as machinery, plastics, metal processing, casting, etc.18
Experiments
Chemicals and Devices
Sanitary liquid paraffin with a specific gravity of 0.880-0.885 g/cm3 and a viscosity of 25-80 centipoise at 20℃ was obtained from the Dr. Mojalai Chemical Industrial Group. The non-ionic surfactant, Sorbitan monolith, the Span80 brand, and the cationic carrier D2EHPA were purchased from Sigma, America, and lead nitrate was purchased from Merck Company, Germany. Kerosene was bought from the market and was used without any additional process. Laboratory sulfuric acid was prepared with a purity of 98% from the Persian Chemical Industry Group.
A homogenizer, model SR30, Mtops, Korea, with variable speed of 3000-27000 rpm, was used for initial emulsification.
To disperse the emulsion made in the external phase, a mixer with maximum 3000 rpm, model MS280D, manufactured by Mtops Co., Korea, equipped with an anchor blade was used. A 250 ml glass beaker was used for the experiment. A pH-meter, model AZ-8685, AZ Co., was used for setting pH. To isolate emulsion from the external phase, a centrifuge, manufactured by Noavaran Tajhiz Company, 3000 rpm, was used. Atomic absorption apparatus, wavelength 217 nm, was used to measure lead content.
Procedure
The experiments carried out included the following steps:
Preparation of lead solution: a certain amount of lead nitrate purchased from Merck (331.21 g/mol Pb(NO3)2) was dissolved in distilled water to obtain a solution at a certain concentration.
Preparation of emulsion: In order to prepare an emulsion of water in oil, a certain amount of paraffin, kerosene, surfactant and carrier were mixed together; then, a solution containing a certain percentage of sulfuric acid as the internal phase which supplies the driving force required for extraction was added slowly for 5 min at 12000 rpm.
Extraction: the prepared emulsion was added to the external phase containing 2000 ppm lead solution and mixed at 309 rpm.
Sampling: after the start of mixing, samples were taken from the system at certain intervals. Sampling was done by laboratory syringes and then centrifuged to isolate the emulsion from the external phase. Then the centrifuged external phase was filtered to ensure complete removal of the emulsion.
Analysis: in order to avoid laboratory errors in measuring and improving accuracy of the experiment, the residual lead in the aqueous phase separated from each of the samples was measured by atomic absorption measurements at 217 nm wavelengths.
Emulsion decomposition: at the end of the experiment, mixing was stopped and the system was placed in idle for half an hour to separate the emulsion from the external phase. The method used for decomposing the emulsion was heat in a boiling water bath.
Optimization using Taguchi method: Using the Taguchi method and determining the effective parameters on the experiment, the number and conditions of the experiments were determined. The experiments were performed, the results were analyzed using the Qualitek-4 software and optimal conditions were determined with acceptable error rates. The final experiment was then carried out to confirm the obtained conditions, which was close to the estimated value through the Taguchi method.
Design of Lead Extraction Experiments
According to various works carried out from the first papers published to the latest studies, as well as the results of preliminary experiments on application of liquid membrane in extraction of heavy metals, particularly lead, the levels shown in Table 1 were selected for the factors mentioned.
Table 1: factors and levels selected in lead extraction experiment.
| Factors | Level 1 | Level 2 | Level 3 |
| H2SO4 (M) | 0.2 | 0.5 | 1 |
| Carrier (v/v %) | 1 | 3 | 6 |
| Rew | 0.5 | 0.2 | 0.1 |
| Roi | 1 | 2 | 4 |
| Surfactant (v/v %) | 2 | 4 | 8 |
| Time (min) | 7 | 14 | 21 |
| pH | 4.5 | 5 | 5.5 |
Assuming no interaction between the factors, degree of freedom was determined for each of the factors as follows:
f1 = f2 = f3 = f4 = f5 = f6 = f7 = 3-1 = 2
Total degree of freedom was 20 for these seven factors; accordingly, orthogonal array for this mode was L18.
Experiments were performed based on conditions determined by the Taguchi method, the results of which are shown in Table 2. Analysis of variance was used to determine the contribution of each of the factors in the response, which is generally used to analyze the statistical results. In addition to contribution of each of the factors, parameters such as degree of freedom, sum of squares of variances, net sum of squares and the ratio of variances are computed in this section and given in the ANOVA table.
Table 2: L18 array and results of lead extraction experiments with emulsion liquid membrane.
|
Extraction % |
pH |
Time |
Surfactant |
Roi |
Rew |
Carrier |
H2SO4 |
Experiment No. |
|
54.8 |
1 |
1 |
1 |
1 |
1 |
1 |
1 |
1 |
|
67.6 |
2 |
2 |
2 |
2 |
2 |
2 |
1 |
2 |
|
42.5 |
3 |
3 |
3 |
3 |
3 |
3 |
1 |
3 |
|
74.3 |
3 |
3 |
2 |
2 |
1 |
1 |
2 |
4 |
|
64.2 |
1 |
1 |
3 |
3 |
2 |
2 |
2 |
5 |
|
67.6 |
2 |
2 |
1 |
1 |
3 |
3 |
2 |
6 |
|
60.4 |
3 |
2 |
3 |
1 |
2 |
1 |
3 |
7 |
|
75.7 |
1 |
3 |
1 |
2 |
3 |
2 |
3 |
8 |
|
85.8 |
2 |
1 |
2 |
3 |
1 |
3 |
3 |
9 |
|
40.6 |
1 |
2 |
2 |
3 |
3 |
1 |
1 |
10 |
|
52.1 |
2 |
3 |
3 |
1 |
1 |
2 |
1 |
11 |
|
68.8 |
3 |
1 |
1 |
2 |
2 |
3 |
1 |
12 |
|
63.7 |
2 |
3 |
1 |
3 |
2 |
1 |
2 |
13 |
|
81.5 |
3 |
1 |
2 |
1 |
3 |
2 |
2 |
14 |
|
72.9 |
1 |
2 |
3 |
2 |
1 |
3 |
2 |
15 |
|
64.4 |
2 |
1 |
3 |
2 |
3 |
1 |
3 |
16 |
|
59.8 |
3 |
2 |
1 |
3 |
1 |
2 |
3 |
17 |
|
84.8 |
1 |
3 |
2 |
1 |
2 |
3 |
3 |
18 |
Discussion
Analysis of Results
Using the Taguchi software, each of the responses was analyzed considering the extraction rate as the desired system response. The average values of responses at each level of the factors and their main effects are shown in Table 3.
Table 3: average values of responses at each level of factors and their main effects.
| Factors | Level 1 | Level 2 | Level 3 |
| H2SO4 (M) | 54.4 | 70.7 | 71.816 |
| Carrier (v/v %) | 59.7 | 66.816 | 70.4 |
| Rew | 66.616 | 68.25 | 62.049 |
| Roi | 66.866 | 70.616 | 59.433 |
| Surfactant (v/v %) | 65.066 | 72.433 | 59.416 |
| Time (min) | 69.916 | 61.483 | 65.516 |
| pH | 65.5 | 66.866 | 64.549 |
Here, each of the factors are discussed separately.
Effect of Sulfuric Acid Concentration on the Internal Phase
The effect of sulfuric acid concentration (0.2-1 molar) on lead elimination efficiency is shown in Figure 3. The difference in hydrogen concentration between the internal and external phases is the driving force in emulsion liquid membrane process. When the concentration of hydrogen increases in the internal phase, the lead transfer rate is also increased.3 This increase, as shown in Figure 3, is significant by increasing the concentration of H2SO4 from 0.2 to 0.5 M. But after reaching a concentration of 0.5 M, further increase leads to slight increase in the amount of extraction. Because increasing the concentration of hydrogen also increases the total water transfer to the internal phase, ie osmotic swelling.6 The reason for this increase seems to be a large difference in osmotic pressure between the internal phase and the external phase.
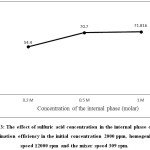 |
Figure 3: The effect of sulfuric acid concentration in the internal phase on lead elimination efficiency in the initial concentration 2000 ppm, homogenizer speed 12000 rpm and the mixer speed 309 rpm. |
Effect of Career Concentration in Membrane Phase
By increasing the carrier volume percentage in the membrane phase, stability of the emulsion decreases and lead extraction rate increases.3 As shown in Figure 4, the amount of lead extraction increases by increasing the carrier concentration from 1% to 3%, because the increase in carrier concentration significantly increases the initial flux content. The reason for lower increase in lead extraction rate by increasing concentrations from 3% to 6%, compared to its increase from 1% to 3%, can reduce viscosity of the membrane phase and water transfer by carrier molecules. Therefore, the slope of the second part of the curve is less than the slope of the first part, ie the effect of swelling and decomposition of emulsion increased by increasing carrier concentration.
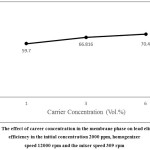 |
Figure 4: The effect of career concentration in the membrane phase on lead elimination efficiency in the initial concentration 2000 ppm, homogenizer speed 12000 rpm and the mixer speed 309 rpm. |
Rew Effect
Regarding the effect of volume ratio of the emulsion to the external phase, it can be claimed that extraction rate increases when volume ratio of the initial emulsion to the external phase increases, due to the increase in mass transfer as well as the increase in the amount of striping agent in the internal phase. However, further increase in this ratio leads to a decrease in quality of dispersion of the initial emulsion in the external phase, as well as a greater collision of emulsion cells and as a result swelling and decomposition of the emulsion.19,20 In Figure 5, the results of lead extraction from feed containing 2000 ppm lead are presented in three volumes: 0.1 (1:10), 0.2 (1: 5), and 0.5 (1:2). As the results of this section show, an increase in volume ratio of the emulsion from 0.1 to 0.2% increased lead elimination efficiency, while increase in this ratio from 0.2 to 0.5 slightly decreased elimination efficiency, because the cells had more contact with each other, which resulted in interconnection of the emulsion and, finally, decomposition of the emulsion.
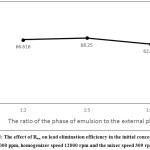 |
Figure 5: The effect of Rew on lead elimination efficiency in the initial concentration 2000 ppm, homogenizer speed 12000 rpm and the mixer speed 309 rpm. |
Roi Effect
Increase in volume ratio of oil to the internal phase means reducing the internal phase, reducing the number of droplets, resulting in lower internal mass transfer rates. By contrast, reducing this ratio means increasing the internal aqueous phase capacity for lead and reducing the resistance to penetration as a result of reducing the thickness of the membrane phase. Moreover, volume ratio of the oil phase to the internal phase can affect the surfactant concentration at the membrane/internal phase interface as well as the surfactant concentration in the membrane phase, which means increasing the osmotic swelling of the emulsion and, on the other hand, increasing its stability, that is, reducing the emulsion decomposition.9,15 Accordingly, the overall effect of Roi depends on contribution of each of the above factors. As shown in Figure 6, the amount of lead transfer increases with increasing Roi from 1 to 2. But this effect is quite evident with the increase in Roi from 2 to 4. By further increase in volume ratio of the oil phase to the internal phase to 4, the effect of increased swelling and reduced mass transfer considerably increases due to increased membrane thickness.
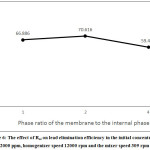 |
Figure 6: The effect of Roi on lead elimination efficiency in the initial concentration 2000 ppm, homogenizer speed 12000 rpm and the mixer speed 309 rpm. |
Effect of Surfactant Concentration in Membrane Phase
Theoretically, the amount of lead transfer decreases with increasing surfactant concentration, because viscosity is greater in the oil phase and therefore the mass transfer resistance is increased. On the other hand, the membrane stability, which has a very important effect on the extraction, should be considered. A proper amount of surfactant is required to prepare a stable emulsion membrane. Emulsion decomposition rate is reduced by increasing the amount of surfactant, as the more stable emulsion is formed. Moreover, increasing the surfactant concentration means reducing the interfacial tension between the membrane phase and the external aqueous phase and, on the contrary, increasing viscosity of the membrane phase. These two have opposite effects on swelling. It seems that the effect of interfacial tension is dominant in low concentrations of surfactant, while the effect of viscosity is dominant in high concentrations of surfactant.5,21 According to Figure 7, the amount of lead transfer increased with an increase in concentration of surfactant from 2% to 4% vol., which could be due to the greater stability of the emulsion. However, the amount of lead transfer dropped sharply with an increase in concentration of surfactant from 4% to 8% vol. This can be explained by the increased viscosity of the membrane phase and, consequently, the greater mass transfer resistance.
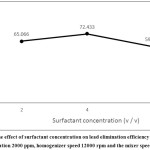 |
Figure 7: The effect of surfactant concentration on lead elimination efficiency in the initial concentration 2000 ppm, homogenizer speed 12000 rpm and the mixer speed 309 rpm.
|
Effect of Mixing Time of the Initial Emulsion and the External Phase
Increasing the mixing time of the initial emulsion and the external phase means increasing the lead transfer time. With increasing the mixing time, however, contact of the emulsion cells increases. Water also has more time to transfer to the internal phase; finally, the longer the process is, the emulsion is more likely to swell and decompose.6 It is therefore important to determine the appropriate time for separating the maximum lead content and, at the same time, the least amount of swelling and decomposition of the emulsion. As shown in Figure 8, there is a significant decrease in extraction time due to high swelling and high decomposition with an increase in the contact time of mixing from 7 min to 14 min. With increasing contact time of mixing to 21 min, however, the amount of extraction increases slightly. This indicates that the amount transferred was dominant to the leaked amount due to emulsion decomposition.
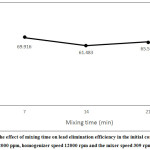 |
Figure 8: The effect of mixing time on lead elimination efficiency in the initial concentration 2000 ppm, homogenizer speed 12000 rpm and the mixer speed 309 rpm. Click here to View figure |
Effect of Initial pH of the External Phase
Since the carrier used is cationic, the lead must be cationic in order to be separated. In order to separate and concentrate more lead in the internal phase, the hydrogen difference between the internal phase and the external phase should be high. That is, pH must be low in the internal phase and high in the external phase.17,22 A small difference in the percentage of extraction in different pH values does not mean that it is trivial, but it shows that the pH changes have a little effect on extraction within the specified range.
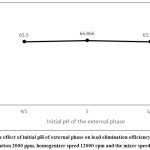 |
Figure 9: The effect of initial pH of external phase on lead elimination efficiency in the initial concentration 2000 ppm, homogenizer speed 12000 rpm and the mixer speed 309 rpm. |
The Taguchi Software is used to examine the effect of each of these parameters on the lead extraction rate and to optimize their levels at the highest possible extraction rate.
Table 4: ANOVA table.
| Factors | DOF | Sums of | Variance (V) | F-Ratio (F) | Pure Sum | Percent |
| (f) | Squars (S) | (s’) | P (%) | |||
| H2SO4 (M) | 2 | 1140.567 | 570.283 | 31.876 | 1104.785 | 39.401 |
| Carrier (v/v %) | 2 | 355.948 | 177.974 | 9.947 | 320.167 | 11.418 |
| Rew | 2 | 123.918 | 61.959 | 3.463 | 88.137 | 3.143 |
| Roi | 2 | 388.746 | 194.382 | 10.865 | 352.983 | 12.589 |
| Surfactant (v/v%) | 2 | 511.241 | 255.62 | 14.288 | 475.46 | 6=16.957 |
| Time (min) | 2 | 213.498 | 106.749 | 5.966 | 177.716 | 6.338 |
| pH | 2 | 16.272 | 8.136 | 0.454 | 0 | 0 |
| Other / Error | 3 | 53.671 | 17.89 | 10.154 |
According to Table 4, the pH factor has a slight effect on the system response; therefore, this factor can be discarded. As can be seen, the most important factors in the system response are H2SO4 concentration in the internal phase, concentration of surfactant in the membrane phase, Roi, carrier concentration in the membrane phase, mixing time, and Rew.
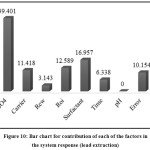 |
Figure 10: Bar chart for contribution of each of the factors in the system response (lead extraction). |
Table 5: Levels of factors to achieve optimal extraction rate.
| Factors | Level Description | Level | Contribution |
| H2SO4 (M) | 1 | 3 | 6.177 |
| Carrier (v/v %) | 6 | 3 | 4.761 |
| Rew | 0.2 | 2 | 3.611 |
| Roi | 2 | 2 | 4.977 |
| Surfactant (v/v %) | 4 | 2 | 6.794 |
| Time (min) | 7 | 1 | 4.277 |
| pH | 5 | 2 | 1.227 |
| Total contribution of all factors | 30.724 | ||
| Current grand average of performance | 65.638 | ||
| Expected result at optimum condition | 96.462 |
Conclusion
Using the Taguchi method, optimal levels of the considered factors and extraction rate in optimal conditions can be obtained.
The confirmation test was carried out according to the specified conditions and the extraction rate was 92.6%, which was well within the confidence interval (96.462%).
References
- Torkashvand, J.; Godini, K.; Azarian, G.; Rezaei Kalantary, R.; Younesi, S.; Gholami , M. psj. 2016, 14, 30-38
CrossRef - Gurel, L.; Altas, L.; Buyukgungor, H. Environmental Engineering Science. 2005, 22, 411-420.
CrossRef - Sabry, R.; Hafez, A.; Khedr, M.; Hassanin, A.E. Desalination, 2007, 212, 165-175.
CrossRef - Sreejslekshmi, K.G.; Anoop Krishnan, K.; Anirudhan, T.S. Journal of Hazardous Materials, 2009, 161, 1506-1513.
CrossRef - Kislik. V.S. Elsevier, B.V, Amsterdam. 2010, 141-190.
- Noah, N.F.; Othman, N.; Jusoh, N. Journal of Taiwan Institute of Chemical Engineers. 2016, 15, 1-8.
- Bechiri, O.; Ismail, F.; Abbessi, M.; Samar, M.E.H. Journal of Hazardous Materials, 2008, 152, 895.
CrossRef - Kargari, A.; Kaghazchi, T.; Sohrabi, M.; Soleimani, M. Iranian Journal of Chemical Engineering. 2006, 3, 77-91.
- Ng, Y.S.; Jayakumar, N.S.; Hashim, M.A. Journal of Hazardous Materials, 2010, 184, 255-260.
CrossRef - Kargari, A.; Kaghazchi, T.; Soleimani, M. Desalination, 2004, 162, 237.
CrossRef - Kulkarni, P.S.; Mukhopadhyay, S.; Bellary, M.P.; Ghosh, S.K. Hydrometallurgy. 2002, 64, 49.
CrossRef - Kulkarni, P.S.; Mahajani, V.V. Journal of Membrane Science, 2010, 335, 799.
- Kumbasar, R.A. Separation and Purification Technology. 2008, 63, 593.
CrossRef - Park, Y. Ph.D.Thesis, The Academic Faculty,School of Civil and Environmental Engineering, 2006, 9.
- Mortaheb, H.R.; Amini, M.H.; Sadeghian, F.; Mokhtarani, B.; Daneshyar, H. Journal of Hazardous Materials. 2008, 160, 582-588.
CrossRef - Bjorkegren, S.; Karimi, R.F.; Martinelli, A.; Jayakumar, N.S.; Hashim, M.A. Journal of Membranes. 2015, 5, 169.
- Ahmad, A.L.; Kusumastuti, A.; Derek, C.J.C.; Ooi, B.S. Chemical Engineering Journal. 2011, 171, 871.
- Antony, J.; Antony, F.J. Brows Jornals & Books, Work Study. 2001, 50, 141-149.
CrossRef - Mortaheb, H.R.; Kosuge, H.; Amini, M.H.; Mokhtarani, B.; Daneshyar, H.; Banihashemi, H.R.; Journal of Hazardous Materials. 2009, 165, 634.
CrossRef - Abasian, K.; Kargari, A.; Kaghazchi, T. Chemistry and Chemistry Engineering Journal of Iran. 2013, 32, 64.
- Zihao, W.; Yuanli, J.; Jufu, F. Journal of Membrane Science. 1996, 109, 25-34.
CrossRef - Raghuraman, J.; Tirmizi, P.; Kim, B.S.; Wiencek, M. Environment Science Technology. 1995, 29, 980-981.
CrossRef
Accepted on: 25-10-2018


![]()


