Electrochemical Investigation of Some Pharmaceutical Compounds at Mercury Electrode
A. A. Al-Owais1 and I. S. El-Hallag2
1Department of Chemistry, College of Science, King Saud University, Riyhad, Saudi Arabia.
2Deapartment of Chemistry, Faculty of Science, Tanta University, Tanta, Egypt.
Corresponding Author E-mail: i.elhallag@yahoo.com
DOI : http://dx.doi.org/10.13005/ojc/340623
Article Received on : 07-03-2018
Article Accepted on : 08-12-2018
Article Published : 07 Dec 2018
The present work aims to report the investigation of the electrochemical behavior of 3- arylazomethine-1,2,4-triazole derivatives in universal aqueous buffer series at mercury electrode. The electrode behavior of the studied compounds was performed via voltammetric studies, chronoamperometry, convoluted transforms, and dp polarography techniques. The relevant chemical and electrochemical parameters of 3- aryl azomethine -1,2,4- triazole derivatives were determined experimentally in universal aqueous buffer series as supporting electrolyte at mercury electrode. CPC was used for determination of the number of electrons to elucidate the mechanistic pathway of electrode reaction of aryl azomethine triazole compounds. Digital simulation method was used to confirm the accuracy of the experimental chemical parameters (homogeneous chemical rate constant) and electrochemical parameters (heterogeneous rate constant, symmetry coefficient and redox potential) via matching between the experimental and theoretical cyclic voltammograms.
KEYWORDS:Arylazomethine; Convolution Transforms; Digital Simulation; Pharmaceutical Compounds
Download this article as:| Copy the following to cite this article: Al-Owais A. A, El-Hallag I. S. Electrochemical Investigation of Some Pharmaceutical Compounds at Mercury Electrode. Orient J Chem 2018;34(6). |
| Copy the following to cite this URL: Al-Owais A. A, El-Hallag I. S. Electrochemical Investigation of Some Pharmaceutical Compounds at Mercury Electrode. Orient J Chem 2018;34(6). Available from: http://www.orientjchem.org/?p=53590 |
Introduction
The biological activity of aryl azomethine derivatives is well known and established in the literature.1 It has been used as antitumor,2 anticancer,3 antidiabatic,4 antiviral agents.5 Substituted aryl azomethine triazole have important applications in microbiology as bactericidal,6 and fungicidal effects7 and pharmacological activities8,9 in addition to their uses in ulcer treatment and prevention.10 and antihypertensive agents to lower blood pressure.11 Triazoles studies are also interested in many subjects because of their synthetic characteristics and other theoretical aspects.12 Azomethine prodrugs of (R) α- methylhistamine are potent histamine H3 receptors.13 Azomethines not only serve as a valuable tool for pharmacological studies related to histamine H3 receptors but also represent a promising approach to achieve therapeutic applications of histamine H3 receptors against (R) α – methylhistamines. Several Schiff base complexes of transition metals have been synthesized and studied at different electrodes.14-16 Azomethines have found additional uses as polymer organic frameworks (POFs) for H2 and CO2 sequestering.17,18 This is a result of their large surface area.19,20 They have further been used as epoxy-derivatives for the preparation of thermostable and thermoconductive polymers.21-23 The thermal stability of the azomethines is courtesy of the rigid imine bond. Their thermal stability and thermal conductivity have been exploited for use as electrical isolators and adhesives in motors, transformers and integrated circuits.
Azomethines have been used in plastic electronics such as organic field-effect transistors, photovoltaic devices, and electrochromic devices. For example, Sek et al. synthesized a series of triphenylamine (TPA) oligomers that are normally used as hole-transporting materials in organic light emitting diodes.24
Convolution transforms have been used in this work to assess the electrochemical data25-29 of 3- arylazomethine-1,2,4-triazole derivatives. The main advantage of this technique is the possibility of using all the data obtained from cyclic voltammetric experiment instead of only involving the data concerned with the peak magnitude. Convolutive transforms were found to provide high accuracy in mechanism diagnosis and rate constant determination. The inverse square root of time convolution or semi integral of the current is evaluated via the history dependent integral.26
The aim of the described work here is to reports the electrochemical behaviour of some 3- arylazomethine-1,2,4-triazole derivatives, which have a biological activity, at mercury electrode in universal buffer solution via various voltammetric methods in order to give some light on the elucidation of the mechanistic pathway and determination of the heterogeneous and homogeneous parameters of the investigated compounds.
Experimental
Chemicals
The compounds were prepared according to the procedure reported in literature.30 A stock solution of 2.5 x 10⁻³ M of each arylazomethine triazole compound was prepared in ethanol. Britton–Robinson31 buffers in the pH range 2 – 12 were prepared. The nomenclature and structure of the investigated compounds are indicated in scheme 1.
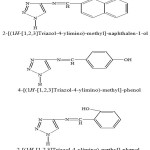 |
Scheme 1 |
Apparatus and Techniques
Cyclic voltammetric studies were carried out using the polarographic Analyzer (from EG & G) model 264 A and HMDE (hanging mercury drop electrode) with a surface area 2.6×10⁻⁴ m2, model 303A, as working electrode, Ag/AgCl as a reference electrode and Pt wire as a counter electrode. Data processing and digital simulations were performed using a software package (EG & G) Condecon-Condesim (EG & G). Coulometric measurements for calculation the number of electrons was performed using digital coulometer model 179 (from EG & G).
Controlled Potential Coulometry (CPC) Measurements
The charge accumulated during the electrolysis of the compounds is given by the relation:
Q = nFW/M (1)
Where F is the Faraday constant (96485 Coulombs/ equivalent) and the other symbols have their usual meaning.
In CPC measurements, firstly the condenser current of the inert electrolyte was measured after application of a stream of N2 gas to the working electrode (mercury pool) then the measurements continued until the background current exhibits a constant value of charge. Then 0.5 ml of the aryl azomethine derivatives solution (1×10⁻³ M) was introduced to the coulometry cell, the potential was selected at the top of the voltammetric peak current, and the electrolysis process was run until constancy the current. The amount of consumed charge (Q) was recorded directly from coulometer and the obtained data were given in Table 1 indicate that the cathodic reduction process consumed two electrons /depolarizer molecule.
Table 1: Indicates the values of the number of electrons involved in mechanistic pathway via CPC.
| Compound | Substituent | pH | wt x 104, g | -E,V | Q x 102, C | n |
| I | m-OH-naphthol | 3.1 | 1.58 | 1.1 | 12.68 | 1.98 |
| 8.4 | 1.75 | 1.5 | 13.83 | 1.95 | ||
| II | m-OH-phenol | 3.0 | 1.19 | 1.2 | 20.58 | 2.1 |
| 8.2 | 1.87 | 1.62 | 19.09 | 1.99 | ||
| III | o-OH-phenol | 3.1 | 1.32 | 1.28 | 12.80 | 1.89 |
| 8.4 | 1.67 | 1.61 | 16.45 | 1.92 |
Where wx104 is the weight of aryl azomethine triazole compound, Qx102 is the number of charge in coulomb and n is the number of electrons involved in the reaction.
Results and Discussion
Cyclic Voltammetry and Convolutive Voltammetry
Figure 1 indicates an example of cyclic voltammograms of the investigated aryl azomethine triazole compounds in universal B.R. buffer solution at pH 3.1 and at scan rates 200, 500 and 1000 mV.s-1. It was found that the compounds under consideration exhibit one well-defined cathodic peak at scan rates ≤ 500 mV.s-1, while at scan rates more than 500 mV.s-1 the voltammograms exhibit a small anodic peak in the reverse scan confirming a fast chemical reaction follow and coupled with electron transfer. Also, the shift of Ep to more negative potential and increasing the difference between Ep and Ep/2 (Ep –Ep/2) values with scan rate confirm the sluggish of charge transfer.32
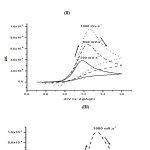 |
Figure 1: Cyclic voltammograms of the investigated aryl azomethine triazole compounds (I), (II) and (III) in B.R. buffer solution at pH 3.1 and at various scan rates. |
It was observed that the potential of the cathodic peak (Ep) varies with the logarithmic of scan rate according to the eq.(2).33
Ep = -1.14(RT/αnaF) + (RT/αnaF) ln (kf,h/D1/2) – (RT/2αnaF) ln (αnav) (2)
Linear correlations were obtained on plotting of Ep vs. log v, and the cathodic symmetry coefficients (α) were calculated from the slopes of these plots at the selected pH values. Also, the symmetry coefficients (α) were calculated from the following equation34:
Ep – Ep/2 = 1.857 (RT/αnaF) (3)
and were found to be less than 0.5 when na = 1 (Table 2), confirming the sluggish nature of the reduction reaction.
Table 2: Values of half peak width (Ep-Ep/2) and transfer (α) of the aryl azomethine triazole compounds under investigation at pH’s 3.1 & 8.4, T = 250C, and v = 0.5 V.s-1.
| Compound | pH | Mol. wt | Ep – Ep/2 | α(na = 1) |
| I | 3.1 | 238 | 123 | 0.39 |
| 8.4 | 137 | 0.35 | ||
| II | 3.0 | 188 | 115 | 0.41 |
| 8.2 | 127 | 0.37 | ||
| III | 3.1 | 188 | 111 | 0.43 |
| 8.4 | 123 | 0.39 |
For irreversible charge transfer,35 the peak current (ip) can be related to the square root and the concentration of the depolarizers (1.25 x 10⁻⁴ M) via the following equation:
ip = 2.99 x 10⁵ n (αna)1/2 AD1/2Cv1/2 (4)
At different pH values, it was noted that the investigated compounds exhibit diffusion character of the current with some adsorption contribution due to a slight deviation from the origin of ip vs. v1/2 plot.36 At scan rate ≥ 1000 mV.s-1 the heterogeneous rate constant (ks) was computed from the voltammograms using the peak potential separation, ΔEp, versus dimensionless parameters constants ψ.37,38 (Table 3).
Table 3: Values of ks determined experimentally and theoretically of aryl azomethine triazole compounds under consideration at 25oC.
| Compound | pH | ks x104 (cm.s-1) | ||
| Ref.39 | Ref.40 | Simulated method | ||
| I | 3.1 | 6.2 | 5.8 | 6.4 |
| 8.4 | 4.8 | 4.6 | 4.1 | |
| II | 3 | 5.7 | 5.5 | 5.4 |
| 8.2 | 3.1 | 2.9 | 2.8 | |
| III | 3.1 | 5.9 | 6.1 | 6 |
| 8.4 | 4.1 | 4.2 | 4.4 |
I1 convolution39-41 was used for determination of mass transfer coefficient of the electroactive aryl azomethine triazole compounds from Eq. (5)42:
Ilim = nFAC/√ (D)1/2 (5)
where Ilim is the value of I1 transforms at extreme potential past the peak, the other symbols have their known definition. The mass transfer coefficients (D) of the investigated aryl azomethine triazole compounds were computed via Eq. (5) and cited in Tables 4. The I1 vs. E plot which shown in Fig. 2 exhibits a large distance between the reductive and oxidative sweep which confirms the sluggish kinetics of the two electrons transferred. Also, the reverse sweep does not return to initial current (i = 0) due to a fast chemical process following the electron transfer.
Table 4: Mass transfer coefficient (D) of the aryl azomethine triazole compounds computed via different methods at 25oC.
| Compound | pH |
Dx106 cm2.s-1 |
||
| A* | B | C | ||
| I | 3.1 | 5.3 | 5.7 | 5.2 |
| 8.4 | 4.6 | 4.3 | 4.8 | |
| II | 3.0 | 6.8 | 6.7 | 6.9 |
| 8.2 | 3.1 | 2.9 | 2.8 | |
| III | 3.1 | 5.9 | 6.1 | 6.0 |
| 8.4 | 4.1 | 4.2 | 4.4 | |
*A Values determined from CV via Eq. (4), B From Ilim via eq. (5), and C via eq. (6).
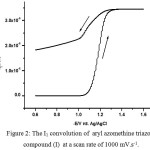 |
Figure 2: The I1 convolution of aryl azomethine triazole compound (I) at a scan rate of 1000 mV.s-1. |
The Equation used to determine the mass transfer coefficient (D) of aryl azomethine triazole compounds is the following one43,44:
Ilim = ip/3.099(α na v)1/2 (6)
Chronoamperometry
Chronoamperometry experiments were carried out by stepping the potential from the initial potential (-0.6 V) to final potential till -1.20 V and the current was plotted versus time. The captured chronoamperograms of 2.5×10 -4 mol L-1 solution of the aryl azomethine triazole compounds (I -III) were recorded at a glassy carbon electrode. Figure 3 shows the i – t plot of aryl azomethine triazole compound (I) which reveals that the current decreases with increasing the time of the experiment.
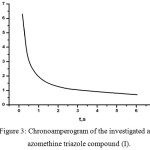 |
Figure 3: Chronoamperogram of the investigated aryl azomethine triazole compound (I).Click here to View figure |
As indicated the current was transited from initial potential to the steady-state reaction, controlled by the rate of mass transfer of the reduced aryl azomethine triazole compounds toward the surface of electrode according to Cottrell equation described by equation (7),45
i = nFAC√D/√πt (7)
where; i, the current; n, the number of electrons involved; F, Faraday constant; D, mass transfer coefficient; Cbulk, concentration of the species in the bulk and t, time. The presentation of i vs 1/√t exhibits linear plot and the mass transfer coefficient was determined from its slope (Table 5).
The kf (forward rate constant), of the investigated aryl azomethine triazole compounds was calculated from equation 8,45
(t) = – βI1 + u (8)
where u = nFSCbulkkf(D)1/2 and β = kf(D)1/2. From the slope and the intercept of i(t) vs. I1 at I1 = 0, the magnitude of kf can be obtained.
The variation of the heterogeneous rate constant with the electrode potential is presented using Butler-Volmer relationship.via equation (9)46
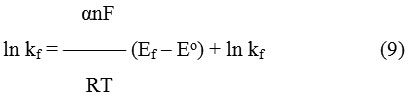
The transfer coefficient, α, was calculated from the slope of ln kf vs. (Ef – Eo) plot which derived from Butler-Volmer equation and found to be 0.31± 0.02, while ks value (standard rate constant) was 6.3×10⁻⁴ ± 0.1 cm s-1 (Table 5).
Table 5: Values of ks, D and α of the compounds under consideration determined from chronoamperometry experiments at 22oC.
| Compound | pH | ks x 104 (cm. s-1) | Dx106 (cm2.s-1) | α |
| I | 3.1 | 6.3 | 5.6 | 0.32 |
| 8.4 | 4.7 | 4.5 | 0.29 | |
| II | 3.0 | 5.8 | 5.2 | 0.31 |
| 8.2 | 3.6 | 4.1 | 0.27 | |
| III | 3.1 | 6.5 | 5.9 | 0.30 |
| 8.4 | 4.4 | 4.6 | 0.28 |
Digital Simulation
In this work, numerical simulation method was used for examining the values of the heterogeneous and homogeneous parameters determined experimentally via various electrochemical techniques as well as knowing the true nature of mechanistic pathway of the electrode reaction. In general the matching between the theoretical voltammograms with the captured one, confirm the accuracy of the determined parameters.47,48 The generated cyclic voltammograms have been performed using Condesim software Package supplied from EG & G.
In this article, the mechanistic pathway of the compounds under consideration was determined from a digital simulation for the following models: i- ErevCrer; ii- ErevCirr; and iii- EqCirr (Figure 4). As shown the difference between the captured cyclic voltammograms (Figure 1) and the generated models of ErevErev & ErevCirr (Figure 4) confirming the validity and accuracy of the proposed Eq Cirr mechanism.
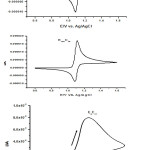 |
Figure 4: Simulated cyclic voltammograms of ErevCrev, ErevCirr & EqCirr. |
The following are the electrochemical parameters used in simulation process:
i- mass transfer coefficient of triazole compounds (D); ii- standard electrode potential (E0); iii- initial concentration of the arylazomethine triazole compounds (C mol.l-1); iv- standard heterogeneous rate constant (ks, cm.s-1); v- scan rate (V.s-1); vi- temperature (K-1); vii- homogeneous chemical rate constant (kc s-1); and the cathodic symmetry coefficient (αc).
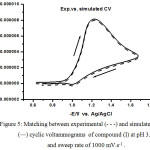 |
Figure 5: Matching between experimental (- – -) and simulated (―) cyclic voltammograms of compound (I) at pH 3.1 and sweep rate of 1000 mV.s-1. |
Figure 5 exhibits well matching between the experimental voltammograms and the theoretical voltammograms of EqCirr model of the aryl azomethine triazole compound (I) at pH 3.1 and a scan rate of 1000 mV.s-1. Table 6 shows the measured values of the experimental and theoretical electrochemical parameters which indicate the validity and the accuracy of the electrochemical parameters calculated from the experimental techniques.
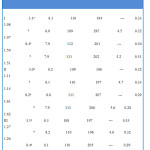 |
Table 6: Values of peak characteristics, kc, α, and E0 determined via theoretical and experimental work at a sweep rate of 1000 mV.s-1.Click here to View table |
The kinetic convolution I2 was used for determination of homogeneous chemical rate constant (kc). This procedure was done via introducing different values of kc until a value is obtained that returns I2 to zero at the end of the return sweep. A diagrammatic examples of the function I2 – E plot at the true value of kc is shown in Fig. 6. The true kc valueof the chemical step is 4.5 s-1 for the aryl azomethine triazole compound I at pH 3.1 (Table 6).
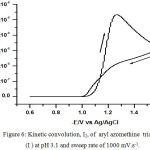 |
Figure 6: Kinetic convolution, I2, of aryl azomethine triazole (I) at pH 3.1 and sweep rate of 1000 mV.s-1. |
Differential Pulse Polarography
The differential pulse polarographic parameters of the aryl azomethine triazole compounds under investigation (Ep, w1/2) are found to be pH – dependent, indicating that the H+ ions are participating in the electrochemical reaction35 (Table 7). Figure 7 shows the dp-polarogram of the azomethine triazole compound (I) recorded at pH 3.1. Experimental investigation of aryl azomethine triazole compounds under consideration revealed that increased irreversibility of the electrode reaction with increasing the half peak height (w1/2), the pH of the medium and /or molecular weight of the investigated aryl azomethine triazole compounds35 Table 7.
Table 7: Data obtained from dp polarography of the investigated aryl azomethine triazole compounds at 25oC.
| Compound | Mol. wt | pH | w1/2 | -Ep, mV |
| I | 238 | 3.1 | 122 | 1.23 |
| 8.4 | 139 | 1.59 | ||
| II | 188 | 3.0 | 112 | 1.18 |
| 8.2 | 129 | 1.49 | ||
| III | 188 | 3.1 | 109 | 1.17 |
| 8.4 | 125 | 1.42 |
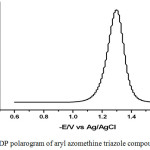 |
Figure 7: DP polarogram of aryl azomethine triazole compound I at pH 3.1. |
Mechanistic Pathway
Controlled potential coulometry experiments revealed that the electrolysis process of the aryl azomethine triazole compounds (I, II, and III) consumed 2 electrons / molecule in acidic, neutral and alkaline solutions.
IR (KBr optics) spectrum of the products of electrode reaction due to saturation of the active group produce a broad band at ~ 3315 cm-1 (stretching) confirming the finger print of CH2-NH-) group in the products. All these experimental evidence indicate that the electrode reduction pathway consumes two-electron which convert the initial active aryl azomethine triazole species to an inactive aryl azomethine triazole compounds due to the secondary amine group (CH2-NH-).
According to above, the reduction of the investigated compounds occurs on the – N = C- center in two irreversible consecutive one – electron transfer, the potential of which overlap i.e E01 = E02. It is assumed that the electron transfer is preceding by a fast proton addition then followed by another protonation i.e. H+, e–, e– , H+ which is confirmed from the shift of E0 with an increase in pH. Also from this behavior, it was concluded that the azomethine group is reduced in the protonated form to give anion radical in the first step and the second step is corresponding to the formation of secondary amine.
The obtained results indicated that the mechanism of the electrode pathway of some 3- arylazomethine-1,2,4-triazole derivatives can be summarized as follows.
Ar- N = CH – Ar’ – OH + H+ == Ar- +N(H) – CH – Ar’ -OH 1
+ e– == Ar- N(H) – .CH – Ar’- OH 2
+ e– + H+ == Ar-CH2NHAr‘ – OH 3
Ar-CH2NHAr‘ – OH === Ar-CH2NHAr‘ = O + H+ 4
Ar = triazole ring and Ar’-OH = o-naphthalene, p-hydroxy phenol and o-hydroxy phenol.
As shown the mechanistic pathway of electrode reaction proceeds in the sequence H+, e–, e–,H+, i.e EEC mechanism.
Conclusion
The electrochemical behavior of some pharmaceutical compounds was studied in universal aqueous buffer series at mercury electrode using cyclic voltammetry, chronoamperometry, convolution & deconvolution transforms, and dp polarography techniques. The number of electrons participating in electrode reaction was determined for elucidation of the mechanistic electrode pathway. Digital simulation method was used to confirm the nature of electrode reaction and the accuracy of the experimental chemical and electrochemical parameters via matching between the experimental and theoretical cyclic voltammograms.
Acknowledgements
This project was supported by King Saud University, Deanship of Scientific Research, College of Science, Research Center.
References
- Raman N, Dhaveethu Raja J. J Chem Sci, 2007, 119, 303.
CrossRef - Virtoneon AI, Heitala PK. Acta Chem Scand, 1960, 14, 499.
CrossRef - Messeder JC, Tinovo LW, Souza EM, Rita RS, De Castro SL. Bioorg Med Chem Le, 1995, 24, 3079.
CrossRef - Fuchigami T, Sano M, Lio K. J. Electroanal. Chem. 1994, 369, 255.
CrossRef - Huntley AC, Walter RMJ. J. Med. Chem. 1990, 21, 257.
- Patti SA, Bodiger BM, Kudasi SM, Kulkarni NH. J. Indian Chem. Soc. 1984, 61,713.
- Ram VJ, Dube V, Pieters IAC, Vlietinck AJ. J. Heterocyclic Chem. 1989, 26, 625.
CrossRef - Kane JM, Dudley MW, Sorenson SM, Miller FP, J. Med. Chem. 1988, 31, 1253.
CrossRef - Sung S, Lee A. J. Heterocyclic Chem. 1992, 92, 1101.
CrossRef - Sinha AK, Rastogi SN, Patnaik GK, Srimal RC. Indian J. Chem. 1993, B32, 738.
- Leelerc G, Amlaiky A, Rout B. Eur. J. Med. Chem. 1989, 17, 69.
- Deeth RJ, Langford SA, J. Chem. Soc. Dalton Trans. 1995, 1.
CrossRef
- Lund H, Acta Chem. Scan.1959, 13, 249.
CrossRef - Zhang M, Gorski W, Anal Chem. 2005, 77, 3960.
CrossRef - Jain R, Padamaja P, Gupta S, Can. J. Chem. 1997, 75, 567.
CrossRef - Sadler JL, Bard AJ, J. Am. Chem. Soc. 1968, 90, 1979.
CrossRef - Kerneghan PA, Halperin SD, Bryce DL, Maly KE, Can. J. Chem. 2011, 89, 577.
CrossRef - Uribe-Romo F.J, Doonan CJ, Furukawa H, Oisaki K, Yaghi OM. J. Am. Chem. Soc. 2011, 133, 11479.
CrossRef - Pandey P, Katsoulidis AP, Eryazici I, Wu Y, Kanatzidis MG, Nguyen ST, Chem. Mater. 2010, 22, 4974.
CrossRef - Uribe-Romo FJ, Hunt JR, Furukawa H, Klöck C, O’Keeffe M, Yaghi OM, J. Am. Chem. Soc. 2009, 131, 4570.
CrossRef - Pattakaran RLR, Burkanudeen AR, Polym-Plast. Technol. 2012, 51, 140.
- Zhang XH, Huang LH, Chen S, Qi GR, Express Polym. Lett. 2007, 1, 326.
CrossRef - Ayesha SZ, Ahmad Z, Muhammad IS, Polym. Degrad. Stab. 2010, 95, 1826.
CrossRef - Sek D, Grabiec E, Janeczek H, Jarzabek B, Kaczmarczyk B, Domanski M, Iwan A. Opt Mater. 2010, 32, 1514.
CrossRef - Imbeaux JC, Saveant JM, J. Electroanal. Chem. 1970, 44, 169.
CrossRef - Oldham KB, Zoski GD, Anal. Chem. 1980, 52, 2116.
CrossRef - Neudeck A, Dittrich J, J. Electroanal. Chem. 1989, 264, 91.
CrossRef - El-Hallag IS, Ph.D. Thesis, Tanta University, Egypt 1991.
- Woodard FE, Goodin RD, Kinlen PJ, Anal. Chem. 1984, 56, 1920.
CrossRef - Struve G, J. Parkt. Chem.1894, 50, 295.
- Zuman P, ”The elucidation of organic electrode processes”, Academic Press, 1969,115.
- Koltheff LM, Lingance JJ, Polarography, New York, Interscience, 1952, 319.
- Meites L, In Polarographic techniques. 4th Ed. Interscience Publishers Inc., New York, 1965, 240-248.
- Nicholson RS, Shain I, Anal. Chem.1964, 36, 706.
CrossRef - Delahay P, J. Am. Chem. Soc. 1953, 75, 1190.
CrossRef - Bard AJ, Faulkner LR, In Electrochemical methods fundamentals and applications. John Wiley, New York, 1982, 218.
- Nichlson RS, Anal. Chem. 1965, 37, 1351.
CrossRef - Al-Owais AA, El-Hallag IS, Al-Harbi LM, El-Mossalamy EH, Qar HA, J New Mat. for Electrochem. Sys. 2014, 17,17.
- Obaid AY, El-Mossalamy EH, Al-Thabaiti SA, El-Hallag IS, Hermas AA, Asiri AM, Int. J. Electrochem. Sci. 2014, 9, 1003.
- Al-Owais AA, El-Hallag IS, ScienceAsia, 2016, 42, 114.
CrossRef - Ghanem MA, El-Hallag IS, Mayouf AM, J. New. Mat. Electrochem. Sys. 2017, 25, 20.
- Blagg A, Carr SW, Cooper GR, Dobson ID, Gill JB, Goodal DC, Shaw BL, Taylor N and Boddington T, J. Chem. Soc. Dalton Trans 1985, 1213.
CrossRef - El-Mossalamy EH, Obaid AY, El-Daly SA, El-Hallag IS, Asiri AM, Al-Harbi LM, J. New. Mat. Electrochem. Sys. 2015, 53, 16.
- Alford PD, Goto M, Oldham KB, J.Electroanal. Chem. 1977, 49, 1390.
- Ghanem MA, El-Hallag IS, J. New. Mat. Electrochem. Sys. 2015, 121, 18.
- Saveant JM, Tessier D, Electranal. Chem. 1975, 61, 251.
CrossRef - Al-bishri HM, El-Hallag IS, El-Mossalamy EH, J. New. Mat. Electrochem. Sys. 2011, 14, 51.
- El-Hallag IS, El-Mossalamy EH, Asiri AM, Iran. J. Chem. Chem. Eng. 2012, 31, 9.

This work is licensed under a Creative Commons Attribution 4.0 International License.
![]()
A New Edition of Web of Science
Journal Impact Factor
2022: 0.5
Five Year: 0.8
Journal is Indexed in

Cabells Whitelist
![]()


