Dispersion of SiO2 Nano Particles on Epoxy Based Polymer Nano Composites and its Characterization
Krishan Kumar Patel and Rajesh Purohit
Department of Mechanical Engineering, Maulana Azad National Institute of Technology, Bhopal-462003, India.
Corresponding Author E-mail: krishan.patel4@gmail.com
DOI : http://dx.doi.org/10.13005/ojc/340641
Article Received on : 31-08-2018
Article Accepted on : 30-10-2018
Article Published : 03 Nov 2018
In present work we developed and characterized the thermosetting epoxy polymer nano composites containing different weight percentage (wt. %) of SiO2 nano particles ranging from 1 to 4 wt. % were prepared through solvent casting route. grain analysis, FTIR, shape recovery, impact stress, tensile, flexural strength and hardness were studied. The properties of composites were improved at 3 wt. % SiO2 nano particles, further loading of nano particles beyond 3 wt. % properties goes to suppressed which may depends on the dispersion of particles within matrix. Shape recovery test was done in this epoxy which may open the new gate for low cost shape memory polymer as we can say novelty of this experiment. The distribution and size of nano particles in epoxy based polymer matrix were examined through AFM analysis finally outlined.
KEYWORDS:Epoxy; AFM etc; FTIR; Nano particles; Polymer; SiO2
Download this article as:| Copy the following to cite this article: Patel K. K, Purohit R. Dispersion of SiO2 Nano Particles on Epoxy Based Polymer Nano Composites and its Characterization. Orient J Chem 2018;34(6). |
| Copy the following to cite this URL: Patel K. K, Purohit R. Dispersion of SiO2 Nano Particles on Epoxy Based Polymer Nano Composites and its Characterization. Orient J Chem 2018;34(6). Available from: http://www.orientjchem.org/?p=51959 |
Introduction
Epoxy based composites materials are gaining popularities in the world wide in last decades because of its light weight, ease of fabrications, excellent electrical insulator, high water and chemical resistance, low price and excellent heat and moisture resistance.1-2 Polymer nano composites are widely accepted materials for researchers now days. Polymers are material which exhibits excellent properties from other metallic and ceramics materials.3 Polymer materials are the much light in weight, very good corrosion resistance capacity, electrical insulator, water resistance, ease of fabrication but low in strength. So that for improving the strength of polymers secondary phase high strength nano particles and fibre introducing inside the polymer matrix as desired proportions.4 Epoxy based polymers nano composites is a high performance of thermosetting which is widely used in aerospace, medicals appliances, automobiles, industries and robotics now a days worldwide.5-7 Whenever epoxy polymer has low strength, toughness, hardness due to their highly cross linked structures.2,8,9 This cross link structures promotes the brittle behavior resulting the crack initiating and growth. For improving the properties of epoxy polymer micro and nano particles of SiC, TiC, and SiO2 were reinforced into the matrix.10-12 Many researches,8,9,11 also reported that, by reinforcing suitable natural fiber such as sisal, bamboo, banana etc. enhance the mechanical properties of polymer composites. Reinforcing the nano particles in polymer matrix gives better results within the 3 wt. %, further increasing the reinforcement of nano particles the properties suppressed due to agglomeration of particles.4,11 An addition of SiC, TiC, SiO2 nanofillers in epoxy matrix leads to enhance the mechanical properties of base polymer, specially toughness, tensile strength, flexural strength etc. the properties of nano composites strongly depends on the dispersion and loading weight percentage of nano particles.12 The addition of nano fillers tends to increase the interface area as compared with the ordinary polymers.13 This large interfacial area creates a large volume fraction of interfacial composites with the different properties from the bulk polymers even at the very low percentage of nanofillers1, 9,13 In present work, an attempt has been made to dispersion of SiO2 nano particles in epoxy polymer matrix by homogeneous dispersion of nano particles by ultra-sonication and followed by magnetic stirrer and the effect of particles loading within the matrix and their dispersion on mechanical properties.
Experiment and Materials
In present experiment the three components thermosetting hardener (HY951) and resin (LY556), and nano size silicon oxide particles (SiO2) with size 15-35 nm. These were purchased which is supplied by Nano Shel Pvt. Ltd. India. As suggested by supplier the glass transition temperature of this epoxy was 70°C and mixing ration resin: hardener is 15:1. Both the epoxy resin and hardener were pre sintered at 70°C in muffle furnace to reduce the viscosity for 30 minutes. To make the desired proportional SiO2 nano particles is added various weight percentage (wt. %) ranging from 1 to 4 wt. % with hardener. And then desired proportion of SiO2 nano particles were mixed in pre sintered hardener with the help of magnetic stirrer for 30 minutes. To facilitate a homogeneous mixing of nano particles mixed solution is placed in ultrasonic bath for 30 minutes at 70 °C after the magnetic stirring. After that the resin is mixed with solution as desired proportion 1:15 with magnetic stirrer for 2 minutes and then suddenly cure in die to facilitate desire shape and size at room temperature and left for 24 hours then samples removed from die.
Characterization and Testing Instruments
Fourier-transform infrared (FTIR) spectroscopy (type IR Tracer-100 / shimadzu co. / USA) analysis was done at Sagar Institute of Research and Technology (SIRT), Bhopal. AFM was carried on NT-MDT NEXT Solver (make-Russia) at Physics Laboratory of M.A.N.I.T, Bhopal. Tensile properties of polymer composites were measured by using (Tinius Olsen, model 50ST, Redhill, UK) with loading rate 4 mm/ min at room temperature. Scanning electron microscopy (SEM) facility used in MSME department MANIT Bhopal. Impact, tensile strength, hardness were tested at CIPET Bhopal MP.
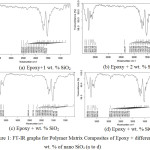 |
Figure 1: FT-IR graphs for Polymer Matrix Composites of Epoxy + different wt. % of nano SiO2 (a to d). |
Results and Discussions
FT-IR Analysis
FTIR spectroscopy is used to examine intermolecular hydrogen bonding of polymer matrix with silica. The observations have been evaluated as shown in Fig. 1.
Peak shift from 1693 to 1698 cm-1and 3744 to 3748 cm-1 respectively which directly insure that occurrence of hydrogen bonding between the –OH and –C=O.
The vibrational frequency of Si-OH sift from 3837 to 3896 cm-1 which is suggested that involvement of silica in epoxy matrix.
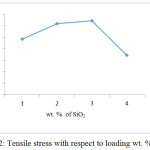 |
Figure 2: Tensile stress with respect to loading wt. % of SiO2 |
In the Fig. 2 clearly shows that the tensile stress increases with the loading percentage of nano SiO2 particles within the epoxy polymer matrix. The increase of strength is due to the reinforcing the high strength of nano particles. Further increasing the nano particles beyond 4 wt. % the tensile strength was suppressed due to the agglomeration of nano particles in the matrix. Similar observations were also reported by several researchers.9,11 The tensile strength of epoxy composites was highest at 3 wt. % nano SiO2 reinforcement. The distribution of nano particles were homogeneous at 3 wt. % clearly seen in AFM and SEM image.
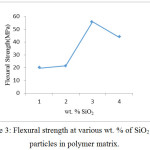 |
Figure 3: Flexural strength at various wt. % of SiO2 nano particles in polymer matrix. |
Flexural test results also shows Fig. 3 similar trend just like tensile test and impact test results, flexural load and strength increased upto 3 wt. % loading of SiO2 in epoxy/nano SiO2 polymer nano composite. On further loading the polymer epoxy based matrix with 4 wt. % of SiO2 the flexural properties decreased. Reason that can be interpreted for the decreasing trend at high loading is the lack of homogeneity of distribution of reinforcement in the matrix and due to formation of agglomerations as seen by grain analysis under AFM. This decrease can also be attributed to the trapped bubbles and weak boundaries between matrix and nanoparticles. Flexural test result was lowered by adding 4 wt. % nano SiO2 in epoxy polymer matrix. This may be because of weak interaction between epoxy and nano SiO2 particles which resulted in decrease of property.
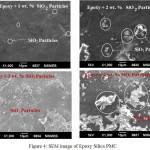 |
Figure 4: SEM image of Epoxy Silica PMC. Click here to View figure |
Scanning Electron Microscopy (SEM) Analysis
From the SEM characterization shows in Fig. 4 it can be very well interpreted that at lower wt. % of nano particles reinforcement within the epoxy matrix gives good result. At the 3 wt. % of SiO2 nano particles the dispersion is homogeneous and further increasing the wt. % of SiO2 the agglomeration of particles start which is clearly seen in SEM image. So that we can say the distribution of nano particles within the matrix at 3 wt. % of SiO2 are more uniform and homogeneous. Further increasing the loading wt. % of silica the number of agglomerations increases and their size also is increased. It also shows that at high loadings of nanoparticles the chances of lump formation is very high, owing to decrease in the properties of material due to heterogeneous distribution of silica nanoparticles in the matrix. Similar observations also reported by many researchers.8,11
AFM Roughness Analysis
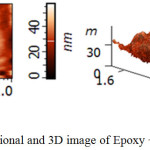 |
Figure 5a: Dimensional and 3D image of Epoxy + 1 wt. % of SiO2 |
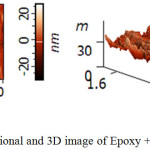 |
Figure 5b: Dimensional and 3D image of Epoxy + 2 wt. % of SiO2 |
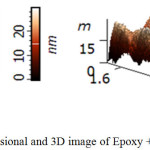 |
Figure 5c: Dimensional and 3D image of Epoxy + 3 wt. % of SiO2 |
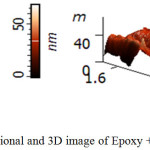 |
Figure 5d: Dimensional and 3D image of Epoxy + 4 wt. % of SiO2 |
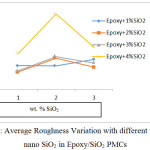 |
Figure 6: Average Roughness Variation with different wt. % of nano SiO2 in Epoxy/SiO2 PMCs Click here to View figure |
These AFM results show in Fig. (5a, 5b, 5c and 5d) very much correlate with the SEM results where grain analysis showed a decrease in number of grains at higher loadings due to clustering and agglomerations. From the graph Fig.6, it is seen that on increasing the weight percent of SiO2 loading the average roughness, tends to increase.
AFM Grain Analysis Results
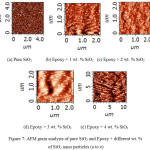 |
Figure 7: AFM grain analysis of pure SiO2 and Epoxy + different wt. % of SiO2 nano particles (a to e). Click here to View figure |
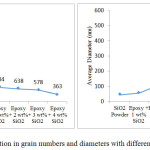 |
Figure 8: Variation in grain numbers and diameters with different wt. % of SiO2 Click here to View figure |
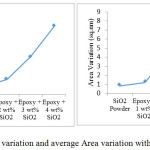 |
Figure 9: Average Size variation and average Area variation with different wt % of SiO2 Click here to View figure |
In this work AFM was carried on NT-MDT NEXT Solver (make-Russia) at Physics Laboratory of M.A.N.I.T, Bhopal. AFM grain analysis Fig. 7, Fig. 8 and Fig. 9 it can very well be interpreted that on increasing the weight percentage loading of SiO2 nanoparticles in the epoxy matrix, the number of grains show a decreasing trend whereas diameter, average size and area show increasing trend, this concludes that high weight percentage loading clustering and agglomerations of the nanoparticles take place inside resin matrix thereby increasing the average size of the grains. at lower weight percentage of nano particles loading within the epoxy polymer matrix there are proper dispersion of nano particles but on increasing the weight percent of nano particles of SiO2 agglomeration increases drastically within the matrix.
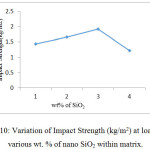 |
Figure 10: Variation of Impact Strength (kg/m2) at loading of various wt. % of nano SiO2 within matrix. Click here to View figure |
In Fig. 10 impact test results shows. The impact strength was highest at 3 wt. % loading of nano SiO2, further loading the ductility of epoxy decreases and possibility of formation of micro cracks increases. So, at higher loadings 4 wt. % of SiO2 impact strength decrease due to increase in the brittle character of composites.
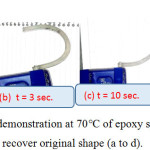 |
Figure 11: Shape recovery demonstration at 70°C of epoxy specimen at various time to recover original shape (a to d). |
In shape recovery demonstration Fig.11 shows that shape recovery of epoxy specimen when heated at 70°C in open environment. In shape recovery test first specimen heated at 70°C which is glass transition temperature of epoxy, then bend the specimen shows in Fig. 11 (a) and cool down the specimen in cold water to get temporary shape. After that the test initiated at 70°C environment temperature. At t=0 second the specimen got temporary shape after that till 20 second the specimen recover back its permanent shape shows in Fig. 11 (a to d). The shape recovery of specimen because of strain energy stored in specimen during temporary shape when water cooling at glass transition temperature. This epoxy has glass transition temperature is 70 °C which is very useful for further research in high temperature thermo-responsive shape memory polymer composites. So that, this type of epoxy opens the new gate for researchers to development and characterized the thermo-responsive shape memory properties.
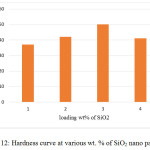 |
Figure 12: Hardness curve at various wt. % of SiO2 nano particles. |
Fig. 12 clearly shows that, with increase of SiO2 nano particles within the epoxy matrix the hardness were increase significantly upto 3 wt.% and then hardness was decrease at 4 wt% SiO2. The reason may be, upto 3 wt% SiO2 proper dispersion of nano particles after that agglomeration occurs within the epoxy matrix. Due to the agglomeration the grain boundaries reduces which is responsible for decrease the hardness value.
Conclusions
This present experiment we demonstrate shape recovery phenomena of this low cost epoxy which open the new gate for high temperature thermo responsive shape memory polymer composites. This existing epoxy may very useful for replacement of widely spared high coastally polyurethane based shape memory polymer, which is further need for research and development.
Homogeneous dispersion of SiO2 nano particles with the help of magnetic stirrer followed by the ultrasonic liquid bath. At lower wt. % of nano particles proper mixing seen in AFM and SEM.
Surface roughness increase with the increasing wt. % of SiO2 nano particles due to the increase in coefficient of friction.
FT-IR graphs very well show the existence of C=O and O – H bond in the PMCs.
Tensile strength, flexural strength, hardness were significantly improved at 3 wt. % of SiO2 nano particles.
Acknowledgements
For this present work I Krishan Kumar Patel is very much thankful to the MANIT Bhopal, India for providing research facilities and funds for research and developments.
References
- Manjunatha, C. M.; Taylor, A. C.; Kinloch, A. J.; Sprenger, S. Composites Science and Technology. 2010, 70(1), 193-199.
CrossRef - Rahman, I. A.; Padavettan, V. Journal of Nanomaterials. 2012, 2012, 8.
- Rosso, P.; Ye, L.; Friedrich, K.; Sprenger, S. Journal of Applied Polymer Science. 2006, 100(3), 1849-1855.
CrossRef - Uddin, M. F.; Sun, C. T. Composites Science and Technology. 2008, 68(7-8), 1637-1643.
CrossRef - Singh, S. K.; Kumar, A.; Jain, A. Materials Today: Proceedings. 2018, 5(2), 6339-6344.
- Christy, A.; Purohit, R.; Rana, R. S.; Singh, S. K.; Rana, S. Materials Today: Proceedings. 2017, 4(2), 2748-2754.
- Rong, M. Z.; Zhang, M. Q.; Zheng, Y. X.; Zeng, H. M. Polymer. 2001, 42(7), 3301-3294.
CrossRef - Zhou, Y.; White, E.; Hosur, M.; Jeelani, S. Materials Letters. 2010, 64(7), 806-799.
CrossRef - Shi, H.; Liu, F.; Yang, L.; Han, E. Progress in Organic Coatings. 2008, 62(4), 359-368.
CrossRef - Wei, B.; Song, S.; Cao, H. Materials & Design. 2011 32(8-9), 4180-4186.
CrossRef - Zhang, M. Q.; Rong, M. Z.; Yu, S. L.; Wetzel, B.; Friedrich, K. Wear. 2002, 253(9-10), 1086-1093.
CrossRef - Uddin, M. F.; Sun, C. T. Composites science and Technology. 2010, 70(2), 223-320.
CrossRef - Sprenger, S. Journal of materials science. 2014, 49(6), 2391-2402.
CrossRef

This work is licensed under a Creative Commons Attribution 4.0 International License.
![]()
A New Edition of Web of Science
Journal Impact Factor
2022: 0.5
Five Year: 0.8
Journal is Indexed in

Cabells Whitelist
![]()


