A Study of Coconut (Cocos Nucifera L.) Phosphatidylcholine Species
Dwi Hudiyanti1 , Marliana Jayanti2, Muhammad Fuad Al-Khafiz3 and Khairul Anam1
1Department of Chemistry, Faculty of Science and Mathematics, Diponegoro University - Jl. Prof. Soedarto, SH 50 275 Semarang, Indonesia.
2Department of Chemistry, Faculty of Science and Mathematics, Diponegoro University - Jl. Prof. Soedarto, SH 50 275 Semarang, Indonesia.
3Faculty of Science and Mathematics, Diponegoro University - Jl. Prof. Soedarto, SH 50 275 Semarang, Indonesia.
Corresponding Author E-mail: dwi.hudiyanti@live.undip.ac.id
DOI : http://dx.doi.org/10.13005/ojc/340636
Article Received on : 31-10-2018
Article Accepted on : 29-11-2018
Article Published : 06 Dec 2018
Coconut (Cocos nucifera L.) phosphatidylcholines, or CocoPCs species are studied in this paper. CocoPCs is fractionated from coconut phospholipids (CocoPLs) using methanol eluent in silica column chromatography. Analysis of the CocoPCs, by FTIR, GCMS and LCMS, reveals that among the isolated CocoPCs species are 16:0/18:0-PC with m/z 763 at Rf 6.02 and 18:1-LysoPC with m/z 522 at Rf 4.93. The composition of CocoPCs fatty acid chain residues are Dodecanoic acid (C12:0), Tetradecanoic acid (C14:0), 9-Hexadecenoic acid (C16:1), Hexadecanoic acid (C16:0), 9,12-Octadecadienoic acid (Z,Z) (C18:2), 9-Octadecenoic acid (C18:1) and Octadecanoic acid (C18:0). The CocoPCs content is 6.317% of 100 mg CocoPLs.
KEYWORDS:Amphiphilic; Drug Delivery Systems; Fatty Acid; Natural Membrane; Phospholipid
Download this article as:| Copy the following to cite this article: Hudiyanti D, Jayanti M, Al-Khafiz M. F, Anam K. A Study of Coconut (Cocos Nucifera L.) Phosphatidylcholine Species. Orient J Chem 2018;34(6). |
| Copy the following to cite this URL: Hudiyanti D, Jayanti M, Al-Khafiz M. F, Anam K. A Study of Coconut (Cocos Nucifera L.) Phosphatidylcholine Species. Orient J Chem 2018;34(6). Available from: http://www.orientjchem.org/?p=53542 |
Introduction
Lipid based drug delivery systems are one of many alternatives to overcome various problems related to drug formulation and application. These systems have been known to provide many benefits, including increased bioavailability and versatility of drugs. Their abilities are proven in a variety of treatment methods and they are safe and efficient. The lipids that are widely used in these systems are phospholipids.1
Phospholipids, which are structural and functional lipids, generally contain two distinct molecular parts. One part is polar and the other contains nonpolar parts that are bound to the glycerol framework. The combination of polar and nonpolar segments in these molecules is called amphiphilic; which illustrates the tendency of molecules to be in hydrophilic and lipophilic phase interfaces. The hydrophilic portion consists of phosphate esters, while the lipophilic portion consists of two fatty acids chains. This amphiphilic characteristic plays an important role in its use as a drug delivery system.2
Various types of hydrophilic and lipophilic groups, found in phospholipids, provide various phospholipid species with various amphiphilic properties. The molecular species, phospholipids, are phosphatidylcholine (PC) lipids, phosphatidylserine (PS), phosphatidylethanolamine (PE), phosphatidylglycerol (PG), and phosphatidilinositol (PI). PC and PE are neutral molecules (zwitter ion), while PS, PG and PI are charged phospholipids. Amine-bound phosphate groups; often called nitrogen bases, are serine, choline or ethanolamine. Types of polar groups, the length of the fatty acid chain and their degree of saturation (i.e., number of double chains) determines the physicochemical and functional properties of phospholipids.3,4 This affects the capacity and ability of phospholipids to bind active ingredients and drugs when used as drug delivery systems.
The main sources of phospholipids in nature are plants and animals. Phospholipids are the main constituent of cell membranes; namely lipid bilayers.5,6 Phospholipids in natural membranes usually contain two different chains; and usually, one of them is unsaturated. Natural phospholipids that have been used as current drug delivery systems, phosphatidylcholine (PC), are generally derived from eggs and soybean with their fatty acid chains ranging from C16:0-C22:6 to C14:0-C20:0.7–9 With the growing need for phospholipids as drug delivery systems, we should seek other sources of phospholipids to fulfil this demand.
Research by Hudiyanti et al.,10 used methanol eluent in coconut crude lipids to obtain Coconut phospholipids (CocoPLs). Coconut phospholipids contain phosphatidylcholine (CocoPCs), phosphatidylserine (cocoPSs), and/or phosphatidylethanolamine (cocoPEs) species with the lipophilic groups of dodecanoic acid (C12:0), octadecanoic acid (C18:0) and hexadecanoic acid (C16:0), which are abundant in CocoPLs.3 In this paper, we continue the study by analyzing the CocoPCs species and the lipophilic constituents of CocoPCs. Our new finding is that CocoPCs content is 6.317% in 100 mg CocoPLs. The species contained in isolated CocoPCs include 16:0/18:0-PC with m/z 763 at Rf 6.02 and 18:1-LysoPC with m/z 522 at Rf 4.93. The fatty acid chain residues are (C 16:0) palmitic acid, (C 18:0) stearic acid and (C 18:1) elaidic acid. This finding exposes that the CocoPCs has fatty acid chain residues similar to soybean PCs so that it is expected to have potency as raw material for a drug delivery system.
Experimenital
Materials
Coconut meat (Cocos nucifera L.) was purchased from a local market. Chloroform, methanol, ethanol, n-hexane, TLC-silica gel plate 60 GF254, silica gel 60 (0.2-0.5 mm), acetone, acetic acid, diethyl ether and Dragendorff reagent were purchased from Merck.
Isolation of (CocoPLs)
Isolation of CocoPLs from dried coconut powder was performed according to the method presented by Hudiyanti et al.,10,11 Briefly, the technique was as follows: dried coconut powder was macerated with a chloroform and methanol mixture (2: 1 v / v). The filtrate was purified further by partitioning in n-hexane and 80% ethanol layers, followed by evaporation of the polar layer to obtain CocoPLs.
Fractionation of CocoPCs
To acquire coconut phosphatidylcholines (CocoPCs), we fractionated CocoPLs as follows: A total of 100 mg of CocoPLs was dissolved in 2 ml of chloroform. The CocoPLs solution was then fractionated by chromatography over silica gel 60 (0.2-0.5 mm) using several mobile phases; namely chloroform, chloroform/methanol (6:1, v/v), acetone/methanol (9:1, v/v), and methanol.
A total of 6 g of silica gel 60 (0.2-0.5 mm) was dissolved in 15 mL of chloroform to form a silica slurry. The silica slurry was then inserted into a chromatography column until it was solid and compact without holes and cracks. A total of 100 mg of CocoPLs was dissolved in 2 mL of chloroform. The CocoPLs solution was then poured into the column. Next, 100 mL of mobile phase was eluted; starting with a low polarity phase and then continuing with a high polarity phase i.e., chloroform, chloroform/methanol (6:1, v/v), acetone/methanol (9:1, v/v), and methanol. The fractions were collected and identified by thin layer chromatography (TLC) under a UV lamp of 265 nm and 365 nm. The spotting reagent used for the choline species was Dragendorff’s reagent.
The fraction with choline species was evaporated at 40oC until a gel solid was formed. The gel solid was characterized using FTIR spectrometry to identify its functional group. In order to resolve the inherently coincided bands in the FTIR spectra we used Fityk program for deconvolution technique.12,13 GC-MS chromatography was used to determine acyl chain fatty acid compounds. GC-MS analysis of the CocoPCs was performed using a GCMS-QP2010S SHIMADZU system equipped with an AGILENTJ%W HP-5 column (30 m x 0.25 mm). An electron ionization system was operated in electron impact mode with an ionization energy of 70 eV. Helium gas (99.999%) was used as a carrier gas at a total flow rate of 80.1 mL/min, column flow of 0.54 mL/min, linear velocity 26.7 cm/sec, purge flow 3.0 mL/min and split ratio 141.6. The column oven temperature was 50.0°C and injection temperature was 300.00 °C. The gas flow was controlled with pressure of 13.0 kPa. LC-MS chromatography with TOF MS ES+ BPI method was performed to determine the molecular weight and structure of the phospholipid compounds of the choline species.
Results and Discussion
Isolation of CocoPCs
Dragendorff’s reagent detects tertiary amines; and was therefore utilized to detect choline species of CocoPLs viz. CocoPCs. TLC analysis of CocoPLs fractionations showed that CocoPCs was found in methanol fraction. The chloroform, chloroform/methanol (6:1, v/v), and acetone/methanol (9:1, v/v) fractions did not reveal any spots; either under UV lamp or after being sprayed with Dragendorff’s reagent. The methanol fraction showed development of an orange coloured spot at Rf 0.63 under Dragendorff’s reagent; thus indicating the presence of choline species, CocoPCs (see Figure 1). After evaporation of the methanol fraction, the CocoPCs content was 6.317% per 100 mg CocoPLs (Fig. 2).
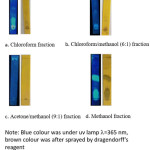 |
Figure 1: TLC spot of CocoPLs fractions. |
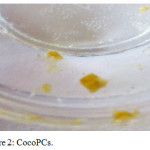 |
Figure 2: CocoPCs. |
The CocoPCs was characterized by FTIR (Figure 3). The FTIR spectra of CocoPCs (Figure 3) display a lot of overlapping peaks especially around the phospholipid related absorption regions14 hence we need to improve the resolution of the spectra at this regions. The enhanced resolution was obtained by peak deconvolution12 on the important regions; specifically, the phosphate and tertiary amine functional group regions (Fig. 4).
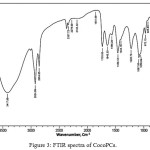 |
Figure 3: FTIR spectra of CocoPCs. |
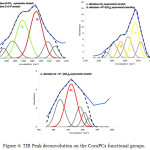 |
Figure 4: TIR Peak deconvolution on the CocoPCs functional groups.Click here to View figure |
Fig. 4 shows deconvolution peaks for phosphate and choline groups of CocoPCs. Peaks a and b show the vibration of the phosphate group, while c, d and e are for the choline group. Peak a indicates the symmetry stretch vibration of PO2– at 1087.85 cm-1 and peak b indicates the presence of vibration C ̶ O ̶ P stretch at 1056.99 cm-1.12 Peaks c, d, and e point towards a vibration CH2 stretch asymmetry at 1458.18 cm-1, N+ ̶ (CH3)3 bending asymmetry at 1404.18 cm-1 and N+ ̶ (CH3)3 stretch asymmetry at 972.12 cm-1, respectively.
The FTIR spectra of methanol fraction, along with peak deconvolution analysis of CocoPCs, confirmed that the fraction contained phosphatidylcholine i.e., CocoPCs. This was indicated by specific peak absorption of phosphatidylcholine functional groups viz. alkyl, carbonyl, phosphate and quaternary amines (N+ ̶ (CH3)3) at two specific areas, 1404.18 cm-1 and 972.12 cm-1, respectively. Functional groups of CocoPCs are presented in Table 1.
Table 1: Functional groups of CocoPCs.
|
Wavenumber, cm-1 |
Functional groups |
|
3417.68 |
N ̶ H asymmetric stretch |
|
2924.09 |
C ̶ H sp3 asymmetric stretch |
|
2854.65 |
C ̶ H sp3 symmetric stretch |
|
1735.93 |
C=O stretch (esters) |
|
1566.20 |
CO2–asymmetric stretch |
|
1458.18 |
CH2 asymmetric stretch |
|
1404.18 |
N+ ̶ (CH3)3 asymmetric bending |
|
1087.85 |
PO2– symmetric stretch |
|
1056.99 |
C ̶ O ̶ P stretch |
|
972.12 |
N+ ̶ (CH3)3 asymmetric stretch |
Fatty acid residues composition of CocoPCs was analysed by GC-MS. The chromatogram of fatty acid methyl ester of CocoPCs is presented in Figure 5. The fatty acid chain residues found in CocoPCs, which have a peak area of more than 10%, is presented in Table 1. The results confirm similarity between the fatty acid residues found in CocoPCs with the one in coconut lipids.10
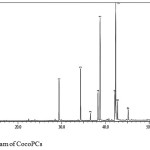 |
Figure 5: Chromatogram of CocoPCs. |
Table 2: Fatty acid chain residues of CocoPCs from GC-MS analysis.
|
Peak |
tR (minutes) |
Fatty Acid chain residues |
Area % |
|
1 |
29.399 |
Dodecanoic acid (C12:0) |
7.69 |
|
2 |
34.316 |
Tetradecanoic acid (C14:0) |
10.26 |
|
4 |
38.299 |
9-Hexadecenoic acid (C16:1) |
5.86 |
|
5 |
38.778 |
Hexadecanoic acid (C16:0) |
24.94 |
|
6 |
42.159 |
9,12-Octadecadienoic acid (Z,Z) (C18:2) |
6.62 |
|
7 |
42.337 |
9-Octadecenoic acid (C18:1) |
36.46 |
|
8 |
42.773 |
Octadecanoic acid (C18:0) |
4.04 |
Characterization of CocoPCs, using LC-MS with positive ion mode, resulted in the chromatogram shown in Figure 6. The CocoPCs peak found at Rf 6.02 min, with the product ion spectrum of deprotonated molecular ion, are m/z 763. The mass spectrum revealed that the dominant fatty acid chain residues in CocoPCs are palmitic acid (C 16:0) and stearic acid (C 18:0). These fatty acid chains are in agreement with the GC-MS mass spectrum shown in Table 2. The chromatogram also revealed that the CocoPCs still had a low purity; since more peaks existed. Furthermore, the peak at the retention time of 4.93 min had the highest percentage. This peak, with m/z 522, was lysophosphatidylcholine with elaidic fatty acid chain i.e., 18:1-LysoPC.
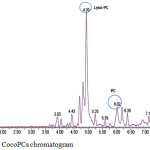 |
Figure 6: LC-MS CocoPCs chromatogram. |
Conclusion
Approximately 6.317% of 100 mg CocoPLs is CocoPCs. The isolated CocoPCs includes species with m/z 763 (16:0/18:0-PC) and m/z 522 (18:1-LysoPC). The fatty acid chain residues of CocoPCs, with an abundance of more than 4%, are Dodecanoic acid (C12:0), Tetradecanoic acid (C14:0), 9-Hexadecenoic acid (C16:1), Hexadecanoic acid (C16:0), 9,12-Octadecadienoic acid (Z,Z) (C18:2), 9-Octadecenoic acid (C18:1) and Octadecanoic acid (C18:0), which corresponds to their presence in the chromatogram from low tR to high tR. Further refinement is needed to obtain single component of CocoPCs.
Acknowledgements
DH and KA would like to express their gratitude for the financial support from DIPA FSM UNDIP 2017.
References
- Shrestha, H.; Bala, R.; Arora, S. J Pharm 2014, 2014, 1–10.
- Sakdiset, P.; Okada, A.; Todo, H.; Sugibayashi, K. J Drug Deliv Sci Technol. 2018, 44 (in press).
CrossRef - Hudiyanti, D.; Supardi, A.; Nugroho, S. J Sains Dan Mat 2012, 20, 93–7.
- Hudiyanti, D. Fosfolipida: Biosurfaktan. Yogyakarta: Deepublish; 2018, 17.
- Deborah, F.; Sofia, M. M.; Romina, B.; Claudia, M.; Guido, F.; Gregorio, C.; Antonella, S.; Francesco, C.; Antonio, S. Phytomedicine 2018 (in press).
- Tero R.; Fukumoto K.; Motegi T.; Yoshida M.; Niwano M.; Hirano-Iwata A. Sci Rep 2017, 7, 17905.
CrossRef - Li J.; Wang X.; Zhang T.; Wang C.; Huang Z.; Luo X.; Deng Y. Asian J Pharm Sci 2015, 10, 81–98.
- Liu, D.; Ma, F. Soybean Phospholipids. In: Krezhova D, editor. Recent trends enhancing Divers. Qual. soybean Prod., InTech; 2011, 483–500.
CrossRef - Blesso, C. Nutrients 2015, 7, 2731–47.
CrossRef - Hudiyanti, D.; Al Khafiz, M.F.; Anam, K. Orient J Chem 2018, 34, 1136–40.
CrossRef - Hudiyanti, D.; Triana, D.; Siahaan, P. J Kim Sains Dan Apl 2017, 20, 5-8.
CrossRef - Wojdyr, M. J Appl Crystallogr, 2010, 43, 1126-1128.
CrossRef - Swann G.E.A.; Patwardhan S. V. Clim Past 2011, 7, 65–74.
CrossRef - Meng, X.; Pan, Q.; Ding, Y.; Jiang, L. Food Chem. 2014, 147, 272-278.
CrossRef

This work is licensed under a Creative Commons Attribution 4.0 International License.
![]()
A New Edition of Web of Science
Journal Impact Factor
2022: 0.5
Five Year: 0.8
Journal is Indexed in

Cabells Whitelist
![]()


