A Potentiometric Studies of Ternary Complexes of Co(II), Ni(II), Cu(II) and Zn(II) with Ethylenediaamine-N,N,N1,N1-Tetraacetic Acid and Melonic Acid
Sapna Tomar1 and Padma Sikarwar2
1Department of Chemistry, RBSETC, Bichpuri (Campus) 283105- Agra, Uttar Pradesh, India.
2Department of Chemistry, RBS Polytechnic, Bichpuri (Campus) 283105-Agra, Uttar Pradesh, India.
Corresponding Author E-mail: Sapnatomar_Rbs@Rediffmail.Com
DOI : http://dx.doi.org/10.13005/ojc/340614
Article Received on : 01-11-2018
Article Accepted on : 04-12-2018
Article Published : 12 Dec 2018
Potentiometeric investigation on the complex formation equilibria involving Co(II), Ni(II), Cu(II) & Zn(II) with ethylenediaamine-N,N,N1,N1-tetraacetic acid and melonic acid have been made in solution at three different temps viz. (150, 350, 450C). Important thermodynamic parameters namely, change in Gibb’s free energy (DG0), change in enthalpy (DH0) and change in entropy (DS0) and stability constant have been determined potentiometrically at ionic strength of 0.1 M (KNO3).
KEYWORDS:Ethylenediaamine-N,N,N1,N1-Tetraacetic Acid; Formation Constant; Schiff Base Complexes; Transition Metals
Download this article as:| Copy the following to cite this article: Tomar S, Sikarwar P. A Potentiometric Studies of Ternary Complexes of Co(II), Ni(II), Cu(II) and Zn(II) with Ethylenediaamine-N,N,N1,N1-Tetraacetic Acid and Melonic Acid. Orient J Chem 2018;34(6). |
| Copy the following to cite this URL: Tomar S, Sikarwar P. A Potentiometric Studies of Ternary Complexes of Co(II), Ni(II), Cu(II) and Zn(II) with Ethylenediaamine-N,N,N1,N1-Tetraacetic Acid and Melonic Acid. Orient J Chem 2018;34(6). Available from: http://www.orientjchem.org/?p=53765 |
Introduction
The binary complexes of transition metal ions with carboxylic acids (Vickery,1957; Dutta and Suri,1957; Dubovenko and Babko, 1957; Galles and Nacollas,1956 and Peacock and James,1951) such as oxalic, malonic, succinic, phthalic, maleic, citraconic, malic and tartaric acids have been thoroughly investigated. Gentile et al (1962) have reported binary complexes of rare earths with a number of carboxylic acids and their derivatives. IR and X-ray investigations of the binary complexes of transition metals with carboxylic acids have also been reported by Brezina (1963) and Romov et al (1966).
Ternary complexes of transition metals with several multidentate ligands and a number of bidentate ligands have been studied potentiometrically by Sharma and Tandon (1973).
A survey of literature, however, revealed that insignificant amount of work has been carried out on the ternary complexes of transition metals. It was, therefore, considered of interest to carryout detailed potentiometric investigations on the systems: 1:1:1, M(II)-EDTA-MLA and M(II)-CDTA-CCA [where M(II) = Co(II), Ni(II), Cu(II) and Zn(II)] with a view of characterizing their formation and evaluating their formation constants and other thermodynamic parameters of the resulting heteroligand species. The results of these investigations have been presented and discussed in this chapter.
The pH-metric titration technique as described earlier, has been applied for the determination of the stability constants at three different temperatures viz. (15±1o, 25±1o and 35±1oC) using ionic strength of 0.1M KNO3. The results of pH-metric studies of Co(II), Ni(II), Cu(II) and Zn(II) ternary species of above mentioned ligands have been presented in this chapter.
The respective pH-titration curves at different temperature were similar in their nature and, therefore, the titration curves only at one temperature (25oC) have been presented for discussions and others at (15o and 35oC) have been omitted for the sake of brevity.
Figures have been drawn by plotting the obtained pH value against moles of alkali (m) added per mole of the metal/ligand.
Systems: 1:1:1, M(II)-EDTA-MLA and M(II)-CDTA-CCA
(where M(II) = Co(II), Ni(II), Cu(II) and Zn(II)
EDTA = Ethylenediamine-N,N,N’,N’-tetraacetic acid
CDTA =1,2-diaminocyclohexane-N,N,N’,N’-tetraacetic acid
MLA = Malonic acid
CCA = Citraconic acid
The above systems have been divided into the following two sections.
Section A
System : 1:1:1, M(II)-EDTA-MLA
Section B
System: 1:1:1, M(II)-CDTA-CCA
Experimental
All chemical used were G.R. Grade. Following solutions were prepared in freshly prepared double-distilled CO2– free water and purified ethanol.14 ethylenediaamine-N,N,N1, N1-tetraacetic acid and melonic acid were used after checking their purity by elemental analysis and spectral measurements.
pH was measured on the a Systronics μ-361 pH system using a special glass electode and a SCE. Analytical concentration of hydrogen ion were corrected for the use of mixed solvent. Ionic product of water and activity coefficient of hydrogen ion under the experimental condition were obtained from literature.15-18 Ionic strength was maintained at 0.1 M by adding required amounts of KNO3. Stability constant of the mixed ligand complexes were determined by pH-metric titrations at 150, 350, 450C.
The following sets were titrated against (0.1M) KOH solution.
10 ml (0.025 M) Metal nitrate + 5 ml (M) KNO3– diluted to 50 ml.
10 ml (0.025 M) Ligand (L) + 5 ml (M) KNO3– diluted to 50 ml.
10 ml (0.025 M) Ligand (L1) + 5 ml (M) KNO3– diluted to 50 ml.
10 ml (0.025 M) Metal nitrate + 10 ml (0.025 M) Ligand (L) + 5 ml (M) KNO3– diluted to 50 ml (1:1, M(II) – L).
10 ml (0.025 M) Metal nitrate + 10 ml (0.025 M) Ligand (L1) + 5 ml (M) KNO3– diluted to 50 ml (1:1, M(II) – L1).
10 ml (0.025 M) Metal nitrate + 10 ml (0.025 M) Ligand (L) + 10 ml (0.025 M) Ligand (L1) +5 ml (M) KNO3-diluted to 50 ml (1:1:1, M(II) – L-L1).
The measured pH values were plotted against the moles (m) of base added per mole of metal ions or ligand.
Result and Discussion
Section A
System 1:1:1, M(II)-EDTA-MLA
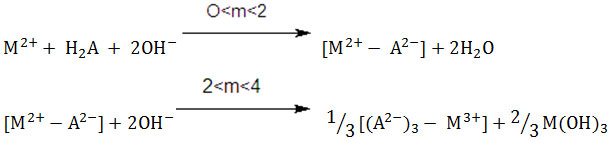
Curve a (Figs1-4) representing pH metric titration of Co(II), Ni(II), Cu(II) and Zn(II) nitrate respectively, exhibits an inflection at m ≈ 2.5 showing the basic-salt formation of the Co(II), Ni(II), Cu(II) and Zn(II).
Curve b (Figs.1-4) illustrates the potentiometric titration of tri potassium salt of ethylenediaamine-N,N,N,’N’-tetraaceticacid (K3EDTA). The absence of any inflection on this curve attributes the non-labile nature of the remaining carboxylic proton of tri-potassium salt of EDTA even at high pH. Curve c (Figs.1-4) represents the pH-metric titration of the melonic acid (MLA) shows two inflections at m=1 and m=2. The first inflection at m=1 may be correlated to the titration of only one carboxylic proton forming acid salt whereas the second inflection at m=2 shows the normal salt formation due to the complete neutralization of both the carboxylic groups.
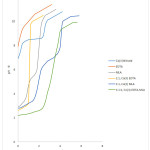 |
Figure 1: pH-titration curves of System 1:1:1, Co(II)-EDTA-MLA at 25oC. |
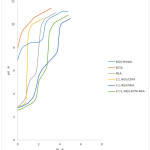 |
Figure 2: pH-titration curves of System 1:1:1, Ni(II)-EDTA-MLA at 25oC. |
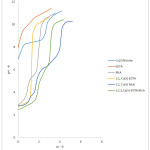 |
Figure 3: pH-titration curves of System 1:1:1, Cu(II)-EDTA-MLA at 25oC. |
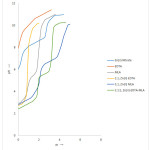 |
Figure 4: pH-titration curves of System 1:1:1, Zn(II)-EDTA-MLA at 25oC. |
Binary Systems
Curve d (Figs.1-4) represents the titration of 1:1, M(II)-EDTA binary mixture. An extensive lowering in the initial pH as compared to the curve b (Figs.1-4), followed by a well-defined inflection at m=1 may be correlated to the formation of soluble 1:1, M(II)-EDTA binary species (M.A. Tischenko et.al., 1974).
![]()
Curves e (Figs.1-4) attribute the pH-metric titrations of 1:1, M(II)-MLA systems, giving two inflection at m=2 and m≈4 with lowering in initial pH as compared to curves c. First inflection at m=2 may be attributed to the formation 1:1, M(II)- MLA species. Another inflection at m≈4 on these curves, may, however, be ascribed to the disproportionation of the initially formed 1:1, complex in to 1:3, M(II)- MLA soluble species (R.C. Sharma et al., 1975), and to the simultaneous precipitation of the remaining metal as metal hydroxide in higher buffer region.
(Where H2O = MLA; M(II) = Co(II), Ni(II), Cu(II) and Zn(II).
Ternary System
Curve f(Figs.1-4) show the titration of 1:1:1,M(II)-EDTA-MLA ternary system. A fall in pH in the lower buffer region as compared to the curve d for 1:1, M(II)-EDTA and curve e for 1:1, M(II)-MLA along with an inflection at m=2 (pH≈4) on these curves may be ascribed to the formation of soluble 1:1:1,M(II)-EDTA-MLA monoprotonated ternary species (R. Kumar et al., 1976).
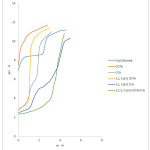 |
Figure 5: pH-titration curves of System 1:1:1, Co(II)-CDTA-CCA at 25oC. |
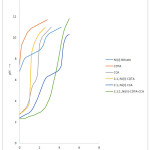 |
Figure 6: pH-titration curves of System 1:1:1, Ni(II)-CDTA-CCA at 25oC. |
 |
Figure 7: pH-titration curves of System 1:1:1, Cu(II)-CDTA-CCA at 25oC. |
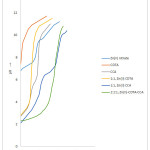 |
Figure 8: pH-titration curves of System 1:1:1, Zn(II)-CDTA-CCA at 25oC. |

Where H2A = MLA, CCA and M(II) = Co(II), Ni(II), Cu(II) and Zn(II)
The deprotonation of the formed protonated species occurs further in the higher pH-range as indicated by the appearance of one more well-defined inflection at m=3. The absence of a solid phase throughout the titration and the non-superimposable nature of curve f with either binary curves d or e further substantiate the formation of hetero-ligand ternary species. The formation and deprotonation of the intermediate protonated species may be expressed as follows:

Ionisation constants (KMLL’ values) of mixed ligand complexes :
The values of ionisation constants (KMLL’) have been calculated and given in tables 1, 2 and 3. The observed order of stability in terms of metal ions is found to be Cu(II) > Co(II) > Ni(II) > Zn(II).
Table 1: System: 1:1:1, M(II)-EDTA-MLA at 15oC.
[M(II) = Co(II), Ni(II), Cu(II) and Zn(II)]
Temperature = 15±1oC, µ = 0.1M KNO3, KOH = 0.1M
Concentration = Co(II)/ Ni(II)/ Cu(II)/Zn(II) = EDTA = MLA = 5×10⁻³M.
| S.No. | M | Co(II)-EDTA-MLA | Ni(II)-EDTA-MLA | Cu(II)-EDTA-MLA | Zn(II)-EDTA-MLA | ||||
| pH | Log KMLL’ | pH | Log KMLL’ | pH | Log KMLL’ | pH | Log KMLL’ | ||
| 1. | 0.2 | 2.25 | 14.62 | 2.24 | 14.72 | 2.22 | 14.89 | 2.22 | 14.89 |
| 2. | 0.4 | 2.30 | 14.59 | 2.28 | 14.76 | 2.26 | 14.93 | 2.25 | 15.01 |
| 3. | 0.6 | 2.34 | 14.66 | 2.32 | 14.83 | 2.30 | 14.99 | 2.28 | 15.17 |
| 4. | 0.8 | 2.39 | 14.67 | 2.38 | 14.74 | 2.36 | 14.80 | 2.34 | 15.07 |
| 5. | 1.0 | 2.46 | 14.56 | 2.45 | 14.65 | 2.42 | 14.87 | 2.40 | 15.02 |
| 6. | 1.2 | 2.50 | 14.73 | 2.50 | 14.73 | 2.48 | 14.87 | 2.46 | 15.01 |
| 7. | 1.4 | 2.58 | 14.60 | 2.56 | 14.75 | 2.54 | 14.90 | 2.52 | 15.06 |
| 8. | 1.6 | 2.64 | 14.70 | 2.62 | 14.83 | 2.60 | 14.98 | 2.58 | 15.12 |
| 9. | 1.8 | 2.71 | 14.75 | 2.70 | 14.82 | 2.63 | 14.92 | 2.66 | 15.01 |
| 10. | 2.0 | 2.80 | 14.80 | 2.78 | 14.93 | 2.78 | 14.93 | 2.76 | 15.07 |
| 11. | 2.2 | 2.94 | 14.59 | 2.92 | 14.72 | 2.88 | 15.00 | 2.84 | 15.36* |
| 12. | 2.4 | 3.08 | 14.58 | 3.06 | 14.71 | 2.98 | 15.26* | 2.96 | 15.40* |
Mean value
Log KMLL’ = 14.68±0.12, Log KMLL’ = 14.79±0.14, Log KMLL’ = 14.90±0.10, Log KMLL’ = 15.03±0.14
*Values omitted
Table 2: System: 1:1:1, M(II)-EDTA-MLA.
[M(II) = Co(II), Ni(II), Cu(II) and Zn(II)]
Temperature = 25±1oC, µ = 0.1M KNO3, KOH = 0.1M
Concentration = Co(II)/ Ni(II)/ Cu(II)/Zn(II) = EDTA = MLA = 5×10⁻³M.
| S.No. | M | Co(II)-EDTA-MLA | Ni(II)-EDTA-MLA | Cu(II)-EDTA-MLA | Zn(II)-EDTA-MLA | ||||
| pH | Log KMLL’ | pH | Log KMLL’ | pH | Log KMLL’ | pH | Log KMLL’ | ||
| 1. | 0.2 | 2.32 | 14.01* | 2.30 | 14.38 | 2.28 | 14.56 | 2.28 | 14.56 |
| 2. | 0.4 | 2.34 | 14.46 | 2.34 | 14.46 | 2.32 | 14.63 | 2.32 | 14.63 |
| 3. | 0.6 | 2.40 | 14.39 | 2.38 | 14.55 | 2.38 | 14.55 | 2.36 | 14.71 |
| 4. | 0.8 | 2.46 | 14.33 | 2.44 | 14.50 | 2.42 | 14.65 | 2.41 | 14.73 |
| 5. | 1.0 | 2.52 | 14.32 | 2.52 | 14.32 | 2.48 | 14.63 | 2.48 | 14.63 |
| 6. | 1.2 | 2.58 | 14.34 | 2.56 | 14.49 | 2.54 | 14.64 | 2.52 | 14.78 |
| 7. | 1.4 | 2.64 | 14.39 | 2.62 | 14.54 | 2.61 | 14.61 | 2.58 | 14.82 |
| 8. | 1.6 | 2.72 | 14.34 | 2.70 | 14.49 | 2.63 | 14.64 | 2.68 | 14.64 |
| 9. | 1.8 | 2.82 | 14.22 | 2.80 | 14.36 | 2.78 | 14.49 | 2.74 | 14.77 |
| 10. | 2.0 | 2.92 | 14.34 | 2.88 | 14.47 | 2.85 | 14.51 | 2.85 | 14.68 |
| 11. | 2.2 | 3.02 | 14.29 | 3.02 | 14.29 | 2.99 | 14.68 | 2.95 | 14.75 |
| 12. | 2.4 | 3.18 | 14.16 | 3.16 | 14.27 | 3.14 | 14.42 | 3.11 | 14.61 |
Mean value
Log KMLL’ = 14.31±0.15, Log KMLL’ = 14.41±0.14, Log KMLL’ = 14.55±0.13, Log KMLL’ = 14.69±0.13
*Values omitted.
Table 3: System: 1:1:1, M(II)-EDTA-MLA
[M(II) = Co(II), Ni(II), Cu(II) and Zn(II)]
Temperature = 35±1oC, µ = 0.1M KNO3, KOH = 0.1M
Concentration = Co(II)/ Ni(II)/ Cu(II)/Zn(II) = EDTA = MLA = 5×10⁻³M.
| S.No. | M | Co(II)-EDTA-MLA | Ni(II)-EDTA-MLA | Cu(II)-EDTA-MLA | Zn(II)-EDTA-MLA | ||||
| pH | Log KMLL’ | pH | Log KMLL’ | pH | Log KMLL’ | pH | Log KMLL’ | ||
| 1. | 0.2 | 2.38 | 13.78* | 2.35 | 14.15 | – | – | 2.31 | 14.54* |
| 2. | 0.4 | 2.43 | 13.85 | 2.42 | 13.97 | 2.41 | 14.10 | 2.40 | 14.17 |
| 3. | 0.6 | 2.49 | 13.83 | 2.47 | 14.03 | 2.45 | 14.21 | 2.45 | 14.21 |
| 4. | 0.8 | 2.55 | 13.82 | 2.53 | 14.01 | 2.51 | 14.19 | 2.49 | 14.35 |
| 5. | 1.0 | 2.61 | 13.86 | 2.59 | 14.03 | 2.57 | 14.04 | 2.55 | 14.47 |
| 6. | 1.2 | 2.67 | 13.89 | 2.65 | 14.07 | 2.64 | 14.15 | 2.61 | 14.38 |
| 7. | 1.4 | 2.73 | 13.98 | 2.71 | 14.15 | 2.70 | 14.22 | 2.68 | 14.37 |
| 8. | 1.6 | 2.81 | 13.98 | 2.79 | 14.12 | 2.76 | 14.34 | 2.74 | 14.37 |
| 9. | 1.8 | 2.91 | 13.85 | 2.89 | 14.00 | 2.86 | 14.21 | 2.84 | 14.34 |
| 10. | 2.0 | 3.01 | 13.85 | 2.97 | 14.14 | 2.95 | 14.27 | 2.94 | 14.34 |
| 11. | 2.2 | 3.11 | 13.95 | 3.10 | 14.02 | 3.08 | 14.17 | 3.05 | 14.20 |
| 12. | 2.4 | 3.27 | 13.82 | 3.24 | 14.02 | 3.24 | 14.02 | 3.21 | 14.23 |
Mean value
Log KMLL’ = 13.93±0.11, Log KMLL’ = 14.06±0.09, Log KMLL’ = 14.18±0.16, Log KMLL’ = 14.32±0.15
*Values omitted.
Table 4 : System: 1:1:1, M(II)-CDTA-CCA.
[M(II) = Co(II), Ni(II), Cu(II) and Zn(II)]
Temperature = 15±1oC, µ = 0.1M KNO3, KOH = 0.1M
Concentration = Co(II)/ Ni(II)/ Cu(II)/Zn(II) = CDTA = CCA = 5×10⁻³M.
| S.No. | M | Co(II)-CDTA-CCA | Ni(II)- CDTA-CCA | Cu(II)- CDTA-CCA | Zn(II)- CDTA-CCA | ||||
| pH | Log KMLL’ | pH | Log KMLL’ | pH | Log KMLL’ | pH | Log KMLL’ | ||
| 1. | 0.2 | 2.25 | 16.46 | 2.24 | 16.55 | 2.24 | 16.55 | 2.23 | 16.73 |
| 2. | 0.4 | 2.30 | 16.42 | 2.29 | 16.51 | 2.28 | 16.60 | 2.28 | 16.60 |
| 3. | 0.6 | 2.36 | 16.33 | 2.34 | 16.50 | 2.32 | 16.66 | 2.32 | 16.66 |
| 4. | 0.8 | 2.42 | 16.27 | 2.40 | 16.43 | 2.39 | 16.51 | 2.37 | 16.67 |
| 5. | 1.0 | 2.48 | 16.24 | 2.46 | 16.40 | 2.45 | 16.48 | 2.44 | 16.57 |
| 6. | 1.2 | 2.54 | 16.25 | 2.52 | 16.41 | 2.50 | 16.55 | 2.49 | 16.63 |
| 7. | 1.4 | 2.60 | 16.30 | 2.59 | 16.37 | 2.56 | 16.59 | 2.55 | 16.65 |
| 8. | 1.6 | 2.69 | 16.16 | 2.66 | 16.39 | 2.64 | 16.53 | 2.63 | 16.60 |
| 9. | 1.8 | 2.77 | 16.16 | 2.75 | 16.31 | 2.73 | 16.46 | 2.71 | 16.59 |
| 10. | 2.0 | 2.86 | 16.22 | 2.84 | 16.36 | 2.82 | 16.50 | 2.80 | 16.63 |
| 11. | 2.2 | 2.99 | 16.09* | 2.96 | 16.29 | 2.93 | 16.50 | 2.91 | 16.63 |
| 12. | 2.4 | 3.15 | 15.95* | 3.10 | 16.29 | 3.08 | 16.46 | 2.96 | 16.57 |
Mean value
Log KMLL’ = 14.68±0.12, Log KMLL’ = 14.79±0.14, Log KMLL’ = 14.90±0.10, Log KMLL’ = 15.03±0.14
*Values omitted.
Thermodynamic Parameters
More appropriate interpretation of data can be done on the basis of thermodynamic parameters. Hence, the thermodynamic parameters namely change in free energy (∆Go), change in enthalpy (∆Ho) and change in entropy (∆So) have been calculated and recorded in table 7.
Table 5: System: 1:1:1, M(II)-CDTA-CCA.
[M(II) = Co(II), Ni(II), Cu(II) and Zn(II)]
Temperature = 25±1oC, µ = 0.1M KNO3, KOH = 0.1M
Concentration = Co(II)/ Ni(II)/ Cu(II)/Zn(II) = CDTA = CCA = 5×10⁻³M.
| S.No. | M | Co(II)-CDTA-CCA | Ni(II)- CDTA-CCA | Cu(II)- CDTA-CCA | Zn(II)- CDTA-CCA | ||||
| pH | Log KMLL’ | pH | Log KMLL’ | pH | Log KMLL’ | pH | Log KMLL’ | ||
| 1. | 0.2 | – | – | – | – | – | – | – | – |
| 2. | 0.4 | 2.36 | 16.24 | 2.35 | 16.33 | 2.34 | 16.42 | 2.34 | 16.41 |
| 3. | 0.6 | 2.42 | 16.17 | 2.40 | 16.35 | 2.40 | 16.34 | 2.39 | 16.43 |
| 4. | 0.8 | 2.48 | 16.13 | 2.46 | 16.29 | 2.45 | 16.37 | 2.43 | 16.53 |
| 5. | 1.0 | 2.54 | 16.12 | 2.54 | 16.12 | 2.51 | 16.36 | 2.50 | 16.44 |
| 6. | 1.2 | 2.60 | 16.10 | 2.59 | 16.22 | 2.56 | 16.45 | 2.55 | 16.52 |
| 7. | 1.4 | 2.66 | 16.14 | 2.65 | 16.28 | 2.63 | 16.43 | 2.61 | 16.57 |
| 8. | 1.6 | 2.75 | 16.10 | 2.72 | 16.31 | 2.70 | 16.45 | 2.68 | 16.59 |
| 9. | 1.8 | 2.84 | 16.04 | 2.83 | 16.11 | 2.80 | 16.32 | 2.76 | 16.59 |
| 10. | 2.0 | 2.92 | 16.17 | 2.90 | 16.30 | 2.89 | 16.37 | 2.88 | 16.43 |
| 11. | 2.2 | 3.05 | 16.04 | 3.02 | 16.25 | 3.00 | 16.31 | 2.99 | 16.45 |
| 12. | 2.4 | 3.20 | 15.98* | 3.16 | 16.24 | 3.15 | 16.31 | 3.13 | 16.57 |
Mean value
Log KMLL’ = 16.14±0.10, Log KMLL’ = 16.23±0.12, Log KMLL’ = 16.38±0.07, Log KMLL’ = 16.50±0.09
*Values omitted.
Table 6: System: 1:1:1, M(II)-CDTA-CCA
[M(II) = Co(II), Ni(II), Cu(II) and Zn(II)]
Temperature = 35±1oC, µ = 0.1M KNO3, KOH = 0.1M
Concentration = Co(II)/ Ni(II)/ Cu(II)/Zn(II) = CDTA = CCA = 5×10⁻³M.
| S.No. | M | Co(II)-CDTA-CCA | Ni(II)- CDTA-CCA | Cu(II)- CDTA-CCA | Zn(II)- CDTA-CCA | ||||
| pH | Log KMLL’ | pH | Log KMLL’ | pH | Log KMLL’ | pH | Log KMLL’ | ||
| 1. | 0.2 | – | – | – | – | – | – | – | – |
| 2. | 0.4 | 2.42 | 16.05 | 2.41 | 16.15 | 2.40 | 16.42 | 2.38 | 16.45 |
| 3. | 0.6 | 2.49 | 15.89 | 2.46 | 16.20 | 2.45 | 16.34 | 2.45 | 16.25 |
| 4. | 0.8 | 2.54 | 16.01 | 2.52 | 16.12 | 2.50 | 16.37 | 2.49 | 16.44 |
| 5. | 1.0 | 2.62 | 15.85 | 2.59 | 15.92 | 2.57 | 16.36 | 2.55 | 16.44 |
| 6. | 1.2 | 2.68 | 15.92 | 2.68 | 16.01 | 2.65 | 16.45 | 2.63 | 16.32 |
| 7. | 1.4 | 2.74 | 16.01 | 2.74 | 15.99 | 2.72 | 16.43 | 2.71 | 16.30 |
| 8. | 1.6 | 2.82 | 15.99 | 2.82 | 16.16 | 2.81 | 16.45 | 2.79 | 16.25 |
| 9. | 1.8 | 2.90 | 16.02 | 2.88 | 16.16 | 2.86 | 16.32 | 2.85 | 16.37 |
| 10. | 2.0 | 3.00 | 16.02 | 2.98 | 16.11 | 2.95 | 16.37 | 2.95 | 16.36 |
| 11. | 2.2 | 3.11 | 16.04 | 3.10 | 16.12 | 3.08 | 16.31 | 3.06 | 16.38 |
| 12. | 2.4 | 3.25 | 16.05 | 3.24 | 16.24 | 3.21 | 16.31 | 3.19 | 16.44 |
Mean value
Log KMLL’ = 15.95±0.10, Log KMLL’ = 16.06±0.14, Log KMLL’ = 16.21±0.15, Log KMLL’ = 16.35±0.10
*Values omitted.
Table 7: Stability constants and thermodynamic parameters of studied systems.
| S.No | Systems, 1:1:1 | Log KMLL’ | -∆H | -∆G (K.Cal/mole) | |||||
| 15oC | 25oC | 35oC | -∆H1 | -∆H2 | 15oC | 25oC | 35oC | ||
| 1. | Co(II)-EDTA-MLA | 14.69 | 14.32 | 13.93 | 14.51 | 15.95 | 19.32 | 19.49 | 19.64 |
| 2. | Ni(II)-EDTA-MLA | 14.78 | 14.42 | 14.06 | 14.91 | 14.70 | 19.46 | 19.64 | 19.80 |
| 3. | Cu(II)-EDTA-MLA | 14.87 | 14.51 | 14.15 | 13.74 | 15.54 | 19.60 | 19.82 | 19.96 |
| 4. | Zn(II)-EDTA-MLA | 15.05 | 14.60 | 14.33 | 13.34 | 15.53 | 19.77 | 20.01 | 20.09 |
Table 8: Stability constants and thermodynamic parameters of studied systems.
| S.No. | Systems, 1:1:1 | Log KMLL’ | -∆H | -∆G (K.Cal/mole) | |||||
| 15oC | 25oC | 35oC | -∆H1 | -∆H2 | 15oC | 25oC | 35oC | ||
| 1. | Co(II)-CDTA-CCA | 16.31 | 16.13 | 15.95 | 6.67 | 7.98 | 21.65 | 22.16 | 22.61 |
| 2. | Ni(II)- CDTA-CCA | 16.41 | 16.22 | 16.05 | 7.45 | 7.14 | 21.62 | 22.10 | 22.61 |
| 3. | Cu(II)- CDTA-CCA | 16.54 | 16.36 | 16.22 | 7.05 | 7.14 | 21.80 | 22.32 | 22.83 |
| 4. | Zn(II)- CDTA-CCA | 16.65 | 16.50 | 16.35 | 5.88 | 5.87 | 21.92 | 22.48 | 23.02 |
The negative values of ∆Ho indicate exothermic nature of reaction while the negative values of ∆Go indicate spontaneity of the reaction of all the cases and positive values of ∆So shows covalent bond formation in the reaction.
Section B
System: 1:1:1, M(II)-CDTA-CCA
[Where M(II) = Co(II), Ni(II), Cu(II) and Zn(II)]
CDTA =1,2-diaminocyclohexane-N,N,N’,N’-tetraacetic acid
CCA = Citraconic acid
Curve a (Figs. 1-4) representing the pH-metric titration of metal nitrates. Curves crepresents the pH-metric titration of the free dicarboxylic acid CCA (Figs. 1-4) and curve e for 1:1, M(II)-CCA system (Figs. 1-4) attribute the pH-metric titration of 1:1, M(II)-CCA system.
Absence of any inflection on the curve b (Figs. 1-4) showing the titration of tripotassiumcyclohexanediamine-N,N,N’,N’-tetraacetate indicates the non-labile nature of the remaining carboxylic proton, which may be ascribed to its attachment to one of the tertiary nitrogen atoms (Sharma and Tandon, 1973). Curve d (Figs. 1-4) corresponds to the potentiometric titration of equimolar 1:1, mixture of metal nitrate and tripotassium salt of CDTA. An extensive lowering in the initial pH and a well-defined inflection at m=1 may be attributed to the formation of a soluble 1:1, M(II)-CDTA species.

Ternary Systems
Curve f (Figs. 1-4) represents the potentiometric titration of 1:1:1, M(II)-CDTA-CCA. An appreciable drop in the initial pH and an inflection at m=2 may be due to the simultaneous chelation of CDTA and CCA to the metal ion resulting in the formation of a protonated 1:1:1, M(II)-CDTA-CCA ternary species in the lower buffer region. It appears that one of the carboxylic protons of the dibasic acids remains non-labile during this process. Another inflection at m=3 on the same curve may be ascribed to the deprotonation of the initially formed soluble protonated heteroligand species.
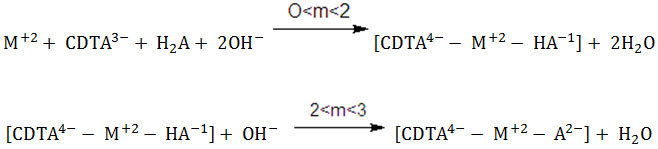
(Where H2A = CCA and M(II) = Co(II), Ni(II), Cu(II) and Zn(II)
Reference
- D. Kumar A. Vaish, R. Nayan, J. Indian Chem. Soc., 2002, 79, 645.
- M. singh and R. Nayan, Asian J. Chem. 1996, 8, 470.
- F.A. Cotton and G. Wilkinson, “Advanced Inorganic Chemistry” “A Comprehensive Text”. 4thEdn. John Wiley and Sons, New York (1980).
- T.V.R.K. Rao & S. N.P. Kumud, J. Indian Chem, Soc. 2001, 18, 90.
- T.V.R.K. Rao & S. N.P. Kumud, J. Indian Chem, Soc. 1997, 74, 171.
- M. Sivasankara Nair and M.A. Neelakantan, J. Indian Chem. Soc., 2000 77, 373.
- A Spencer “Comprehensive Coordination chemistry [Ed. G. Wilkins] Pergamon Press, 1989, 6, 66.
- N.K. Kaushik and A. K. Mishra, J. Indian Chem. Soc., 2003, 42A, 276.
- K.P. Srivastava and N. K. Ojha, Asian Journal of Chemistry, 2007, 19, 385.
- F. Khan and F. Khan, J. Indian Chem. Soc., 1997,74, 171.
- R.,N. Patel, P.R. Gokhale and K.B. Pandeya J. Indian Chem. Soc., 1990, 76, 475.
- G.N. Mukherje and S. Basu, J. Indian Chem. Soc., 1999, 76, 288.
- V. Aravind and K.P. Elango, Indian J. of Chem. Tech. 2006, 13, 476.
- G. Karthikeyan and S. Meenakshi, J. Indian Chem. Soc., 2004, 81, 461.
- J. Budhraja and M.Singh, J. Indian Chem. Soc., 2004, 81¸573.
- G. Karthikeyan and K. Anabalagan. J. Indian Chem. Soc., 2005, 117, 663.
- M. Nizam and J. Zeyad, Asian Journal of Chemistry, 2007, 19, 375.
- M.A. Shakoor and Sayyed Hussain, Asian Journal of Chemistry, 2007, 19, 311.

This work is licensed under a Creative Commons Attribution 4.0 International License.
![]()
A New Edition of Web of Science
Journal Impact Factor
2022: 0.5
Five Year: 0.8
Journal is Indexed in

Cabells Whitelist
![]()


