The Influence of Fertilizer on Nitrate, Nitrite and Vitamin C Contents in Vegetables
1Department of Pharmaceutical Chemistry, Faculty of Pharmacy, Universitas Sumatera Utara, Medan, Indonesia.
2Department of Chemistry, Faculty of Mathematics and Natural Sciences, Universitas Sumatera Utara, Medan, Indonesia.
Corresponding Author E-mail: jansen@usu.ac.id
DOI : http://dx.doi.org/10.13005/ojc/340552
Download this article as:
![]()
The aim of this study was to examine the influence of fertilization on nitrate, nitrite, and vitamin C contents in vegetables. All seedlings (mustard, bokchoy, spinach, and lettuce) were grown in the greenhouse in polybags with organic and inorganic fertilizers. Nitrite was derivitized with sulfanilic acid and N-(1-naphthyl) ethylenediamine dihydrochloride in acetic acid solution, then absorbance measured by spectrophotometer at 540 nm. Nitrate reduced to nitrite by adding zincum powder in acidic condition, then determined as nitrite. Vitamin C was titrated with 2,6-dichlorophenol indophenol.The study show that the influence of organic fertilizers increased nitrate, nitrite and vitamin C contents with increasing doses. Inorganic fertilizers was found to be more influential to increase nitrite and nitrate contents, but decreased vitamin C with increasing doses.This findings suggest that inorganic fertilizers more effective to increase nitrate and nitrite contents compared to organic fertilizers. Organic fertilization increased vitamin C, but inorganic fertilization decreased.
KEYWORDS:Fertilization; Nitrate; Nitrite; Vegetable; Visible Spectrophotometer; Vitamin C
Introduction
Vegetables are the main source of nitrates and nitrites in human diet which contribute to around 80-92% of average daily intake. Plants and vegetables absorb nitrates which are naturally available in soil and water required to support growth. Leafy vegetables potentially disposed to accumlate excessive amounts of nitrates. Several studies reported that the nitrate content in vegetables vary widely from 1 to 10.000 mg.kg–.1 2 In addition to the nitrite and nitrate from vegetables, nitrate and nitrite are also deliberately added to some foods such as processed meats as preservatives and colouring agents.3-5 FAO/ WHO provided a regulation on Acceptable Daily Intake (ADI) for nitrate 220 mg and 8 mg for nitrite per day for adult with the body weight of 60 kg. Nitrate contents in vegetables can be reduced into nitrite by nitrate reductase enzyme and other reducing agents including vitamin C present in vegetables and fruits. Nitrite may react with alkylamines that may be present in food to form carcinogen nitrosamines. Nitrite may cause methemoglobinemia in infants.6-9
Several factors may affect the accumulation of nitrates in plants, including light, type and level of fertilization, temperature, structure of the soil, quality of water irrigation, and cultivar.4 Previous studies reported that nitrate accumulation had a close relationship with the amount of fertilizer applied. The results showed that the highest nitrate levels was found in the use of inorganic fertilizers, but effect of fertilizers on vitamin was not yet reported.6,10 In this research, our purpose is to know the influence of organic and inorganic fertilization on nitrate, nitrite and vitamin C contents in some vegetables.
Materials and Method
All of the chemical materials were purchased from E. Merck (Germany) including; N-(1-naftil) ethylenediamine dihydrochloride (NED), sulfanilic acid, glacial acetic acid, antipyrin, zincum powder, hydrochloric acid, sodium nitrate, ascorbic acid, sodium nitrite, metaphosphoric acid, ferrous sulfate, and 2,6-dichlorophenol indophenol. Equipments used in this research included spectrophotometer UV-Vis (UV-1800 Shimadzu), water bath, micro burette, thermometer, filter paper, glass wares, and analytical balance (Boeco Germany)
Method
Preparation of Reagents
Acetic acid solution was made by transferring 75 ml glacial acetic acid into 500 ml volumetric flask, then added distilled water to mark line (500 ml) to obtain asetic acid solution 15%. Solution of NED was prepared by transferring 0.350 g N-(1-naftil) etylendiamin dihydrochloride into 250 ml volumetric flask to which added acetic acid solution 15%, and homogenized. Then, filtered and kept in brown bottle. Sulfanilic acid solution was made by transferring 0.850 g sulfanilic acid into 250 ml volumetric flask to which added acetic acid solution 15%, and homogenized. Then filtered and kept in brown bottle.1,5
One hundred (100) mg sodium nitrite was weighed and placed into 100 ml volumetric flask and dissolved in distilled water, and made mark line (C = 1000μg/ml). From this solution, 1 ml was tranferred into 100 ml volumetric flask then diluted with distilled water to volume 100 ml (C = 10 μg/ml).1,5
The solution of 2,6-dichlorophenol indophenol solution 0.025% was prepared by weighing 50 mg sodium 2,6-dichlorophenol indophenol 99% that had been stored in desiccator, and then transferred into 250 ml volumetric flask, and then added 50 ml NaHCO3 solution 0.084%, stirred, and then added distilled water to make 250 ml, then filtered and kept in brown bottle.. Metaphosphoric-acetic acid solution 3% was made by transferring 15 g metaphosphoric acid 99% in 40 ml of glacial acetic acid 96% and distilled water was added to make 500 ml, stored in a cool place, should be used within 2 days. NaHCO3 solution 0.84% was made by dissolving 840 mg NaHCO3 in 100 ml of distilled water.11
Samples Preparation
The vegetables analyzed in this research were sweet mustard (Brassicca rapa chinensis), bok choy (Brassica rapa L.), spinach (Amaranthus tricolor L), and lettuce (Lactuca sativa L.). These vegetables were planted by seedlings in the greenhouse from June to August 2017. Seedlings were grown in polybags (size = 5 kg) by combination of humid soil and sand (1:1)withorganic fertilizers (80 g; 160 g; 240 g) and urea/inorganic fertilizers (0.3 g; 0.6 g; 0.9 g).This vegetables harvested according to the normal time for each vegetables. The Vegetables were cleaned, and then weighed 100 g and then cut into small pieces (± 4 cm) and grounded. Then nitrate, nitrite, and vitamin C contents in samples were analyzed.
Analysis of Nitrite and Nitrate in Vegetables
Nitrite and Nitrate Identification
Around ten gram sample of each vegetable was grounded and then placed in beaker glass, to which distilled water was added, heated on water bath and shaken for while, then cooled and filtered. The filtrate was taken and transferred into a test tube to identify nitrite and nitrate in samples. Nitrite was tested by addition of sulfanilic acid and NED solution, and allowed to stand for a while. The presence of nitrite was indicated by the appearance of violet color. Identification of nitrate was carried out by addition of several drops ferrous sulfate solution and then added few drops of concentrated sulfuric acid slowly through the inner wall of the test tube. The formation of brown ring was to indicate the presence of nitrate.5
Preparation of Absorbance Curve of Nitrite Standard Solution
Four (4) ml of standard solution of nitrite (10.0 μg/ml) was placed into 50 ml volumetric flask, then 2.5 ml sulfanilic acid solution was added and shaken, then allowed to stand for 5 minutes, then 2.5 ml NED reagent was added and then made to mark line with distilled water and homogenized by shaking (0.8 μg/ml). Absorbance of prepared standart solution was observed at wave length of 400-800 nm. Then, absorbance curve was constructed by plotting absorbance versus wave length. This absorbance curve used to determine wave length of maximum absorbance which then used for analysis.1,5
Stability of Nitrite Derivative Absorbance
Four (4) ml of standard solution of nitrite (10.0 μg/ml) was placed into 50 ml volumetric flask, to which 2.5 ml of sulfanilic acid added and homogenized and allowed to stand for 5 minutes, then 2.5 ml NED was added and made to 50 ml volume by adding distilled water and homogenized. Absorbance was determined at maximum absorbance wave-length obtained from absorbance curve (540 nm), and stability of absorbance was determined by measuring absorbance at every minute for 1 hour. The absorbance was shown to be relatively constant within minute 7 to 12.1
Calibration Curve Determination
Different volume (0.5, 1, 2, 3, 4 dan 5 ml) of nitrite standard solution of (10.0 μg/ml) of were transferred into separated 25 ml volumetric flasks, to which then 2.5 ml sulfanilic acid solution was added and homogenized by stirring and allowed to stand for 5 minutes. Then 2.5 ml NED solution was added. Finally, distilled water was added to volume of 25 ml and homogenized. These standard solutions with the series of concentration were of 0.1 µg/ml; 0.2 µg/ml; 0.4 µg/ml; 0.8 µg/ml; 1.0 µg/ml. Absorbance of this solution was observed at wave-length of 540 nm in minute 7 to 12. Absorbance versus concentration of each solution was plotted to construct calibration curve, then linearity of regression equation ( Y= aX + b) and correlation coefficient calculated.1
Determination of Nitrite and Nitrate in Vegetables
Assay of the nitrite in samples was done with procedure previously described1. Around ten (10) g grounded sample transferred into 250 ml beaker glass and then hot distilled water (± 80ºC) was added to make volume of 150 ml. This mixture was homogenized by stirring at temperature of 80oC for 15 minutes on water-bath. This mixture allowed to cool and then transferred into 250 ml volumetric flask, then distilled water added to mark line, then filtered. Around 10 ml of the first filtrate was rejected, and the following filtrate was collected, and used to analyze nitrite and nitrate. Determination of nitrite carried out by transferring ten (10) ml of filtrate into 50 ml volumetric flask, and then 2.5 ml sulfanilic acid solution was added and homogenized by stirring and allowed to stand for 5 minutes, then 2.5 ml NED solution was added, then distilled water added to make 50 ml, and homogenized. Absorbance was observed at wave-length of 540 nm within period of 7 to 12 minutes.The nitrite content was calculated using the regression equation:
Y = aX + b.
Notes:
Y = Absorbance
X = Concentration of nitrite in diluted sample solution determined from regression equation (μg/ml)
Nitrite concentration was calculated:
![]()
Notes:
C = Nitrite concentrationin sample (μg/g)
V = Volume of sample (ml)
Fp = Dilution factor
For nitrate; ten (10) ml of filtrate placed in 50 mlvolumetric flask, then 0.1 g Zn powder and 1 ml HCl 1 N added and allowed to stand for 10 minutes to reduce nitrate to nitrite, and then analyzed as nitrite as above. Nitrite concentration from reduction of nitrate into nitrite was calculated:
A = B – C
Notes:
A = Nitrite concentration from reduction of nitrate into nitrite
B = Total nitrite Content
C = Initial Nitrite concentration in samples
Nitrate content was calculated:
![]()
Notes:
A = Nitrite concentration from reduction of nitrate into nitrite
D = Concentration of Nitrate
Analysis of Vitamin C in Vegetables
Identification of Vitamin C
In test tubes 0.5 ml of sample solution was made to a pH of 6-8 with the addition of NH4OH 1N, then added 3 drops 3% FeCl3, produced the purple color.
In test tubes 0.5 ml of sample solution added 3 drops ammonia silver reagents produced silver ring on the wall of the tube.10
Standardization of 2,6-dichlorophenol indophenol
The amount of 50 mg ascorbic acid was weighed Top of Form and then placed into volumetric flask of 100 ml, then dissolved with acetic metaphosphoric acid 3%, to make 100 ml. From ascorbic acid solution 1 ml pipetted and then transferred into erlenmeyer and added 6 ml acetic metaphosphoric acid solution 3%. Titrated with 2,6-dichlorophenol indophenol solution 0.025% until pink appeared steadily no less than 5 seconds. Blank titration was done using 7 ml acetic metaphosphoric acid 3% and finally titrated with 2,6-dichlorophenol indophenol solution 0.025% until pink steady appeared.10
Notes:
Va = The volume of the aliquot (1 ml)
W = Vitamin C weight (±50 mg)
Vt = The volume of titration (ml)
Vb = The volume of blank (ml)
Vc = The volume of volumetric flask (100 ml)
Quantification of Vitamin C in Vegetables
Ten (10) g grounded sample transferred into 100 ml volumetric flask, then acetic metaphosphoric acid 3% added to make 100 ml, then homogenized and filtered. Around 20 ml first filtrate was rejected, the following filtrate was collected. Two (2) ml of filtrate transferred into an erlenmeyer flask, and then added 5 ml of acetic metaphosphoric acid, then titrated with 2,6-dichlorophenol indophenol solution until pink remained for five minutes. The levels of vitamin C was calculated by the following equation.11
Notes:
Vt = The volume of titration (ml)
Vb = The volume of blank (ml)
VL = The volume of volumetric flask (100 ml)
Vp = The volume of pippeted sampel solution(ml)
Bs = Sample weight (g)Bottom of Form
Statistical Analysis
SPPS for windows version 23.0 was used for statistical analysis. All experiments carried out in six replicates. The data were analyzed using ANOVA. The differences between the mean values were separated using post hoc tests at a significant level of P < 0.05.
Results and Discussion
Nitrite and Nitrate Identification in Samples
From the identification using sulfanilic acid and NED reagents, it was found that samples contained nitrite indicated by the appearance of violet color to prove that all samples contained nitrite. The reaction with antipyrine in dilute hydrochloric resulted in the formation of green color also proved the presence of nitrite. Nitrate identification in samples was carried out using ferrous sulfate and concentrated sulfuric acid found to form brown ring to indicate the presence of nitrate in samples.1
Identification of Vitamin C in Samples
Identification of vitamin C was done using FeCl3 3% and ammonia silver reagents. Vitamin C identification using FeCl3 3% reagent indicated by the appearance of violet color to prove that all samples contained vitamin C. Identification with ammonia silver reagent resulted in brown ring also indicated the presence of Vitamin C in samples.11
The Wave-Length of Maximum Absorption of Nitrite Derivative
Maximum absorption was determined from absorption curve of nitrite derivative solution (10 μg/ml). Nitrite derivative solution at concentration of 10 μg/ml within the range of wave length from 400 nm through 800 nm, and the result is presented in Figure 1.
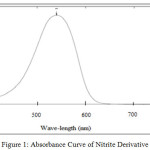 |
Figure 1: Absorbance Curve of Nitrite Derivative.
|
From Figure 1 it is found that maximum absorption was 540 nm which is similar to that the value previously reported1. The wave-length of 540 nm was then used to determine working time for analysis of nitrite and nitrate in samples.1
Working Time for Measurement
Working time for measurement for nitrite and nitrate analysis was determined to know the period of time within which the absorbance of solution still remains stable. Absorbance of nitrite derivative with Griess reagent presented in Figure 2.
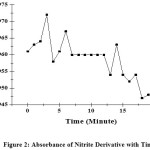 |
Figure 2: Absorbance of Nitrite Derivative with Time. |
From Figure 2 can be seen that the absorbance was stable within minute 7 to minute 12 which is called working time. This working time was then applied in analysis procedure for nitrite and nitrate in samples.1
Calibration Curve of Nitrite Derivative
Calibration Curve made by plotting absorbance versus concentration of each solution, then linearity of regression equation was determined. The calibration curve presented in Figure 3.
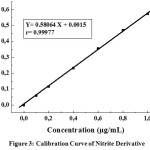 |
Figure 3: Calibration Curve of Nitrite Derivative. |
Regression equation obtained is Y= 0.58064X + 0.0015 with coefficient correlation (r) of 0.99977( where r > 0.999). Quantification of nitrite and nitrate was calculated using this regression equation. From Figure 3 it is found that the correlation coefficient was calculated (r=0.999) which indicates that correlation between concentration and absorbance is high. Calibration curve indicated linearity between concentration and absorbance.1
The Influence of Fertilization on Nitrate, Nitrite and Vitamin C Contents in Vegetable Samples
The influence of organic and inorganic fertilizers on nitrate, nitrite, and vitamin C contents in analyzed samples can be seen in Table 1. and Figure 4 to 7.
Table 1.The Influence of Fertilizations on Nitrate, Nitrite and Vitamin C Contents in Samples.
|
Vegetable |
Type of Fertilizer |
Dose of Fertilizer (g) |
Nitrite (mg/kg) ± SD |
Nitrate (mg/kg) ± SD |
Vitamin C (mg/100g) ± SD |
|
Mustard |
Untreated |
0 |
12.07 ± 0.05a |
15.48 ±0.11a |
106.84 ± 0.79a |
|
Organic |
80 |
12.19 ± 0.14b |
17.22± 0.17b |
117.12 ± 1.63b |
|
|
160 |
12.79 ± 0.07b |
19.11 ± 0.07b |
121.65 ± 0.72b |
||
|
240 |
12.89 ± 0.13b |
25.97 ± 2.42c |
123.89 ± 0.97c |
||
|
Inorganic |
0.3 |
15.33 ± 0.11c |
20.29 ± 0.16c |
113.52 ± 0.71c |
|
|
0.6 |
15.64 ± 0.14c |
25.43 ± 0.10c |
112.80 ± 0.23c |
||
|
0.9 |
19.26 ± 0.09c |
31.66 ± 0.20c |
107.03 ± 0.84c |
||
|
Bok choy |
Untreated |
0 |
12.65 ± 0.05 a |
7.96 ± 0.18 a |
67.29 ± 0.86 a |
|
Organic |
80 |
15.52 ± 0.06 b |
13.04 ± 0.13 b |
95.84 ± 0.43 b |
|
|
160 |
16.73 ± 0.10 b |
11.40 ± 0.14 b |
99.09 ± 0.58 b |
||
|
240 |
19.05 ± 0.04 b |
12.76 ± 0.04 b |
100.10 ± 0.60 b |
||
|
Inorganic |
0.3 |
15.60 ± 0.07 c |
22.53 ± 0.21 c |
77.61 ± 0.85 c |
|
|
0.6 |
18.24 ± 0.12 c |
29.30 ± 0.17 c |
77.22 ± 0.58 c |
||
|
0.9 |
18.57 ± 0.03 c |
33.97 ± 0.11 c |
75.01 ± 1.65 c |
||
|
Spinach |
Untreated |
0 |
15.70 ± 0.08 a |
59.99 ± 0.50 a |
31.74 ± 1.65 a |
|
Organic |
80 |
18.16 ± 0.02 b |
61.13 ± 0.20 b |
38.62 ± 0.75 b |
|
|
160 |
19.39 ± 0.17 b |
62.97 ± 2.39 b |
40.64 ± 1.17 b |
||
|
240 |
21.60 ± 0.21 b |
65.35 ± 0.33 b |
49.39 ± 0.96 b |
||
|
Inorganic |
0.3 |
20.21 ± 0.07 c |
68.22 ± 0.17 c |
36.50 ± 0.52 c |
|
|
0.6 |
22.69 ± 0.03 c |
71.13 ± 0.12 c |
33.76 ± 0.93 c |
||
|
0.9 |
26.27 ± 0.08 c |
85.21 ± 0.31 c |
31.74 ± 1.65 c |
||
|
Lettuce |
Untreated |
0 |
13.78 ± 0.03 a |
25.01 ± 0.21 a |
11.93 ± 0.54 a |
|
Organic |
80 |
14.50 ± 0.09 b |
26.21 ± 0.12 b |
17.83 ± 0.98 b |
|
|
160 |
17.37 ± 0.13 b |
27.03 ± 0.19 b |
21.63 ± 0.49 b |
||
|
240 |
17.90 ± 0.06 b |
27.50 ± 0.06 b |
24.96 ± 0.54 b |
||
|
Inorganic |
0.3 |
15.77 ± 0.02 c |
29.15 ± 0.09 c |
13.93± 0.82 c |
|
|
0.6 |
17.69 ± 0.07 c |
36.55 ± 0.10 c |
13.13 ± 0.56 c |
||
|
0.9 |
19.06 ± 0.06 c |
43.27 ± 0.08 c |
12.24 ± 0.58 c |
Note: Value is the mean of six replicates; Means±SD in each column with different superscript letters different significantly at p < 0.05 compared to without fertilizer.
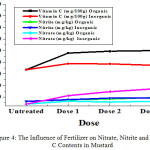 |
Figure 4: The Influence of Fertilizer on Nitrate, Nitrite and Vitamin C Contents in Mustard. Click here to View figure |
Note: Organic Fertilizers (Dose 1= 80 g; Dose 2= 160 g; Dose 3= 240 g); Inorganic Ferlizers (Dose 1= 0.3 g; Dose 2= 0.6 g; Dose 3= 0.9 g)
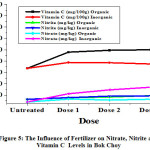 |
Figure 5: The Influence of Fertilizer on Nitrate, Nitrite and Vitamin C Levels in Bok Choy. |
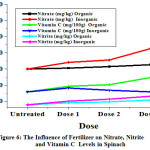 |
Figure 6: The Influence of Fertilizer on Nitrate, Nitrite and Vitamin C Levels in Spinach. |
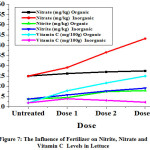 |
Figure 7: The Influence of Fertilizer on Nitrite, Nitrate and Vitamin C Levels in Lettuce. |
From Table 1. and Figure 4 to 7 can be seen that the data obtained showed that nitrite levels in samples without fertilization in mustard, bok choy, spinach, and lettuce were 12.07 mg/kg, 12.65 mg/kg, 15.70 mg/kg, 13.78 mg/kg, respectively. Whereas nitrate levels in samples in mustard, bok choy, spinach, and lettuce were 15.48 mg/kg, 7.96 mg/kg, 59.99 mg/kg, 25.01 mg/kg, respectively. Vitamin C levels in vegetables in mustard, bok choy, spinach, and lettuce were 106.84 mg/100g, 67.29 mg/100g, 38.62 mg/100g, 11.93 mg/100g, respectively.
The effect of fertilization by organic and inorganic fertilizers on nitrite and nitrate levels in analyzed samples increase, but the effect of inorganic fertilizers increase more significant. Vitamin C levels in analyzed samples increased by organic fertlizers but decreased by inorganic fertilizers.
Nitrite levels in mustard with organic fertilizations increased with doses from 12.07 mg/kg (untreated) to 12.89 mg/kg with increasing doses. In bok choy from12.65 mg/kg to 19.05 mg/kg. In spinach from 15.70 mg/kg to 21.60 mg/kg. In lettuce from 13.78 mg/kg to 17.90 mg/kg. Nitrate levels in mustard with organic fertilizations increased with doses from 15.48 mg/kg (untreated) to 25.97 mg/kg with increasing doses. In bok choy from7.96 mg/kg to 12.76 mg/kg. In spinach from 59.99 mg/kg to 65.35 mg/kg. In lettuce from 25.01mg/kg to 27.50 mg/kg.Vitamin C levels in mustard with organic fertilizations increased with doses from 106.84 (untreated) to 123.89 mg/100g with increasing doses. In bok choy from 67.29 to 100.10 mg/100g. In spinach from 31.74 to 49.39 mg/100g. In lettuce from 11.93 to 24.96 mg/100g.
Nitrite levels in mustard with inorganic fertilizations increased with doses from 12.07 mg/kg (untreated) to 19.26 mg/kg with increasing doses. In bok choy from12.65 mg/kg to 18.57 mg/kg. In spinach from 15.70 mg/kg to 26.27 mg/kg. In lettuce from 13.78 mg/kg to 19.06 mg/kg. Nitrate levels in mustard with inorganic fertilizations increased with doses from 15.48 mg/kg (untreated) to 31.66 mg/kg with increasing doses. In bok choy from 7.96 mg/kg to 33.97 mg/kg. In spinach from 59.99 mg/kg to 85.21 mg/kg. In lettuce from 25.01 mg/kg to 43.27 mg/kg.Vitamin C levels inmustard with inorganic fertilizations decreased with doses from 106.84 (untreated) to 107.03 mg/100g with increasing doses. In bok choy from 67.29 to 75.01 mg/100g. In spinach from 31.74 to 31.74 mg/100g. In lettuce from 11.93 to 12.24 mg/100g.
In Table 1. and Figure 4 to 7 can be seen that the effect of inorganic fertilizers is more effective to increase nitrite and nitrate levels than organic fertilizers, as reported by Liu, et al (2014).6 This present study revealed that the nitrate accumulation correlated with the amount of fertilizer applied, because the release of nitrogen from in organic fertilizers is slower than that from in inorganic fertilizers since organic fertilization typically does not provide nitrogen in a readily accessible form.6,10
The similar result was reported by Pavlou, et al (2007)4 who claimed that inorganic fertilizer increased nitrates levels more effective than organic fertilizers.They reported that nitrate levels in lettuce with organic fertilizations increased from 71 mg/kg (untreated) to 311 mg/kg with increasing doses, whereas nitrate levels in lettuce with inorganic fertilizations increased from 71 mg/kg (untreated) to 623 mg/kg with increasing doses. But the nitrate levels obtained in this study is lower than their findings. This might be attributed to several factors such as the type of fertilizers used, location, soil conditions, water sources, and light and harvesting time.1,4,6
The increase of vitamin C levels in samples with organic fertilizers, but decreased by inorganic fertilizers. The level of vitamin C in samples increase with organic fertilizers, decrease with inorganic fertilizers need to be studied. From the above data, vitamin C and other antioxidant content in vegetables may reduce nitrate into nitrite, and then nitrite may react with amine compounds, especially secondary amines to form a carcinogenic nitrosamine. On the other hand, ascorbic acid available in fresh vegetables may prevent the formation of nitrosamine.10,11
Conclusion
Results of this study can be concluded that inorganic fertilization is more influential to increase nitrite and nitrate levels compared to organic fertilization. Vitamin C levels by organic fertilization increased significantly, but vitamin C levels decreased significantly with inorganic fertilization.
Acknowledgement
We gratefully thank to DP2M DIKTI (Directorate of Higher Education) Ministry of Research Technology and High Education, Indonesia through “Hibah PMDSU” Research Grant 2017 for financial support in the study.
References
- Cintya, H.; Silalahi, J.; De Lux, E, P. Der Pharma Chemica. 2016, 8(24), 47-52.
- Raczuk, J.; Wanda, W.; Katarzyna, G. Journal of National Institute of Public Health-National Institute of Hygiene. 2014, 65, 15-20.
- Amr, A.; Hadidi, N. J. Food Composition and Analysis. 2014, 14, 59-67.
CrossRef - Pavlou, G.; Ehaliotis, C.; Kavvadias. Sci. Hortic. 2007, 111, 319–325.
CrossRef - Silalahi, J.; Fattah, A.; Ginting, N.; Yosy.International Journal of PharmTech Research. 2016, 9(8), 422-427.
- Liu, C.; Sung, Y.; Chen, B.; Yu Lai, H.International Journal of Environmental Research andPublic Health. 2014, 11, 4427-4440.
- WHO. JECFA Food Additives. 2009, page 1-5.
- Amr, A.; Hadidi, N. Journal Of Food Composition and Analysis. 2014, 14, 59-67.
CrossRef - EFSA. The EFSA Journal. 2008, 69, 1-79.
- Azad, J.; Farookhnia, A.H.; Kargosha, K. Orient J Chem. 1998, 14, 2.
- Chang, A,; Yang, T,; Riskowski, G. Food Chemistry.2013, 138, 382–388.
CrossRef
Accepted on: 07-08-2018


![]()


