Study of Physical Properties of Zn1-xAgxO Thin Films Deposited by Chemical Spray Pyrolysis
Bhawna Sarwan1,2 and Aman Deep Acharya1,2
1Vikram University, Ujjain, 456010, M. P, India.
2Lovely Professional University, Jalandhar, Punjab, India.
Corresponding Author E-mail: acharyaphysics2011@gmail.com
DOI : http://dx.doi.org/10.13005/ojc/340560
Article Received on : 18-07-2018
Article Accepted on : 23-08-2018
Article Published : 03 Oct 2018
To investigate the influence of Ag concentration on physical properties, the Zn1-xAgxO films were synthesized by chemical spray pyrolysis method. The crystallite size was found to decrease for low concentration of Ag then increase upto 50 nm with increase in Ag content. AFM measurement implies that the roughness and grain size increased due to coalescence of petite grains into larger size. In optical measurement, band gap is found to be decreased with increase in filler concentration.
KEYWORDS:Doping; Spray Pyrolysis Method; Thin Film; ZnO
Download this article as:| Copy the following to cite this article: Sarwan B, Acharya A. D. Study of Physical Properties of Zn1-xAgxO Thin Films deposited by Chemical Spray Pyrolysis. Orient J Chem 2018;34(5). |
| Copy the following to cite this URL: Sarwan B, Acharya A. D. Study of Physical Properties of Zn1-xAgxO Thin Films deposited by Chemical Spray Pyrolysis. Orient J Chem 2018;34(5). Available from: http://www.orientjchem.org/?p=50164 |
Introduction
ZnO is one of the most suitable metal oxide semiconductor having variety of applications, for instance transparent conducting oxides, photodetectors and Light emitting diodes because of its distinctive properties such as direct band gap, large exciton binding energy, excellent thermal and chemical stability, piezoelectric effect etc.1-9 Pure ZnO thin film, although transparent, are usually of low conductivity. Though, practical application of any semiconductor lies on effectual tuning of its physical properties. In order to tune the physical properties of the semiconductors doping is considered as the effective tool. However, n–type ZnO thin film with excellent conductive properties can be obtained by doping in neat ZnO.10 Doping of ZnO thin film with Al, Ga, Sc, Y, Mn, Cu, Ag etc. have been reported to improve its physical properties.1 Group I elements have a tendency to take up inside interstitial sites rather than substitution sites therefore they act as donors.11 Among these dopant Ag was elected as a dopant to study the effect on the physical properties of the film. There are several techniques physical as well as chemical which can be employed to fabricate doped and pure ZnO thin films such as laser deposition, different sputtering methods, atomic layer deposition, chemical vapor deposition, chemical bath deposition, sol–gel, and spray pyrolysis method.12-18 The sputtering and evaporation techniques have been proved to be very exclusive and have some shortcoming such as target utilization effectiveness and arcing. Spray pyrolysis is a magnificent, elementary, resourceful and economically viable technique. In present work we report the structural studies, morphological and optical properties of Ag- doped ZnO thin films.
Sample Preparation
Zn1-xAgxO (x=0, 0.002, 0.0025, 0.005, 0.006, 0.0075, 0.01) thin films were prepared by spray pyrolysis experimental technique. This setup is commonly used for deposition of oxide thin films. The Zinc Oxide thin films were synthesised by aqueous solution of 0.2 M Zinc Nitrate [Zn (NO3)2] and silver nitrate is the precursor opted for Ag doping.19 The optimization have been made by synthesizing the samples by varying temperatures from 200°C to 400°C. After several trials the stable and sticky films were obtained at 400°C. X-ray diffraction for structural studies is performed by using (Bruker D8 ADVANCE). Morphological study was done by using atomic force microscopy (AFM) (Digital instruments Nanoscope E with Si3N4 100 µm cantilever, 0.58 N/m force constant). Optical studies have been performed by using UV-Vis Spectrophotometer (Perkin Elmer Lambda 950) for the wavelength region from 300 nm to 900 nm.
Results and Discussion
Structural Studies
Fig. 1 shows the X- Ray diffraction (XRD) graph of Zn1-xAgxO thin films for x = 0, x = 0.002, x = 0.0025, x = 0.005, x = 0.006, x = 0.0075 and x = 0.01. The XRD measurement of the deposited films revels that the films have polycrystalline nature consisting with hexagonal structure in accordance with JCPDS files (PDF # 891397). The preferred orientation of the films is evidenced by the presence of (002) peak. The other diffraction peaks observed in the X-Ray pattern are (1 0 0), (1 0 1), (1 0 2), (1 1 0), (1 0 3) and (1 1 2), but the intensity of these peaks were obtained to be low as compared to the preferentially oriented (0 0 2) peak. Crystallite size is obtained with the help of eq. 1 (Debye Scherer formula).20
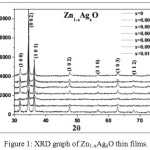 |
Figure 1: XRD graph of Zn1-xAgxO thin films. |
It was observed that the crystallite size was decreased from 54 to 38 nm by increasing Ag content up to 0.25% but for further increase in Ag dopant concentration it increases (i.e 50 nm). This might be because of the larger ionic radius of Ag+ (126 pm) or Ag+2 (97 pm) as compare to Zn2+ (74 pm).21 Due to large difference in the ionic radius, the presence of Ag at Zn site leads to increase in strain of the film (see Fig. 2). The relation used to calculate the strain is as follows (Eq. 2);
Where β is full width at half maximum of XRD peak and θ is angle of diffraction. From the graph, we can see that initially with small Ag doping concentration, the strain was increased but as the Ag doping concentration increased the strain was reduced. The above stated conclusion confirmed the successful incorporation of the filler (Ag) into the ZnO lattice.
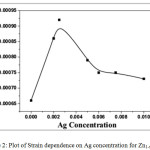 |
Figure 2: Plot of Strain dependence on Ag concentration for Zn1-xAgxO. |
Morphological Studies
The surface studies of Zn1-xAgxO films have been done by using Atomic Force Microscopy displayed in Figure 3. From AFM images, it was observed that the grain size as well as roughness was constantly enhanced with increment of Ag content. The larger grains build up due to coalescence of petite grains into bigger size (see Fig. 3). This result evidenced that Ag doping contributed in grain expansion in a course of action that the several tiny grains coalesce simultaneously to form bigger sized grains.22
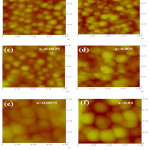 |
Figure 3: AFM micrographs of Zn1-xAgxO thin films. |
Optical Studies
The optical property of the deposited films was investigated by using UV–Vis spectroscopy. Fig. 4 shows the transmittance spectrum of the Zn1-xAgxO thin films with respect to wavelength ranges from 300 nm to 900 nm. The obtained curve shows the better transmittance in visible region, whereas low transmittance is observed in UV region. As a whole it was examined that the transmittance decreased with increasing filler content.
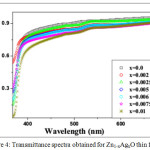 |
Figure 4: Transmittance spectra obtained for Zn1-xAgxO thin films. |
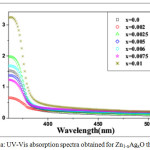 |
Figure 5a: UV-Vis absorption spectra obtained for Zn1-xAgxO thin films. |
The absorbance was found to increase with the Ag content as shown in Fig. 5a. The optical band gap Eg has been determined by Tauc relation (Eq. 5)
(αhν) = A (hν-Eg)n (5)
Here hν is the photon energy, A is proportional constant related to material and ‘n’ is ½ for direct allowed transition and 2 for indirect allowed transition.23 As ZnO was direct band gap thus n=1/2 is expected to direct allowed transition. A graph showing the (αhν)2 versus (hν) is plotted in Fig. 5b. It was observed from the figure that initially a slight increment has been found in band gap but for the higher doping concentration the band gap was reduced up to 2.9 eV. The probable cause behind the decreasing trend of the band gap at the later stage might be due to band shrinkage effect because of increase in filler concentration.24
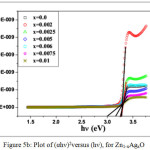 |
Figure 5b: Plot of (αhν)2versus (hν), for Zn1-xAgxO. |
Conclusions
Ag-doped ZnO films were synthesized by chemical spray pyrolysis system. XRD results shows that all the films were polycrystalline having a hexagonal wrutzite type structure. The as-prepared films show preferential growth in (0 0 2) plane. The crystallite size was decreased at low dopant concentration and then increased with increase in Ag content. AFM measurement suggests that both the roughness and grain size was increased due to coalescence of petite grains into larger size. The optical measurement shows reduction in transmittance by adding Ag concentration because of enhancement in mobility and charge carrier concentration.
Acknowledgments
Authors would like to express gratitude to the Center Director of UGC-DAE CSR, Indore for their assistance and support to take advantage of available experimental facilities.
References
- Jeong, S. H.; Park, B.N.; Lee, S. B.; Boo, J. H. Surf. Coat. Technol. 2005, 193, 340-344.
CrossRef - Nakamura, S.; Mukai, T.; Snoh, M. Appl. Phys. Lett. 1994, 64, 1687.
CrossRef - Bagnall, D. M. ; Chen,Y. F. ; Zhu, Z. ; Yao, T. ; Koyama, S. ; Shen, M.Y. ; Goto, T. .Appl. Phys. Lett. 1997, 70, 2230.
CrossRef - Jenotti, A. ; Van de Walle, Chris G. Re. Prog. Phys. 2009, 72,126501.
- Hwang, D. K. ; Oh, Min-Suk; Lim, Jae-Hong; Park, Scong Ju. J.Phys.D.Appl.Phys. 2007,40, R387.
CrossRef - Monakov, E.V. ; Kuzentsov, A.Yu; Snensson, B. G J.Phys D: App.Phys. 2009, 42, 153001.
- Mathew, Jijoy P. ; Varghese, George; Mathew, Jacob. Mater. Sci. Eng. 2015, 73, 012065.
- Nam, Sang-Hun; Kim, Myoung-Hwa; Yoo, Dong Geun; Jeong, Seong Hun; Kim, Doo Yong; Lee, Nae-Eung; Boo, J.-H. Surf. Rev. Lett. 2010, 17,121–127.
CrossRef - Nam, Sang-Hun; Cho, Sang-Jin; Boo, Jin-Hyo Nano. Res. Lett. 2012, 7, 25
CrossRef - Guan, Li. ; Liu, Baoting; Li, Qiang; Zhou, Yang; Guo, Jianxin; Jia, Guoqi; Zhao, Qingxun; Wang, Yinglong; Fu, Guangsheng Phys. Lett. A. 2011, 375, 939–945
CrossRef - Look, D. C. ; Jones, R. L. ; Sizelove, J. R. ;, Garces, N. Y. ; Giles, N. C. ; Halliburton, L.E. Phys. Status Solidi A 2003, 195, 171-177.
CrossRef - Kim, H.; Pique, A. ; Horwitz, J. S. ; Murata, H. ; Kafafi , Z. H. ; Gilmore, C. M. ; Chrisey, D. B. Thin Solid Films 2000, 377-378, 798-802.
CrossRef - Ellmer, K.; Wendt, R. Surf. Coat.Technol. 1997, 93, 21-26.
CrossRef - Lim, J.; Lee, C. Thin Solid Films 2007, 515, 3335-3338.
CrossRef - Omari, E. ; Makhloufi, S. ; Omari, M. J. Sol-Gel Sci. Technol. 2016, 80, 598-605.
CrossRef - Krunks, K. ; Bijakina, O. ; Mikli,V. ; Varema, T.; Mellikov, E. Physica Scripta 1999, 79, 209.
CrossRef - Kokotov, M. ; Biller, A. ; Hodes, G. Chem. Mater. 2008, 20, 4542-4544.
CrossRef - Schuler, T.; Aegerter, M. A. Thin Solid Films 1999, 351, 125-131.
CrossRef - Zhang, Y. ; Zhang, Z. ; Lin, B. ; Fu, Z. ; Xu, J. J. Phys. Chem.B 2005, 109, 19200-19203.
CrossRef - Mansoor Ali, S. ; Farooq,W.A. ; Baig, M. R. ; Shar, M. A. ; Atif, M. ; Alghamdi, S. S. ; Algarawi, M. S. ; Ur-Rehman, N. ; Hammad Aziz, M. Mater.Scien.-Poland 2015, 33, 601-605.
CrossRef - Wang, X. B. ; Song, C. ; Geng, K. W. ; Zeng, F. ; Pan, F. J. Phys. D:Appl. Phys. 2006, 39, 4992-4996.
CrossRef - Abbas Shah, N. ; Ali, A. ; Aqili, A. K. S. ; Maqsood, A. J. Cryst. Grow.2006, 290, 452–458.
CrossRef - Sutanto, H. ; Wibowo, S. ; Nurhasanah, I. ; Hidayanto, E. ; Hadiyanto, H. I. Jour. Chem. Engr. 2016, 6195326, 1-6.
- Aksoy, S. ; Yasemin, C. ; Ilican, S. ; Caglar, M. Optica Applicata 2010, XL,No.1,7-14.

This work is licensed under a Creative Commons Attribution 4.0 International License.
![]()
A New Edition of Web of Science
Journal Impact Factor
2022: 0.5
Five Year: 0.8
Journal is Indexed in

Cabells Whitelist
![]()


