Novel Stress Indicating RP-HPLC Method Development and Validation for the Simultaneous Estimation of Ertugliflozin and Sitagliptin in Bulk and its Formulation
D. China Babu1 , C. Madhusudhana Chetty2 and S. K. Mastanamma3
1Research and Development, Jawaharlal Nehru Technological University Kakinada, Kakinada, A. P. India. and Department of Pharmaceutical Analysis, Santhiram College of Pharmacy, Nandyal, A.P. India.
2Santhiram College of Pharmacy, Nandyal, Kurnool District, A.P. India.
3Department of Pharmaceutical Analysis, University College of Pharmaceutical Sciences, Nagarjuna Nagar, Guntur, A. P, India.
Corresponding Author E-mail: chinababu.rao@gmail.com
DOI : http://dx.doi.org/10.13005/ojc/340543
Article Received on : 14-07-2018
Article Accepted on : 10-08-2018
Article Published : 03 Oct 2018
A selective, sensitive RP-HPLC method was developed for the simultaneous estimation of the Ertugliflozin (ETR) and Sitagliptin (SGT) in bulk and its dosage form. The separation and determination was carried on water’s C18 column capacitate (250X4.6 mm, 5 µm particle size), retention times of Ertugliflozin and Sitagliptin were found to be 2.39 and 4.60 min respectively. The wavelength was fixed at 215nm with PDA detection. The mobile phase was consisted mixture of 0.5 mM potassium dihydrogen ortho phosphate buffer: Methanol in the ratio of 55:45 v/v, pH 5.3 was adjusted with HCl and flow of mobile phase was maintained 1mL/min. The calibration curve was linear and regression co-efficient (R2) value found to be 0.999 and concentration ranging from 37.5-112.5 and 250-750 µg/mL for Ertugliflozin & Sitagliptin respectively. The quantization limit and detection limit of the method were found 0.1 & 0.3 µg/ml and 0.4&1µg/ml for Ertugliflozin & Sitagliptin.
KEYWORDS:Ertugliflozin; Methanol; Reversed Phase High Performance Liquid Chromatography; Sitagliptin
Download this article as:| Copy the following to cite this article: Babu D. C, Chetty C. M, Mastanamma S. K. Novel Stress Indicating RP-HPLC Method Development and Validation for the Simultaneous Estimation of Ertugliflozin and Sitagliptin in Bulk and its Formulation. Orient J Chem 2018;34(5). |
| Copy the following to cite this URL: Babu D. C, Chetty C. M, Mastanamma S. K. Novel Stress Indicating RP-HPLC Method Development and Validation for the Simultaneous Estimation of Ertugliflozin and Sitagliptin in Bulk and its Formulation. Orient J Chem 2018;34(5). Available from: http://www.orientjchem.org/?p=50214 |
Introduction
A novel class of anti-diabetic drugs, which are inhibitors of dipeptidyl-peptidase IV (DPP4), which included sitagliptin, vildagliptin and saxagliptin.1,2,3,4,5 Type 2 diabetes mellitus (T2DM) is a progressive disease, for the treatment of many patients they require combination therapy to maintain over time glycemic levels.6,7
Efficacy and safety of the addition of Ertugliflozin in patients with type 2 diabetes mellitus inadequately controlled with metformin and Sitagliptin.8,9,10 Ertugliflozin is an oral sodium–glucose transporter 2 inhibitor. The study assessed the efficacy and safety of co‑initiation of Ertugliflozin and sitagliptin compared with placebo in patients with T2 DM in adequately controlled on diet and exercise.11,12 Ertugliflozin (1S,2S,3S,4R,5S) ‑5[4 chloro 3[4ethoxyphenyl] methyl] phenyl]1 (hydroxymethyl) 6,7 dioxabicyclo [3.2.1] 2,3,4 triol.13 Sitagliptin chemically7 [(3R) 3 amino 1o xo 4(2,4,5 trifluorophenyl) butyl] 5,6,7,8 tetrahydro3 (trifluoromethyl) 1,2,4 triazolo [4,3a]pyrazine phosphate (1:1) monohydrate.14,15,16 The placebo-adjusted differences in changes from baseline in systolic blood pressure were not statistically significant. Ertugliflozin is used for the treatment a higher prevalence of genital mycotic infections occurred in men and women with Ertugliflozin compared with placebo.17
The most of the methods were reported for the separation and estimation of Sitagliptin, metformin and few are only on estimation of Sitagliptin.18,19,20,21,22,23,24,25 The structures of Ertugliflozin and Sitagliptin showed in figures 1 and 2.
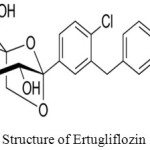 |
Figure 1: Structure of Ertugliflozin. |
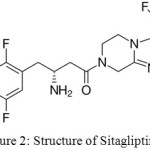 |
Figure 2: Structure of Sitagliptin. |
Experimental
Apparatus
The HPLC was LC Waters (Waters, Milford, MA, USA), Electronic Weighing Balance (LC-GC India), pH Meter (Elico, Model LI 612), Ultrasonic bath (Enertech), Thermostatic oven (Thermolab), Micropipettes (Genie), Data Processing software (Empower 2), Photodiode array detector (Waters, model 2998), Autosampler (Waters, model 717 plus).
Materials and Methods
Reagents and Chemicals
All the chemicals and reagents in this experiment were of analytical grade. Water was double distilled and filtered with a membrane filter. Methanol – HPLC grade (Merck, India), hydrochloric acid and potassium di hydrogen ortho phosphate (SD fine chem, India) were used to prepare mobile phase. Pharmaceutical grade standard drugs viz., Ertugliflozin and Sitagliptin were kindly gifted by Ajanta Pharma Ltd, Mumbai, India. The combined tablet formulation contains 15mg of Ertugliflozin and 100mg of Sitagliptin (Steglujan, Natco) purchased from local market of Kurnool.
Preparation of Standard Solution
Weigh accurately 10 mg of Ertugliflozin & Sitagliptin and transferred in to individual 10ml volumetric flasks with small quantity of mobile phase. The solution was sonicated for 10 min and volume made with mobile phase and concentration 1000 µg/ml. This solution further diluted for the preparation of working standard solutions to get final concentrations of 75 µg/mL of Ertugliflozin and 500 µg/mL of Sitagliptin working standard solutions.
Preparation of Sample Solution
Twenty tablets were weighed and finely powdered. The average weight of tablets was determined. The powder equivalent to 10 mg of ETR was weighed and transferred to a 10 mL volumetric flask. 10 mL of diluent was added to disintegrate tablets completely by using ultra sonicated for 10 min. The aliquot portion of the filtrate was further diluted to get final concentrations 75 µg/mL of ETR and 500 µg/mL of SGT. The solution was filtered through membrane filter. The 20 µL of this solution was injected in to HPLC system.
Chromatographic Settings
The mobile phase used for the development of method was 0.5 mM potassium dihydrogen ortho phosphate buffer: Methanol in the ratio of 55:45 v/v, pH 5.3 was attuned with HCl and flow of mobile phase was filtered through membrane filter and flow rate was kept 1mL/min. The effluents were supervised at 215nm with PDA detector and injected 20 μl of solution through chromatographic column.
Results and Discusion
Method Development
The method was developed with different buffers and organic solvents but the composition of potassium dihydrogen ortho phosphate and methanol was showed good resolution, symmetrical peaks, high theoretical plates, and low retention times of both Ertugliflozin and Sitagliptin. The optimized parameters were showed in table no 1.
Table 1: Optimized conditions for separation & estimation of ETR and SGT.
| S. No | Parameter | Description/Value |
| 1. | Stationary Phase | Waters C18 (250X4.6X5) |
| 2 | Mobile Phase | 0.5 mM Potassium dihydrogen ortho phosphate buffer (pH 5.3) and Methanol in the ratio of 55:45 v/v. |
| 3 | Flow rate | 1 ml/min |
| 4 | Detection Wavelength (Isosbestic Point) | 215nm |
| 5 | Detector | Photo diode array |
| 6 | Injection | Autosampler -Waters, model 717 plus |
| 7 | Injection volume | 20 μl |
| 8 | Column Temperature | 35℃ |
| 9 | Run time | 6 mins |
| 10 | Diluent | Mobile phase |
| 11 | Retention Times | Ertugliflozin : 2.3 minSitagliptin : 4.6 min |
Method Validation
The different method validation parameters were performed as per ICH norms. The all parameters showed good results and they met ICH guidelines of acceptance.26
System Suitability Constraints
The system suitability parameters were showed good theoretical plates 3985 and 6425 for ETR and SGT. The tailing factor was less than 2 for both drugs. They showed good resolution between peaks 11.27 and showed fine peak areas. The chromatograms were showed in figure no 3,4,5 and results were tabulated in table no 2.
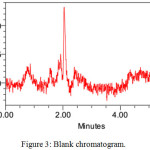 |
Figure 3: Blank chromatogram. |
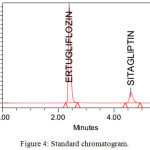 |
Figure 4: Standard chromatogram. |
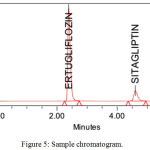 |
Figure 5: Sample chromatogram. |
Table 2: System suitability results of ETZ & SGT.
| S. No | Parameter | ETF | SGT |
| 1 | Theoritical Plate Count | 3985 | 6425 |
| 2 | Peak Area | 12553232 | 6608681 |
| 3 | Peak Height | 2151554 | 240210 |
| 4 | RT | 2.39 | 4.603 |
| 5 | Tailing | 1.58 | 1.35 |
| 6 | Resolution | – | 11.27 |
| 7 | S/N | 6.014 | 670 |
Specificity
The stress degradation studies were implies the specificity of the method. Different parameters were evaluated depend upon separation between degradants and active moiety, as well as method showed ability to analyze analyte in the presence of other products.
Common Suggested Procedure for Linearity
The calibration curve linear over concentration range and R2 values were found to be 0.999 for both Ertugliflozin and Sitagliptin. The standard solution was showed linearity concentration range from 37.5-112.5μg/mL for Ertugliflozin & 250-750μg/mL for Sitagliptin. The data of graphs were showed in figures 6 & 7.
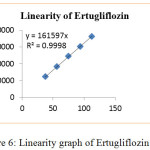 |
Figure 6: Linearity graph of Ertugliflozin. |
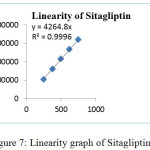 |
Figure 7: Linearity graph of Sitagliptin. |
Precision
The precision was assessed through system precision and method precision. The method precision was estimated through assay. The optimized concentrations of standard and sample solutions were injected in to chromatographic system for the system precision and method precision. The %RSD values varied from 0.55-0.66%. The results of the method showed good precision of the values. The results were tabulated in table no 3 and 4.
Table 3: System precision.
| S. No | Peak Area | |
| ETF | SGT | |
| 1 | 12508045 | 2132304 |
| 2 | 12521643 | 2140220 |
| 3 | 12372333 | 2115333 |
| 4 | 12372949 | 2117149 |
| 5 | 12381516 | 2136308 |
| 6 | 12424701 | 2149651 |
| Average | 12430197.83 | 2131827.00 |
| STDEV | 68481.10 | 12219.79 |
| % RSD | 0.55 | 0.57 |
Table 4: Precision results of ETZ & SGT.
| S. No | Peak Area | % Assay | ||
| ETF | SGT | ETF | SGT | |
| 1 | 12381516 | 2117149 | 98.64 | 98.71 |
| 2 | 12372949 | 2132304 | 98.57 | 99.42 |
| 3 | 12508045 | 2115333 | 99.64 | 98.63 |
| 4 | 12521643 | 2140220 | 99.75 | 99.79 |
| 5 | 12372333 | 2136308 | 98.56 | 99.61 |
| 6 | 12424701 | 2149651 | 98.98 | 100.23 |
| Average | 12430197.83 | 2131827.50 | 99.02 | 99.40 |
| STDEV | 68481.10 | 13386.11 | 0.55 | 0.62 |
| % RSD | 0.55 | 0.62 | 0.55 | 0.62 |
Accuracy
The accuracy of the method was planned by standard addition process. The concentration of 50% solution showed % mean recovery 99.90 & 100.91 for Ertugliflozin & Sitagliptin respectively. The concentration of 100% solution showed % mean recovery 100.18 & 100.29 for Ertugliflozin & Sitagliptin respectively. The concentration of 150% solution showed % mean recovery 100.84 and 99.86 for Ertugliflozin & Sitagliptin respectively. The results were tabulated in table no 5.
Table 5: Accuracy results of ETZ & SGT.
| Parameters | Peak Area | Amount added(µg) | Amount recovered (µg) | % of recovery | % mean recovery |
| Ertugliflozin | |||||
| 50% | 6209103 | 37.13 | 37.09 | 99.90 | 99.90 |
| 100% | 12465890 | 74.26 | 74.48 | 100.29 | 100.29 |
| 150% | 18802423 | 111.39 | 112.33 | 100.84 | 100.84 |
| Sitagliptin | |||||
| 50% | 1071497 | 37.13 | 37.46 | 100.91 | 100.91 |
| 100% | 2127492 | 74.26 | 74.39 | 100.18 | 100.18 |
| 150% | 3181111 | 111.39 | 111.23 | 99.86 | 99.86 |
Limit of detection and Limit of quantification
The LOD and LOQ were estimated 12.71µg/ml-42.37µg/ml for Ertugliflozin and 8.59µg/ml-28.65µg/ml for Sitagliptin.. The limit of detection and quantitation limits performed based on the slope and standard deviation.The method showed ability to detect Ertugliflozin and Sitagliptin at low level of concentrations. The chromatograms were showed in figures 8, 9.
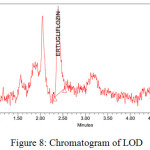 |
Figure 8: Chromatogram of LOD. |
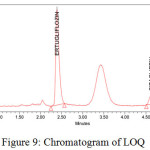 |
Figure 9: Chromatogram of LOQ. |
Robustness
The robustness of the method was performed with deliberate change of flow rate, temperature and mobile phase composition. The changed parameters were showed good percentage assay values. The percentage assay values were in between 99.24% -101.47% for Ertugliflozin and 99.51-101.08 for Sitagliptin respectively. They met acceptance criteria according to ICH guidelines. The results were tabulated in table no 6.
Table 6: Robustness of ETZ and SGT.
| S. No | Parameter | Condition | Ertugliflozin | Sitagliptin | ||||
| RT | Peak Area | % Assay | RT | Peak Area | % Assay | |||
| 1 | Flow | 0.8 ml/min | 1.92 | 12357028 | 99.24 | 3.71 | 2134138 | 99.51 |
| 2 | 1 ml/min | 2.39 | 12553232 | 100.00 | 4.60 | 2144839 | 100.00 | |
| 3 | 1.2 ml/min | 3.82 | 13837314 | 101.47 | 6.01 | 2177984 | 101.08 | |
| 4 | Temp | 30°C | 2.39 | 12553345 | 100.01 | 4.64 | 2141427 | 99.85 |
| 5 | 35°C | 2.39 | 12553232 | 100.00 | 4.60 | 2144839 | 100.00 | |
| 6 | 40°C | 2.40 | 12581162 | 100.23 | 4.66 | 2154377 | 100.36 | |
| 7 | Mobile Phase | B:M 55: 42 v/v | 2.81 | 12532136 | 99.84 | 4.55 | 2139894 | 99.77 |
| 8 | B:M 55:45 v/v | 2.39 | 12553232 | 100.00 | 4.60 | 2144839 | 100.00 | |
| 9 | B:M 55:48 v/v | 2.68 | 12574123 | 100.17 | 4.66 | 2152468 | 100.36 | |
Assay of Ertugliflozin and Sitagliptin in commercial dosage form
The assay of the method was performed for tablet formulation. Powdered 20 tablets from that accurately weighed powder equivalent to 161.56 mg of Ertugliflozin. The final concentration was prepared as 75 μg/mL of Ertugliflozin and 500 μg/mL of Sitagliptin. The % assay values were 99.02% & 99.40% for Ertugliflozin and Sitagliptin. The method was used for routine analysis of Ertugliflozin and Sitagliptin estimation in combined dosage form. The results were showed in table no 7.
Table 7: Assay table for ETR and SGT.
| S.NO | ETR | SGT | ||
| Peak Area | % Assay | Peak Aea | % Assay | |
| 1 | 12381516 | 98.64 | 2117149 | 98.71 |
| 2 | 12372949 | 98.57 | 2132304 | 99.42 |
| 3 | 12508045 | 99.64 | 2115333 | 98.63 |
| 4 | 12521643 | 99.75 | 2140220 | 99.79 |
| 5 | 12372333 | 98.56 | 2136308 | 99.61 |
| 6 | 12424701 | 98.98 | 2149651 | 100.23 |
| Mean | 12430197.83 | 99.02 | 2131827.50 | 99.40 |
| STDEV | 68481.10 | 0.55 | 13386.11 | 0.62 |
| % RSD | 0.55 | 0.55 | 0.62 | 0.62 |
Force Degradation Studies
The stability studies were implemented on the Ertugliflozin and Sitagliptin. The method showed, there was no interference of degradants and blank. The developed RP-HPLC method verifies the proficiency of stability indicating method for the analysis of Ertugliflozin and Sitagliptin. Different stress indicating studies were conducted with 0.1 N HCl, refluxed for 3 H at 70ºC, Base (0.1 N NaOH refluxed for 4H at 70ºC), H2O2 (3% H2O2 Stored at room temperature for 2 H), hydrolytic for 6H at 70oC and UV light (near UV 250 nm for 5 days). The % degradation in all the stress conditions were observed up to 9%. Proposed method was found to be resolved the degraded products from the analytes peak. The average assay results in all the conditions were approximately 90%. The results were tabulated in table 8 and chromatograms of degradation studies were showed from figure no 10 to 14.
Table 8: Degradation studies of ETR & SGT.
| Stress conditions | % Assay of active moiety | |||
| ETZ | % degradation | SGT | % degradation | |
| Acid (0.1 N HCl, refluxed for 2 H at 70ºC) | 91.01 | -8.99 | 90.47 | -9.53 |
| Base (0.1 N NaOH refluxed for 3H at 70ºC) | 91.12 | -8.88 | 90.36 | -9.64 |
| H2O2 (3% H2O2 Stored at room temperature for 2 H) | 90.22 | -9.78 | 90.10 | -9.90 |
| Hydrolytic for 4H at 70oC | 91.29 | -8.71 | 91.08 | -8.92 |
| UV light (near UV 250 for 5 days) | 91.21 | -8.79 | 90.58 | -9.42 |
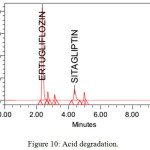 |
Figure 10: Acid degradation. |
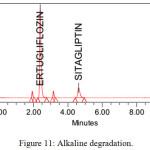 |
Figure 11: Alkaline degradation. |
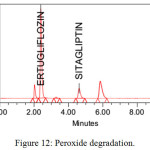 |
Figure 12: Peroxide degradation. |
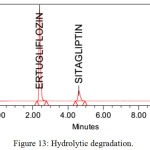 |
Figure 13: Hydrolytic degradation. |
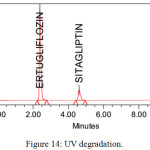 |
Figure 14: UV degradation. |
Conclusion
The developed and validated simultaneous estimation of Ertugliflozin and Sitagliptin by RP-HPLC method was showed low tailing factor and high theoretical plates. The method was exposed good precision, accuracy and robustness, met the all values with in the limit according to ICH guidelines. The linearity graphs showed good linearity between different concentrations solutions of ETR and SGT, the R2 value were found to be 0.999 for both ETR and SGT. The LOD and LOQ values were found to be 0.1 and 0.4 µg/ml for ETR and 0.3 and 1 µg/ml for SGT. The results of LOD and LOQ specified sensitivity of the method and detected ETR and SGT at low concentration. The forced degradation studies were accomplished with acid, alkaline, peroxide, hydrolytic, UV-light conditions. The results of the method were showed high stability and method was used for the routine analysis bulk and its pharmaceutical dosage forms.
References
- Miao, Z.; Nucci, G.; Amin, N., Drug Metab Dispos. 2013, 41, 445–456.
CrossRef - El-Bagary, RI.; Elkady, EF.; Ayoub, BM., Int J Biomed Sci. 2011,7,62–69.
- Jiu, X.F.; Nei, W.; Xu, S.; Min,Y., Journal of Chinese Pharmaceutical Science.2011, 20, 63–69.
CrossRef - Sahasrabudhe, V.; Terra, S G.; Hickman, A.; Saur, D.; Shi, H., J Clin Pharmacol. 2017,57(11),1432-1443.
CrossRef - Terra, S G.; Focht, K.; Davies, M.; Frias, J.; Derosa, G., Diabetes Obes Metab.2017, 19,721–728.
CrossRef - Lauring, B.; Liu, J.; Da Gogo‐Jack, S.; Amorin, G., 52nd Annual Meeting of the European Association for the Study of Diabetes (EASD). 2016, 12‐16, Munich, Germany.
- Shyamala, M.; Mohideen, S.; Satyanarayana, T.; Narasimha Raju, CH.; Suresh Kumar, P.; Swetha, K., Am J Pharm Tech Res. 2011,1,193–201.
- Srinivasa Reddy.; Imran Ahmed.; Iqbal Ahmad.; Arindam Mukhopadhyay., Journal of Chromatographic Science. 2015, 53(9), 1549–1556.
- Patel, TR.; Patel, TB.; Suhagia, BN., Indo Am J Pharm Res. 2014,4,1993–1999.
- P.Ramalingam,V.; Udaya Bhaskar,Y.; Padmanabha Reddy, K.; Vinod Kumar., Indian J Pharm Sci. 2014, 76(5), 407–414.
- Ghazala, K.; Dinesh, S.; Agrawal, YP.; Neetu, S.; Avnish, J.; Gupta, AK., Asian J Biochem Pham Res. 2011, 2, 223–229.
- Tarkase, K.N.; Madhuri, B.; Sarode Sumit, A.; Gulve and Ashwini Gawade., Scholars Research Library Der Pharmacia Lettre. 2013, 5 (3),315-318.
- Venkateswararao, P.; Lakshmanarao, A.; Prasad,S.V.U.M., Indo Am J Pharm Res.2018,5(4),2616-2617.
- Karimulla, S K.; Vasanth, P M., Ramesh, T.; Ramesh, M., Scholars Research Library Der Pharmacia Lettre. 2013, 5 (5),168-174.
- Arun, M.; Kashid Anup, A.; Dhange Vandana, T.; Gawande Pankaj, B.; Miniyar Prasanna, A.; Datar Shashikant Dhawale C., Am. J. PharmTech Res. 2012, 2(5),805-811.
- Chellu, SN.; Malleswararao, M.; Suryanarayana, V., Sci Pharm. 2012,80,139–152.
CrossRef - Pratley, RE.; Eldor, R.; Raji, A.; Golm, G.; Huyck, SB., Diabetes Obes Metab.2017,19(5),721-728.
CrossRef - Sankar, A.S.K.; Suraj Sythana.; Aakula Jhansi.; Shanmuga sundharam, P.;sumithra, M., International Journal of Pharm Tech Research. 2013, 5(4), 1736-1744.
- Swales, JG.; Gallagher, RT.; Denn, M.; Peter, RM., J Pharm Biomed Anal. 2011,55, 554–551.
CrossRef - Pathade, P.; Imran, M.; Bairagi, V.; Ahire, Y., Journal of Pharmacy Research. 2011, 4(3), 871–873.
- Sohajda, T.; Hui, WH.; Zeng, LL.; Li, H.; Szente, L.; Noszal, B.; et al., Electrophoresis. 2011, 32, 2648–2654.
CrossRef - Jain, P.; Chaudhary, A.; Desai, B.; Patel, S.; Patel, S.; Shimpi, H., Int J Drug Dev Res. 2011,3,194–199.
- Bala Sekaran, C.; Prameela Rani, A.; Int J Pharm Sci., 2010, 2, 138–142.
- Zeng, W.; Musson, DG.; Fisher, AL.; Michael, LS.; Schwartz, JS.; Wang, AQ., J Pharm Biomed Anal. 2008,46, 534–542.
CrossRef - Herman, GA.; Stevens, C.; Van Dyck, K.; Bergman, A.; Yi, B.;et al., Clin Pharmacol Ther. 2005, 78, 675–688.
CrossRef - ICH, Q2 (R1) Validation of analytical procedures: Text and methodology, Proceedings of the International Conference on Harmonization, November, 2005.

This work is licensed under a Creative Commons Attribution 4.0 International License.
![]()
A New Edition of Web of Science
Journal Impact Factor
2022: 0.5
Five Year: 0.8
Journal is Indexed in

Cabells Whitelist
![]()


