Molecular Dynamics Simulation of Methane and Carbon Dioxide Permeation Through A Layered Inorganic Membrane
Lukman Hakim , Karina Puspitasari and Ravi Mahesta
Department of Chemistry, Faculty of Science, Brawijaya University, Jl. Veteran, Malang, Indonesia.
Corresponding Author E-mail: lukman.chemist@ub.ac.id
DOI : http://dx.doi.org/10.13005/ojc/340507
Article Received on : 13-07-2018
Article Accepted on : 13-08-2018
Article Published : 02 Oct 2018
Molecular dynamics simulations are performed to investigate the permeation and separation of methane and carbon dioxide mixture through a layered inorganic membrane at high temperature to circumvent carbon dioxide adsorption on membrane surface. The simulations show that a single layer membrane with narrow cylindrical-pore favors methane permeation over carbon dioxide. When a slit-space is present along with the cylindrical-pore in a layered inorganic membrane, the membrane can be tailored to favor carbon dioxide over methane. The comparison of the permeation rates obtained directly from simulation and those from Knudsen flow calculation highlights the prominence of molecular sieving mechanism in determining the permeation behaviors of methane and carbon dioxide through a narrow opening.
KEYWORDS:Carbon Dioxide; Gas Permeation; Gas Separation; Inorganic Membrane; Methane; Molecular Dynamics
Download this article as:| Copy the following to cite this article: Hakim L, Puspitasari K, Mahesta R. Molecular Dynamics Simulation of Methane and Carbon Dioxide Permeation Through A Layered Inorganic Membrane. Orient J Chem 2018;34(5). |
| Copy the following to cite this URL: Hakim L, Puspitasari K, Mahesta R. Molecular Dynamics Simulation of Methane and Carbon Dioxide Permeation Through A Layered Inorganic Membrane. Orient J Chem 2018;34(5). Available from: http://www.orientjchem.org/?p=50138 |
Introduction
A lot of efforts to address problems in environment and industrial process rely on gas separation techniques. Methane and carbon dioxide gases have been a long-time subject of research interest due to their industrial importance and environmental impact as greenhouse gases. Methane is the primary component of natural gas, but its mining is often contaminated with carbon dioxide that forms acid in the presence of water vapor, causing pipe corrosion during the gas transportation through the pipeline. The rising of methane and carbon dioxide level in the atmosphere is mainly from anthropogenic emission and it is projected to increase due to economic growth and industrial development. Therefore, the need for a reliable gas separation methods to remove carbon dioxide will see an increasing demand with the continuous effort to upgrade the quality of natural gas, biogas, landfill gas, and atmospheric environment.1–3
There is a vast amount of reports on separation technologies for methane and carbon dioxide. These include chemical absorption,4 pressure swing adsorption (PSA),3,5,6 solid-phase adsorption, and membrane separation. Separation using membrane is widely utilized in the laboratory and industrial scale because of the reusability, low cost, high efficiency, low pollution, and simple in operation. Commercial membranes are mostly built from the organic polymer which can be easily functionalized by attaching a particular functional group of interests. However, the poor thermal and chemical resistance of the organic membranes restrict their use to moderate condition only. On the contrary, the inorganic membrane is known to have a higher thermal and mechanical stability that enables a continuous separation to be carried at high temperature and pressure.7 The latter situation is considered to be advantageous for gas separation since the kinetic of permeation can be expected to be proportional to both temperature and pressure. A wide array of solid material for selective carbon dioxide removal has been reported such as metal-organic framework (MOF),8–13 zeolite,14–17 graphene,18,19 and clay.20
Regardless of the abundant information on the potential materials that can be used for methane and carbon dioxide separation, a systematic study to investigate the influence of membrane structure to the permeation of both gases at the microscopic level is scarcely reported.21 In particular, pore size and shape are the key parameters that determine the performance of the porous membrane. However, the reported works were mostly carried out at ambient temperature where the separation was characterized by adsorption of carbon dioxide on pore surface. In this work, molecular dynamics (MD) simulation method is used to study the effect of structural parameters on the gas permeability at high temperature to circumvent the adsorption of carbon dioxide. The method enables a fundamental investigation on molecular sieving mechanism for gas separation by providing an ideal inorganic membrane model and microscopic detail of the permeation process. The MD simulation has been extensively used to examine the adsorption of carbon dioxide on a 3D network of porous carbon,22 zeolite-like MOF,23–25 and to screen zeolite structures that potentially useful for gas separation.26 The relationship between gas permeation and the structural parameter of the membrane is an important knowledge to tailor a particular membrane material to suit the required separation condition.
Models and Simulations
Potential Models
The potential energy is described as the sum of potential energy arising from pair-interaction. The non-bonded pair-interaction is modeled with Lennard-Jones (LJ) 12-6 potential and electrostatic interaction. Methane is modeled as a spherical united-atom interacting with a single LJ site. The united atom model was reported to be useful in describing hydrocarbon.27 Carbon dioxide is modeled as a linear rigid rotor whose length is 0.232 nm, with a positive charge positioned at the center carbon atom, two negative charges are distributed at both oxygen atom, and three LJ site at each atom, which is similar to MSM potential model.28 The inorganic membrane is modeled with porous ceramic MgO with rock-salt configuration. This material is known for its stability and potential for carbon dioxide separation.29–31 Both Mg and O are each modeled as a charged single LJ site. The pair-potential parameters are summarized in Table 1.
Simulation Cell
The simulation cell (dimensions: 4.212´2.527´14.86 nm) consists of two compartments separated by an inorganic membrane. One of the compartment is occupied by a mixture of methane and carbon-dioxide (ρ = 0.21131 g cm-3) with 1:1 mole ratio, and the other compartment was left in a vacuum state. The vacuum compartment will be mentioned as the target compartment. Two repulsive walls are added to isolate the compartment from the surrounding. Each membrane layer consists of a cylindrical pore, and the layers are separated to each other to form a slit space. A schematic illustration of the simulation cell is shown in Figure 1.
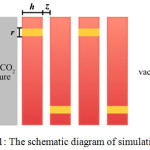 |
Figure 1: The schematic diagram of simulation cell.
|
Inorganic membrane layers of thickness h are positioned in the middle of simulation cell. The layers are separated to each other at the distance of z, thus creating a slit-geometry space. A cylindrical pore of radius r, shown as a yellow path in the membrane, is made to enable gas diffusion through the membrane layer.
Table 1: Pair-potential parameters for methane, carbon dioxide, and MgO models used in this work.
|
Site |
q / e |
σ/ nm |
ε/kJ mol-1 |
| CO2 | |||
|
C |
+0.66450 |
0.2785 |
0.2411 |
|
O |
-0.33225 |
0.3064 |
0.6901 |
| CH4 | |||
|
C |
0 |
0.3758 |
1.2355 |
| MgO | |||
|
Mg |
+2.00 |
0.2377 |
0.0440 |
|
O |
-2.00 |
0.2511 |
1.2827 |
The coulombic interaction site is characterized by an electrostatic charge q. The LJ 12-6 potential is characterized by e that describes the depth of potential-energy well and s that is equal to the double of van der Waals radius.
Simulation Method
Molecular dynamics simulations at constant-temperature and constant-volume are performed using GROMACS 4.6.5 package32 to investigate the diffusion of methane and carbondioxide through the layered inorganic membrane. The periodic boundary condition is applied in the two-dimensional lateral direction along the membrane layers. The pair potential energy is smoothly truncated at 0.865 nm using a switching function that takes effects from 0.665 nm separation. The Leap-Frog algorithm is implemented to integrate the equation of motion with time-step of 2 fs, and the trajectory is recorded every 200 fs. The temperature is maintained at 100°C, and 300°C in some cases, using Nöse-Hoover thermostat. The temperatures are selected to represent a reasonably high temperature to circumvent carbon dioxide adsorption. Each simulation consists of at least 5´106 MD steps.
Results and Discussion
Within the framework of classical trajectory, the separation of methane and carbon dioxide mixture through an inorganic membrane is mainly based on the difference of molecular size and shape in response to the membrane pore geometry. The employed potential model assumes methane as an LJ sphere with a single interaction site, and the molecular diameter is proportional to the s parameter given in Table 1. In case of carbon dioxide, the molecule is assumed to be a linear rigid-rotor with three interaction sites that each consists of LJ and coulombic parameters. The projected molecular-size of carbon dioxide to the normal plane of the membrane surface depends on the spatial orientation of the molecule. For example, given that the molecule size is roughly described by the double of van der Waals radius, the projected molecular-size of carbon dioxide is 0.5384 nm when the molecular axis is positioned parallel to the plane of membrane surface; and reduced to 0.3064 nm when the molecular axis is positioned perpendicular to the plane of membrane surface. The projected molecular-size of methane, on the other hand, is constant at 0.3758 nm. In addition, the coulombic interaction between carbon dioxide and the inorganic membrane also add to the complexity in comparing the exact size between methane and carbon dioxide inside the membrane’s pore, since the size of soft sphere model is also influenced by the gradient of repulsive part of the potential energy.33
Single Layer Inorganic Membrane
In the attempt to systematically investigate the permeation of methane and carbon dioxide mixture through the inorganic membrane, MD simulations are initially carried out for a simplified system where two compartments are separated with a certain thickness (h) of a single layer inorganic membrane. The membrane is modeled as a ceramic MgO whose lattice unit is a cubic with unit cell length of (a =) 0.4212 nm, and it is treated as a rigid crystal without thermal motion during the course of simulation. The membrane consists of a cylindrical pore with the radius of r that allows permeation of gas molecule to the target compartment.
In case of a narrow cylindrical pore, r= 0.3 nm, MD simulations shows that the methane permeation is favored over carbon dioxide at 100x°C, as shown in Figure 2.The density of gas in target-compartment and initial-compartment are both shown in the Figure. The sluggish curve fluctuation arises from the possibility for the gas at target-compartment to flow back to the initial-compartment. Figure 2 also shows that the methane permeation is inversely proportional to the membrane thickness, i.e. the travel distance between compartments. The permeation of carbon dioxide, however, remains low at all membrane thickness. While the density curve of methane in the target-compartment resembles an equilibrium fluctuation, the density curve in the initial-compartment shows a straight/constant line which indicates that there is no methane that enter the pore opening from the initial-compartment. As the methane molecules permeate faster through the membrane pore and the mole-fraction of methane in the initial-compartment drops, it turns out that the carbon dioxide is condensed on the membrane wall near the pore opening and hinders further methane permeation. A separate simulation shows that the condensation does not occur when the mole-fraction of methane in the mixture is kept high. Therefore, the constant curves in Figure 2 do not show the true equilibrium state between compartments.
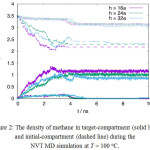 |
Figure 2: The density of methane in target-compartment (solid line) and initial-compartment (dashed line) during the NVT MD simulation at T = 100oC. Click here to View figure |
The density of carbon dioxide in target-compartment (filled-circle) and initial-compartment (open-circle) are also plotted. Both compartments are separated by a membrane with cylindrical pore opening of radius (r =) 0.3nm and thickness of h. Here the membrane thickness is expressed as an integer times to the crystal unit-cell length a, where a = 0.4212 nm.
Here the permeation can be considered to be driven by two factors: the difference in concentration between two compartments, and the difference in size between molecules. At the initial stage, the higher permeation rate of methane enables methane molecule to occupy the target compartment rapidly. The built-up concentration and pressure in target compartment then hamper the permeation of the slower carbon dioxide, which suggests that a mixture with even higher mole fraction of methane will further suppress the permeation of carbon dioxide. The higher permeation of methane can be considered as the size-driven permeation of a gas molecule through a cylindrical pore, and it is dependent on the projected size of the molecule to the circular area of the pore, i.e. the normal plane of the membrane layer. In case of the methane molecule, the spherical united-atom model provides an independent projected molecular-size during the course of simulation. On the other hand, the projected molecular-size of carbon dioxide changes with molecular orientation in thermal rotational-motion. In order to illustrate this, a molecular dynamics simulation of the same system is performed at 300°C, and the results shows that the permeation of the carbon dioxide becomes similar to that of methane at this high temperature, as shown in Figure 3. High temperature increases the molecular rotational frequency for carbon dioxide and changes its projected-molecular size more rapidly, thus increasing the probability of carbon dioxide to align its spatial orientation to fit the geometry of pore within the simulation time. This can be quantified in term of reorientational auto correlational function C(t),
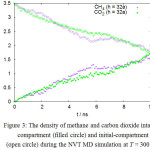 |
Figure 3: The density of methane and carbon dioxide intarget-compartment (filled circle) and initial-compartment (open circle) during the NVT MD simulation at T = 300oC. |
Both compartments are separated by a membrane with cylindrical pore opening of radius (r =) 0.3 nm and thickness of h.
![]()
where
![]()
is a unit vector along the molecular axis. The C(t) quantity describes a decaying memory of the initial spatial-orientation over time. Figure 4 shows that the function C(t) for carbon dioxide dies rapidly at high temperature, within 5 ps at 300°C, as a consequence of higher frequency in thermal rotational motion. In contrast, however, this also suggests that methane and carbon dioxide separation is more evident at a lower temperature, albeit hampered by a decrease in diffusion rate. The slope of r versus t shows that the permeation of methane is slower at higher temperature. This can be explained from the first factor, that is the concentration or pressure on target compartment is now built faster with the additional permeation of carbon dioxide.
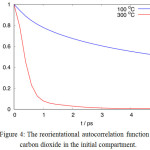 |
Figure 4: The reorientational autocorrelation function of carbon dioxide in the initial compartment. |
The higher permeation rate of methane over carbon dioxide can also be presumed to the fact that both species have a different molecular mass. The inverse relationship between the permeation rates of a gas species that goes through a narrow opening with its molecular mass is well described in Knudsen flow mechanism. However, the simulation results at 300°C, as shown in Figure 3, suggest that the preference to methane here is determined by molecular size instead of the molecular mass. If the pore size is large enough, so that the sieving effect due to the molecular size can be excluded, the lighter molecule can be expected to permeate faster. Figure 5 shows the permeation of hypothetical-methane and carbon dioxide mixture through a cylindrical pore of radius (r =) 0.8242 nm. The permeation here is expressed as the ratio between the molecule number of a gas species that entered the target compartment, N(t), to the total molecule number of that gas species in the system, N0.In this simulation, the methane molecule is substituted with an LJ sphere assuming methane parameters for the interaction energy, but with different molecular mass. From the slope of permeation curve at the initial stage of simulation, it is evident that the permeation rate in this case decreases with the increase of molecular mass. It is, however, important to note that the number of the permeated molecule, averaged at the end of the simulation, itself does not linearly dependent to the initial permeation rate. Moreover, the fluctuation of permeation-curves become more sluggish since the large pore opening increase the occurrence of a reversed gas-flow.
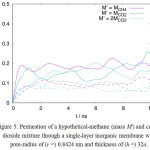 |
Figure 5: Permeation of a hypothetical-methane (mass M‘) and carbon dioxide mixture through a single-layer inorganic membrane with pore-radius of (r =) 0.8424 nm and thickness of (h =) 32a. Click here to View figure |
The curves are smoothed for better clarity.
Layered Inorganic Membrane
The system with layered inorganic membrane forms a slit-geometry space in-between the layer. If the interlayer distance is in the order of molecular size, the slit-geometry space becomes a quasi-two-dimensional opening where the gas molecules can permeate, and such opening is expected to favor a particular molecule based on its geometry and size.
The permeation of methane and carbon dioxide mixture through the layered inorganic membrane is investigated using MD simulation at constant volume and temperature of 100°C. The simulated system consists of four layers, each has a single cylindrical-pore of radius r with thickness (h =) 2a, and the space between two layers serves as a slit-geometry pore of width z. The snapshots of simulation cell, taken at the initial stage of simulation and during the permeation process, are shown in Figure 6. The visualization of the system evolution shows that there is no gas-condensation observed in-between two membrane layers, at least within the simulated time.
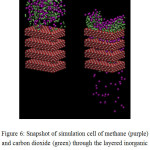 |
Figure 6: Snapshot of simulation cell of methane (purple) and carbon dioxide (green) through the layered inorganic membrane at the initial time-step (left) and during the permeation process (right). |
The results on permeation of each gas species from the MD simulations through the layered inorganic membrane is shown in Figure 7. Compared to the case of the single layer inorganic membrane, as discussed in the previous section, the notable difference is that the permeation preference to a gas species is influenced by the interlayer separation distance, i.e. the slit width. At the interlayer separation distance of z = 0.3 nm, carbon dioxide permeation is favored over methane, as shown by the carbon dioxide permeation curve that consistently positioned above the methane curve, regardless of the cylindrical-pore radius. The narrow cylindrical-pore has been shown to favor the methane molecule; thus, the methane permeation must be hindered by the slit-geometry space between layers. This suggests that the quasi-two-dimensional space, formed by the narrow interlayer separation, may favor the permeation of molecule with rigid-linear geometry over the spherical molecule of similar molecular size. Similar behavior is also observed in the permeation of the carbon dioxide through zeolites of CHA and DDR morphologies.26 The two-dimensional character of this slit-space disappears as the interlayer separation become larger. When the interlayer distance is increased to z = 0.5 nm, methane permeation is favored, and the permeation rate of carbon dioxide is suppressed. The results then become consistent with the case of single-layer inorganic membrane with cylindrical-pore.
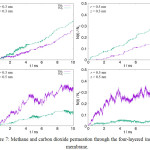 |
Figure 7: Methane and carbon dioxide permeation through the four-layered inorganic membrane. |
Each layer has a thickness of (h =) 0.824 nm, and consists of a cylindrical pore of radius r. The interlayer separation results to a slit-geometry space whose width is z.
Interestingly, at the interlayer separation distance of z = 0.5 nm, the large cylindrical-pore opening is shown to suppress carbon dioxide permeation. The carbon dioxide permeation curve in the system with cylindrical-pore of radius 0.5 nm is lower than that of radius 0.3 nm. Since the permeation of gas molecule between compartments is driven by the gradient of concentration or pressure across the space, it can be argued that the permeation profile is determined by the first gas species that can largely occupy the target compartment. In above case, the large flux of methane permeation to the target compartment, at the initial stage of permeation, rapidly decreases the concentration or pressure difference between two compartments, which in turn further suppress the permeation of carbon dioxide. This condition is invariant to the change of cylindrical-pore radius between r = 0.3 to 0.5 nm. Similarly, at the interlayer separation distance of z = 0.3 nm, the permeation to carbon dioxide increase with the cylindrical-pore opening radius. Figure 7 further shows that the increase of carbon dioxide permeation at r = 0.5 nm, on the latter half of simulation time, is accompanied with the decrease in methane permeation. This behavior is consistent with the prior argumentation, i.e. the permeation profile in general is determined by the first gas that can largely occupy the target compartments.
Knudsen flow
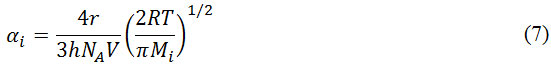
In the absence of condensation or adsorption, the permeation of gas molecule through narrow opening can be considered to follow the Knudsen flow mechanism.34 For a gas molecule that permeates through cylindrical-pore of radius r at constant temperature T, the Knudsen diffusion is expressed as
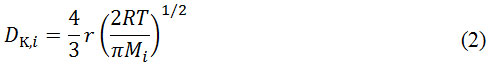
With Mi is the molar mass of the i-th gas species, and R is the gas constant. The Knudsen diffusion DK,i is a constant quantity that inversely proportional to the molecule molar mass. This is in line with the change of the slope of permeation curve shown in Figure 5 due to the shift in molecular mass.
The permeation rate of the i-th gas species, qi(t), is defined as the flux of molecule transferred per unit time t and per unit area A,
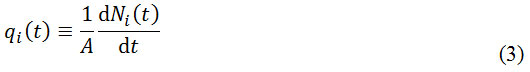
Since the quantity of molecule number in target compartment, Ni(t), is readily available from the simulation trajectories, the permeation rate can be directly calculated from simulation results by fitting the permeation curve versus time with a third-order polynomial.
If the permeation follows Knudsen mechanism, the permeation rate is proportional to the Knudsen diffusion constant and the spatial gradient of concentration c,
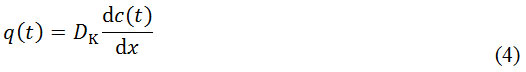
Where x represents the spatial direction on which the gradual change in concentration is observed. In this case, x is equal to the direction of the narrow opening where the gas permeates, i.e. the cylindrical pore. The pore opening connects two compartments, each of different concentration. If the concentration gradient inside the pore is approximated to be linear and the gas is assumed to behave ideally, and since both compartments have the same volume V, the above equation can be rewritten as
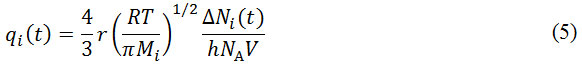
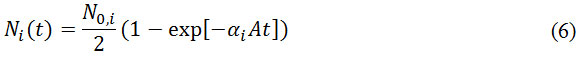
where ΔNi(t) refers to the difference of concentration of the i-th gas species between compartment at an instant time of t, NA is Avogadro number, and h is the pore length, i.e. the molecule’s travel distance inside the pore. If N0,i is the number of i-th species molecule in the initial compartment, and Ni (t)is the number of molecule in the target compartment, then DNi (t) = N0,i – 2Ni (t). The integration of equation (5) gives
Where
In Knudsen flow mechanism, equation (5) shows that permeation goes to zero as the number of gas molecule in target compartment increases, and equation (6) shows that the equilibrium is reached when the number of molecules in two compartments is equal.
In a non-ideal system, equation (5) does not hold since the permeation rate depends on the concentration of overall gas in both compartments, and the permeation rate according to Knudsen flow mechanism cannot be calculated. However, if the information on concentration gradient is obtained from MD simulation, instead from equation (6), the permeation rate then can be calculated according to Knudsen flow mechanism using equation (4), and the results are shown in Figure 8. The left-hand plot in Figure 8 shows the permeation rate of methane and carbon dioxide mixture through a single layer inorganic membrane, and the right-hand plot is the permeation rate of the same mixture through the four-layered inorganic membrane. Since the carbon dioxide molecule is heavier than the methane molecule, the Knudsen flow mechanism predicts for slower initial permeation rate of carbon dioxide for both systems.
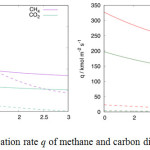 |
Figure 8: The permeation rate q of methane and carbon dioxide at 100°C. |
Left: permeation through a single layer inorganic membrane with cylindrical pore whose radius is (r =) 0.3 nm and the thickness is (h =) 32a. Right: permeation through the four-layered inorganic membrane with cylindrical pore whose radius is (r=) 0.5 nm, and interlayer distance separation is (z =) 0.5 nm. The direct calculation result from MD simulation is shown with dashed-line, and the results from Knudsen-flow approximation is shown with solid line.
The discrepancy between the results from Knudsen flow calculation and the direct calculation from MD simulation stem from the molecular sieving mechanism which allow methane to rapidly fill the target compartment at the initial stage of simulation. As the number of methane increases in the target compartment, the permeation rate decreases. In case of layered-membrane, the addition of slit-geometry pore contributes to extend the molecule’s travel distance and abruptly change its trajectory. The complex pore-geometry significantly decreases permeation. The Knudsen flow mechanism largely overestimates the simulation results due to the slower permeation that keeps the difference in the number of gas molecules between compartments, DNi(t), to be large; therefore, the calculation predicts for a higher permeation rate. Overall, the discrepancy from Knudsen flow highlights the role of molecular-sieving mechanism in controlling the permeation. The higher deviation in the case of four-layered inorganic membrane emphasizes that the effect of molecular sieving mechanism is more prominent here compared to the single layer membrane case.
Conclusion
The permeation of methane and carbon dioxide gas mixture through an inorganic membrane at a high temperature of 100 °C is investigated using MD simulations. The results show that the permeation of methane through a single layer membrane with a narrow cylindrical-pore opening is favored over carbon dioxide permeation. This geometrical preference, however, disappear at a higher temperature of 300oC. The deviation from Knudsen flow mechanism, even for such simple system, highlights the importance of molecular sieving mechanism in determining the permeation process of methane and carbon dioxide through a narrow opening. However, in case of a wide cylindrical-pore opening where the molecular sieving effect can be excluded, the initial permeation rate is shown to be inversely proportional to the molecular mass. The presence of slit-geometry opening, which is formed from the interlayer separation distance between two layers of membrane, provides an enhancement to the molecular sieving process. The combination of cylindrical and slit pore enables the layered membrane to selectively allow the membrane to favor the permeation of either methane or carbon dioxide. Higher separation of methane and carbon dioxide can be expected by utilizing layered inorganic membrane by tailoring membrane thickness, pore radius, and interlayer separation distance.
Acknowledgment
The work is funded by the research grant from DPRM Indonesian Ministry of Research, Technology, and Higher Education; and the DPP/SPP from Brawijaya University. The authors are grateful to Reni Martiana for her help at the initial stage of the simulation work, and to Dr. Hideki Tanaka for valuable discussions.
Authors’ contributions: L.H. designed the research, performed parts of the simulation works, analyzed the data, and wrote the manuscript. K.P and R.M performed parts of the simulation works and analyzed the data.
References
- Sumida, K.; Rogow, D. L.; Mason, J. A.; McDonald, T. M.; Bloch, E. D.; Herm, Z. R.; Bae, T. H.; Long, J. R. Chem. Rev. 2012, 112 (2), 724–781.
CrossRef - Vrbová, V.; Ciahotný, K. Energy and Fuels 2017, 31 (9), 9393–9401.
CrossRef - Cavenati, S.; Grande, C. A.; Rodrigues, A. E. Energy & Fuels 2005, 19 (6), 2545–2555.
CrossRef - Rao, A. B.; Rubin, E. S. Environ. Sci. Technology 2002, 36 (20), 4467–4475.Cavenati, S.; Grande, C. A.; Rodrigues, A. E. Chem. Eng. Sci. 2006, 61 (12), 3893–3906.
- Cavenati, S.; Grande, C. A.; Rodrigues, A. E. Energy and Fuels 2006, 20 (6), 2648–2659.
CrossRef - Pera-titus, M. Chem. Rev. 2014, 114 (2), 1413–1492.
CrossRef - Bae, Y. S.; Mulfort, K. L.; Frost, H.; Ryan, P.; Punnathanam, S.; Broadbelt, L. J.; Hupp, J. T.; Snurr, R. Q. Langmuir 2008, 24 (16), 8592–8598.
CrossRef - Venna, S. R.; Carreon, M. A. J. Am. Chem. Soc. 2010, 132 (1), 76–78.
CrossRef - Thallapally, P. K.; Tian, J.; Kishan, M. R.; Fernandez, C. A.; Dalgarno, S. J.; McGrail, P. B.; Warren, J. E.; Atwood, J. L. J. Am. Chem. Soc. 2008, 130 (50), 16842–16843.
CrossRef - Dietzel, P. D. C.; Besikiotis, V.; Blom, R. J. Mater. Chem. 2009, 19 (39), 7362.
CrossRef - Amrouche, H.; Aguado, S.; Javier, P.; Siperstein, F.; Farrusseng, D.; Bats, N.; Nieto-draghi, C. 2011.
- Bastin, L.; Barcia, P. S.; Hurtado, E. J.; Silva, J. A. C.; Rodrigues, A. E.; Chen, B. J. Phys. Chem. C 2008, 112, 1575–1581.
CrossRef - Carreon, M. A.; Li, S.; Falconer, J. L.; Noble, R. D. J. Am. Chem. Soc. 2008, 130 (16), 5412–5413.
CrossRef - Li, S.; Martinek, J. G.; Falconer, J. L.; Noble, R. D.; Gardner, T. Q. Ind. Eng. Chem. Res. 2005, 44 (9), 3220–3228.
CrossRef - Palomino, M.; Corma, A.; Rey, F.; Valencia, S. Langmuir 2010, 26 (3), 1910–1917.
CrossRef - Xu, X.; Zhao, X.; Sun, L.; Liu, X. J. Nat. Gas Chem. 2008, 17 (4), 391–396.
CrossRef - Wesołowski, R. P.; Terzyk, A. P. Phys. Chem. Chem. Phys. 2011, 13 (38), 17027–17029.
CrossRef - Yuan, Z.; Govind Rajan, A.; Misra, R. P.; Drahushuk, L. W.; Agrawal, K. V.; Strano, M. S.; Blankschtein, D. ACS Nano 2017, 11 (8), 7974–7987.
CrossRef - Pereira, P. R.; Pires, J.; Brotas de Carvalho, M. Langmuir 1998, 14 (16), 4584–4588.
CrossRef - Nicholson, D.; Gubbins, K. E. J. Chem. Phys. 1996, 104 (20), 8126–8134.
CrossRef - Skarmoutsos, I.; Tamiolakis, G.; Froudakis, G. E. J. Phys. Chem. C 2013, 117 (38), 19373–19381.
CrossRef - Babarao, R.; Jiang, J. J. Am. Chem. Soc. 2009, 131 (32), 11417–11425.
CrossRef - Liu, B.; Smit, B. J. Phys. Chem. C 2010, 114 (18), 8515–8522.
CrossRef - Huang, H.; Zhang, W.; Liu, D.; Liu, B.; Chen, G.; Zhong, C. Chem. Eng. Sci. 2011, 66 (23), 6297–6305.
CrossRef - Krishna, R.; van Baten, J. M. Chem. Eng. J. 2007, 133 (1–3), 121–131.
CrossRef - Huda, M.; Ulfa, S. M.; Hakim, L. J. Pure Appl. Chem. Res. 2013, 2 (3), 115–121.
CrossRef - Zhong, H.; Lai, S.; Wang, J.; Qiu, W.; Lüdemann, H.-D.; Chen, L. J. Chem. Eng. Data 2015, 60 (8), 2188–2196.
CrossRef - Mizukami, K.; Takaba, H.; Ito, N.; Kubo, M.; Fahmi, A.; Miyamoto, A. Appl. Surf. Sci. 1997, 119 (3–4), 330–334.
CrossRef - Takaba, H.; Mizukami, K.; Kubo, M.; Stirling, a.; Miyamoto, a. J. Memb. Sci. 1996, 121 (2), 251–259.
CrossRef - Hosseini, S. S.; Li, Y.; Chung, T. S.; Liu, Y. J. Memb. Sci. 2007, 302 (1–2), 207–217.
CrossRef - Hess, B.; Kutzner, C.; Van Der Spoel, D.; Lindahl, E. J. Chem. Theory Comput. 2008, 4 (3), 435–447.
CrossRef - Hakim, L.; Matsumoto, M.; Koga, K.; Tanaka, H. J. Phys. Soc. Japan 2012, 81 (SA018), 1–7.
- Wang, Z.; Achenie, L. E. K.; Khatib, S. J.; Oyama, S. T. Ind. Eng. Chem. Res. 2013, 52 (9), 3258–3265.
CrossRef

This work is licensed under a Creative Commons Attribution 4.0 International License.
![]()
A New Edition of Web of Science
Journal Impact Factor
2022: 0.5
Five Year: 0.8
Journal is Indexed in

Cabells Whitelist
![]()


