Gadolinium-Mesoporous Silica as a Potential Magnetic Resonance Imaging Contrast Agents
Diana Rakhmawaty Eddy1 , Anni Anggraeni1, Retna Putri Fauzia1, Iman Rahayu1, Abdul Mutalib1, M. Lutfi Firdaus2 and Husein Hernandi Bahti1
1Department of Chemistry, Universitas Padjadjaran, Bandung, Indonesia.
2School of Science Education, University of Bengkulu, Bengkulu, Indonesia.
Corresponding Author E-mail: diana.rahmawati@unpad.ac.id
DOI : http://dx.doi.org/10.13005/ojc/340550
Article Received on : 27-07-2018
Article Accepted on : 29-08-2018
Article Published : 13 Oct 2018
Gadolinium-mesoporous silica (Gd-MS) has been used widely as an alternative for synthesizing gadolinium-based Magnetic Resonance Imaging (MRI) contrast agents. In this study, Gd-MS was prepared by using the sol-gel method. Transmission Electron Microscopy (TEM) results gave an average pore size value of 38.184 nm, while the surface value of gadolinium mesoporous silica which is high at 580,666 nm. We describe the synthesis, characterization, and stability test of a novel type of magnetic nanoparticles based on Gd-Si oxide. The particles are nanosized and can enter cell easily. This is a completely novel biomedical application of mesoporous silica materials.
KEYWORDS:Contrast Agents; Gadolinium; Mesoporous; Silica; Sol-Gel
Download this article as:| Copy the following to cite this article: Eddy D.R, Anggraeni A, Fauzia R.P, Rahayu I, Mutalib A, Firdaus M.L, Bahti H.H. Gadolinium-Mesoporous Silica as a Potential Magnetic Resonance Imaging Contrast Agents. Orient J Chem 2018;34(5). |
| Copy the following to cite this URL: Eddy D.R, Anggraeni A, Fauzia R.P, Rahayu I, Mutalib A, Firdaus M.L, Bahti H.H. Gadolinium-Mesoporous Silica as a Potential Magnetic Resonance Imaging Contrast Agents. Orient J Chem 2018;34(5). Available from: http://www.orientjchem.org/?p=50732 |
Introduction
In recent years, magnetic resonance imaging (MRI) has emerged as one of the best techniques in medical diagnosis. MRI has been widely used and promotes the development of pharmaceutical compounds called contrast agents to provide contrast between normal tissue and diseased tissue and to show the status of organ function or blood flow. Non-invasive (selective) MRI detects morphological, functional, and most sensitive changes to soft tissue.1
Commercial contrast agents are dominated by Gd complexes involving multidentate ligands for high stability such as Magnevist [Gd (DTPA) (H₂O)]²–, DTPA is diethylenetri-aminepentaacetic acid and dotarem [Gd (DOTA) (H₂O)], DOTA is 1,4,7,10-tetraazacyclododecane-1,4,7,10-tetraacetic acid, each of which is covalently joined to the surface of the particle. The particles are modified to be characterized as gadolinium content containing proton relaxivity, which is a factor in determining contrast in MRI.2
The recent evolution of molecular imaging has resulted in further demand for more sensitive contrast compounds. Gadolinium in complex form has a strong impact on relaxation proton water because it contains seven unpaired electrons and slow electron spin relaxation from gadolinium (III). Gd (III) is freely toxic to the human body, hence chelating is used to form stable and inert complexes, which can be applied as contrast agents.3
Gadolinium with multidentate ligands such as DTPA have high complex stability but provide some side effects such as headache, nausea, and burning sensation at the injection site [1], whereas the use of silica nanoparticles as enzyme carriers can overcome many limitations, because silica is a powerful, non-toxic, ultrasound-sized particle that can be easily removed from the body through the kidneys. Silica nanoparticles are useful in many applications, such as biosensors, in vivo tracers, biomarkers of dye nanoparticulate markers, and delivery of drugs and genes due to their high biocompatibility and low toxicity.4
Research on nanoscale silica material has been highly developed, especially in mesoporous size because of its superiority in various applications. The mesoporous material is more directed in the formation of a regular mesostructure. Selection of basic materials mesoporous material is important because it acts as a building block. One of the underlying ingredients is silica because it has thermally stable and harmless properties.5
The gadolinium contrast agent is a chemical compound used in MRI scans. When injected into the body, gadolinium contrast agents will increase its relaxivity, which will improve the quality of MRI images. This allows radiologists to report more accurately how the body works and whether there are diseases or abnormalities. The gadolinium contrast agent consists of complex molecules and the arrangement of atoms united by chemical bonds. A chemical bond is made between the gadolinium ion and the carrier molecule (chelate). The carrier agent prevents the toxic nature of gadolinium by maintaining its contrasting properties. Contrast agents are injected intravenously (to the blood vessels) as part of an MRI scan which is then eliminated from the body via the kidneys.6
Therefore, research on a method for incorporating gadolinium into the mesoporous silica framework is based on its potential as an MRI contrast agent because silica has a thermally stable, harmless, and easily available property.5 The interaction between metal and silica tissue makes it less susceptible to leaching, in contrast to the ion-exchange metal species.7
Materials and Methods
Materials
The chemicals used in the study were ammonia 25%, glacial acetic acid, chloride acid, cetyltrimethylammonium bromide (CTAB), gadolinium (III) oxide (Gd₂O₃), demineralized water, sodium acetate buffer solution, sodium-ethylene diamine tetraacetate (Na-EDTA), sodium hydroxide, tetraethyl orthosilicate (TEOS), and xylenol orange.
Methods
Synthesis of Mesoporous Gd-Silica
A total of 1.60 mmol cetyltrimethylammonium bromide (CTAB) was dissolved in 29 g of distilled water and then 3.3 mL of 37% HCl was added to the stirred solution strongly at 32 °C. Then 7.2 mmol of tetraethyl orthosilicate (TEOS) was added to the water-soluble CTAB solution and addition of HCl. After a few minutes 0.24 mmol Gd₂O₃ was added to the solution and stirred for several minutes before pouring a 0.5 M ammonium solution with final pH being achieved to 9. The fine particle sludge was produced and dried at 80 °C, then calcined at 580 ° C for 6 hours to remove the template.8
The determination of gadolinium (III) is free with visible light spectrophotometry
Determination of maximum wavelength of xylenol orange
An aqueous xylenol solution of 12.80 ppm in an acetate buffer solution was measured using a visible light spectrophotometer at a wavelength of 400 nm to 700 nm. The wavelength indicating the maximum absorption was recorded as the maximum absorption wavelength of the xylenol orange.9
The free gadolinium (III) calibration curves
Calibration curve of free Gd (III) was made with four variations of concentration. The standard solution Gd (III) 100.00 ppm of Gd₂O₃ dissolved using nitric acid was diluted into four standard solutions Gd (III) with a concentration of 2.00; 3.00; 4.00; and 5.00 ppm. Each of them is 0.2; 0.3; 0.4; and 0.5 mL Gd (III) 100.00 ppm were then added each of 2, 3, 4 and 5 mL of xylenol orange 40.00 ppm (Gd (III): xylenol orange = 1: 10) [1].
The standard solution which has been prepared is then measured uptake at the maximum wavelength of xylenol orange with visible light spectrophotometer. Furthermore, the calibration curve of Gd (III) is made from the data obtained to obtain the equation of the line [1].
Determination of Gd (III) on Gd-MS synthesis
Gd-MS synthesis was suspended with distilled water, and then the filtrate was taken as much as 0.3 mL and dissolved with a sodium acetate buffer solution of pH 5.8 to 3 mL and then added xylenol orange 40 ppm (1:10).
The solution was added with a sodium acetate buffer solution of pH 5.8 to the mark in the measuring flask. Then the solution was measured uptake at the maximum wavelength of xylenol orange.1
Gd-MS stability test
The stability was tested by immersing Gd-MS in a solution of distilled water pH 6 at 37.5 ° C for 24 hours. After centrifugation, the supernatant was adjusted to the addition of hydrochloric acid to pH 4 and added sodium buffer solution acetate, then titrated with EDTA 0.02 N using xylenol orange as an indicator.8
Results and Discussion
Synthesis of Mesoporous Silica Gadolinium Powder
The synthesis of Gd-MS involves several components, which are gadolinium (III) oxide, tetraethylorthosilicate (TEOS), cetyltrimethylammonium bromide (CTAB), and hydrochloric acid as catalysts. Gadolinium (III) oxide was used as a gadolinium source which is the main subject as a contrast agent. Gadolinium (III) oxide is insoluble in water, so it requires hydrochloric acid as a gadolinium solvent in the system and also acts as a catalyst that can accelerate the synthesis process. TEOS is a component that becomes the source of silica that will act as a carrier of gadolinium in body tissues. Precursors commonly used in the study of the formation of mesoporous materials is TEOS, so the nanomaterial synthesis is used TEOS.7, 10-12
Besides TEOS, CTAB is also one of the components of mesoporous Gd-silica. CTAB acts as a surfactant has hydrophilic groups that can bind water and have hydrophobic groups that cannot bind water, CTAB can unite gadolinium in a water-soluble acidic atmosphere with insoluble silica in water. CTAB is one of the cationic type surfactants that have a positive charge, because according to13 on polymerization process there will be inhibition in the presence of nonionic and anionic surfactants.
When all the constituent components have been mixed, the atmosphere in the solution is acidic, but the synthesis of mesoporous Gd-silica is optimum at pH 9. Therefore, ammonium hydroxide was added to the optimum condition that pH 9 was reached on the system. Due to the acidic atmosphere, gadolinium will bind to chloride from hydrochloric acid, thereby increasing the likelihood of formation of toxic gadolinium (III). The fine particles of formed silicon gadolinium are heated at 80°C with sufficiently strong and constant stirring to remove the ethanol formed from the hydrolysis and condensation processes of SiO₂ formation and the formation of the gadolinium sol. After ethanol was released from the system, centrifugation is done to separate the solvent with the gel formed because it was already separated from the solvent. The centrifugation aims to purify the silica gadolinium gel from solvents and other impurities by rotating by centrifugal force to separate between the supernatant and its sediment.12
After forming gadolinium silica gel, the gel was calcinated at 600°C for 6 hours. Calcination aims to convert a particular compound to its oxidant compound without the addition of reagents, but there will be decomposition. This calcination produces white mesoporous Gd-silica solids. The results of this synthesis resulted in an average yield of 97.93%. In addition to Gd-MS, synthesized mesoporous silica act as a blank for comparison with Gd-MS.
Characterization of Mesoporous Silica Gadolinium Powder by using TEM
Gadolinium mesoporous silica was analyzed using TEM to determine the morphology of compounds and pore size. From the results of TEM analysis, it is found that the morphological form approaches the sphere but is less uniform overall. In addition to the morphology, the TEM obtained a representative pore size of gadolinium mesoporous silica samples of about 30-50 nm by expected results because according to mesoporous a pore that has sizes in the range of 2-50 nm. Fig. 1 illustrates the morphology of the TEM analysis and its particle size in Table 1.
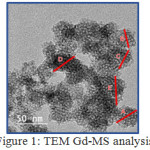 |
Figure 1: TEM Gd-MS analysis |
In Table 1 the pore size of the gadolinium mesoporous silica synthesized is in the range <50 nm. From this pore size, the average pore size is 38.184 nm with a standard deviation of 4.76. In addition to the pore size in Table 1, also obtained the surface value of gadolinium mesoporous silica which is high at 580,666 nm.
Table 1: Gd-MS pore size
|
Pore Size (nm) |
|
|
A |
35.653 |
|
B |
32.430 |
|
C |
40.849 |
|
D |
37.231 |
|
E |
44.756 |
|
x |
38.184 |
Analysis of Gd (III) with Spectrophotometer of Visible Light
Gadolinium in the form of Gd³⁺ ions was analyzed by using visible light spectrophotometers to find out the Gd³⁺ concentration of synthetic gadolinium mesoporous silica. Determination of this concentration using acetic acid buffer as solvent of xylenol orange (XO) which become indicator of existence of Gd (III). Xylenol orange used a pH 5.8 acetate buffer solution because XO was stable at that pH and the metal would bind to XO under pH 5.8. The metal that will bind to this XO is gadolinium which will be determined its concentration because this Gd (III) will be toxic to the human body when it is shaped as its ion. Therefore, determined the concentration of Gd (III) to be known gadolinium mesoporous silica synthesized will result in toxic effects or not.
XO measured its maximum wavelength first by using a visible light spectrophotometer at a wavelength range of 400-700 nm. From the results of determining the maximum wavelength, it was found that XO absorbs the maximum wavelength at 570 nm, so that in the determination of absorbance of the standard solution and gadolinium mesoporous silica sample was determined at a wavelength of 570 nm. At the time of making the standard curve of gadolinium made variation of concentration 2, 3, 4, and 5 ppm generated curve as in Figure 2. From standard curve result, gadolinium mesoporous silica sample concentration measured 0.178 ppm with limit of gadolinium (III) allowed in body only 50 ppb. This value of 0.178 ppm if converted to milligram would be 3.56 x 10–³ mg.
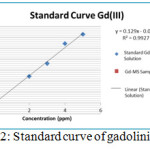 |
Figure 2: Standard curve of gadolinium(III) Click here to View figure |
Measured concentration is due to the presence of gadolinium (III) which is pretty much bound with XO. When gadolinium (III) is not tied to XO, gadolinium dissolves in a colorless solution, while when gadolinium (III) is bound to XO the color of the solution will turn purple. The XO has an orange color when it does not bind to a metal.
Stability Test of Gadolinium Mesoporous Silica
Gadolinium mesoporous silica was tested at a temperature of 37.5°C because it was a temperature that resembled human body temperature. Gadolinium mesoporous silica is expected in the future can be done clinical trials, then for the preliminary tests conducted at the same temperature conditions. Samples of gadolinium mesoporous silica were incubated at 37.5 °C for 24 hours, because the clinical trials of the contrast agent in the body were only 24 hours. After 24 hours, gadolinium mesoporous silica samples will pass through the kidney then into the anus. After incubation at 37.5°C for 24 hours, gadolinium mesoporous silica samples were titrated to determine the concentration of gadolinium released from the silica trap as a gadolinium (III).
After the titration to determine the concentration of gadolinium (III), obtained gadolinium (III) regardless of mesoporous silica with the concentration value of the Gd-MS sample is 4.020 x 10–⁴ N. From that concentration it can be converted to a milligram value of 6.32 x 10–² mg. Therefore, it can be stated that gadolinium is still present which is detached from the synthesized structure of mesoporous silica structure. There was a change of color from red wine to blue titration result of Na-EDTA standardization by MgSO₄.7H₂O by using EBT indicator. The result of this standardization resulted in Na-EDTA concentration of 0.0201 N.
Titration of stability test results using XO indicator obtained the color change from purple to yellow. From the stability test results, gadolinium mesoporous silica has a good stability at 37.5°C for 24 hours, but there are still 6.32 x 10–² mg of gadolinium lose from the silica skeleton so it must be prepared further to be used as an agent contrast to the patient.
Conclusions
Gadolinium and silica in the mesoporous form interact physically and have an average pore size of 38.184 nm. All these results demonstrate that the Gd-MS product is more suitable to be used as an alternative for synthesizing gadolinium-based MRI contrast agents.
Acknowledgments
The authors would like to thank the various parties who have helped in this research, especially to Academic Leadership Grant (ALG) Universitas Padjadjaran Bandung Indonesia.
References
- Fauzia, R. P.; Mutalib, A.; Sodjanaatmadja, R.U.M. S.; Anggraeni, A.; Bahti, H.H. Chimica et Natura Acta, 2016, 4, 7-15.
CrossRef - Ratzinger, G.; Agrawal, P.; Körner, W.; Lonkai, J.; Sanders, H. M. H. F. E.; Terreno, M.; Wirth, G. J.; Strijkers, K.; Nicola, F.; Gabor, F. Biomaterials. 2010, 31, 8716–8723.
CrossRef - Feldmann, V.; Engelmann, J.; Gottschalk, S.; Mayer, H. A.; J. Colloid and Interface Science. 2012, 366, 70–79.
CrossRef - Gupta, N.; Shrivastava, A.; Sharma K. R. Int. J. Nanomedicine. 2012. 7, 5491–5500.
- Nandiyanto, A.B.D.; Kim, S.G.; Iskandar, F.; Okuyama, K. Microporous and Mesoporous Materials. 2009, 120, 447–453.
CrossRef - Bertini, I.; Luchinat, C.; Parigi, G.; Ravera, E. NMR of Paramagnetic Molecules (Second Edition). 2015
- Lin, C.F.; Zhang, X.; Lin, H.; Wang, N.; Li, J. B.; Yang, X. Z. Advanced Materials Research. 2006, 11–12, 543–546.
- Lin, Y.S.; Hung, Y.; Su, J. K.; Lee, R.; Chang, C.; Lin, M. L.; Mou, C. Y. J. Physical Chemistry B. 2004. 108, 15608–15611.
CrossRef - Barge, A.; Cravotto, G.; Gianolio, E.; Fedeli, F. Contrast Med. Mol. Imaging, 2006. 1,184–188.
CrossRef - Eddy, D.R.; Dwiyanti, D.; Rahayu, I.; Hastiawan, I.; Bahti, H.H. AIP Conference Proceedings. 2017. 1848, 030003-1.
- Rahayu, I.; Indraneli, R. P.; Yuliyati, Y.B.; Anggraeni, A.; Soedjanaatmadja, R. U. M. S.; Bahti, H.H. J. Physics: Conference Series 2018. 1013, 012197-1.
CrossRef - Fauzia, R.P.; Mutalib, A.; Soedjanaatmadja, R.U.M.S; Bahti, H.H.; Anggraeni, A.; Gunawan, A.H.; Hidayati, Y. Procedia Chemistry. 2015, 17, 139-146.
CrossRef - Zhang, T.; Blum, F.D. J. Colloid Interface Science. 2017. 504, 111–114.
CrossRef

This work is licensed under a Creative Commons Attribution 4.0 International License.
![]()
A New Edition of Web of Science
Journal Impact Factor
2022: 0.5
Five Year: 0.8
Journal is Indexed in

Cabells Whitelist
![]()


