Effect of Hindon River Water on Seed Germination of Mung Bean (Vigna radiata), Black Gram (Vigna mungo) and Wheat (Triticum aestivum) In-vitro
Deepak Kumar1 , Sangeeta Kumari2 and Vinay Kumar3
1,2Amity Institute of Biotechnology, Amity University Haryana , Gurgaon Haryana, 122016, India.
3Food Service, Intertek India Pvt. Ltd. Gurgaon, Haryana, India.
Corresponding Author E-mail: deepak.biotech@hotmail.com
DOI : http://dx.doi.org/10.13005/ojc/340553
Article Received on : 21-06-2018
Article Accepted on : 29-09-2018
Article Published : 16 Oct 2018
Today quality of river water is an issue of serious concern, nowadays wastewaters from almost all the industries and domestic effluent are discharged untreated in to the rivers and ultimately agriculture fields are being generally irrigated from these polluted water resources loaded with harmful toxic substances which drastically affect the yield. Keeping this in mind, the aim of this study was to analyse Hindon River water for physico-chemical properties (pH, Electrical conductivity (EC), Total alkalinity, Total dissolved solids (TDS), Total suspended solids (TSS), Dissolved Oxygen(DO), Biochemical Oxygen Demand (BOD), Chemical oxygen demand (COD), Chloride, Sulphate and Heavy Metals (Cr, As, Cu, Pb, Cd, Hg , Zn and Ni) to determine its water quality status in term of water quality index (WQI). In this study it is shown that water quality status of Hindon River deteriorated from very poor to unsuitable for drinking and agricultural practices. Additionally its effect on the germination of Vigna radiata, Vigna mungo & Triticum aestivum was investigated by treating with different concentrations 0% 25%, 50%, 75%, and 100%. It was found that concentration of 25% and 50% has stimulatory effects on germination rate, germination rate, seedling length, seedling vigour index and further increase in concentration beyond 50% showed inhibitory effects even on initial growth of these three plants. There was significant (at p≤0.05) differences in seed germination rate, root length, shoot length, fresh & dry weight and vigour index at different concentration of River water.
KEYWORDS:Heavy Metal; Hindon River Water; Seed Germination; Seedling length; Vigour Index; WQI (Water Quality Index); WQS (Water Quality Status)
Download this article as:| Copy the following to cite this article: Kumar D, Kumari S, Kumar V. Effect of Hindon River Water on Seed Germination of Mung Bean (Vigna radiata), Black Gram (Vigna mungo) and Wheat (Triticum aestivum) In-vitro. Orient J Chem 2018;34(5). |
| Copy the following to cite this URL: Kumar D, Kumari S, Kumar V. Effect of Hindon River Water on Seed Germination of Mung Bean (Vigna radiata), Black Gram (Vigna mungo) and Wheat (Triticum aestivum) In-vitro. Orient J Chem 2018;34(5). Available from: http://www.orientjchem.org/?p=50892 |
Introduction
The Hindon River, is a potential source of water for different activities in the highly populated rural area of Western Uttar Pradesh region, is also utilized in different industrial activities taking place along its length. Indeed, the Hindon River and thereof two tributaries (Kali and Krishni River), together have different types of industrial manufacturing units and Municipal effluent drainages which discharge their waste water, often without treatment, directly into the Hindon River, and destroy the river’s natural ability (Bhardwaj, 2014). In suburban areas of many region of the world including India, it is common exercise to use the industrial or municipal waste water (Negi et al 2016; Rai et al 2011), Hindon river water is also being used for irrigation in the agriculture fields, as drinking water for livestock and for bathing. Chemical substance and heavy metals are particularly those which can enter in the food chain through infiltration in soil and then finally in plant (Oregani et al 2014; Soumare et al., 2003 and Bernala et al 2006). As there is water shortage, farmers use these polluted waters for irrigation of their crops, but contained heavy metals which are detrimental could be transmitted to living beings through food chain (Pathrol et al 2015; Murtaza et al., 2010). In contrast, Industrial effluent is also a potential source of irrigation water and nutrient sources to yield the crops, but the presence of the highly loaded nutrient and growth impeding substances may affect seed germination and productivity of a crop (Singh et al 2014), therefore, earlier to use in agriculture field, the industrial effluent should be tested and treated for its toxicity. Various researches have been carried out to study the effect of different industrial waste on different agricultural crop. The effluents from different industries utterly deter the seed germination and seedling growth, but this effect shows a discrepancy from one crop species to another (Kaushik et al., 2005; Singh et al 2012, Mycin 2016).
In Hindon River, dumping of waste water is one of the major issues. The disposal of effluent is mainly manage by different industries such as Sugar Mills, Paper Mills & Distilleries and Municipal waste carry domestic, hospital and small scale industrial wastes. There is a number of such small scale industries which are being operated illegally and do not follow waste disposal procedure. Singh & Yadav (2012) has studied that, sewage enriched Distillery Effluent has detrimental effect on growth of Wheat. Saini & Pant (2014) has investigated those inhibitory effects of Sugar mill waste on maize and wheat. Different workers had made efforts to conclude the impact of different industrial effluent on seed germination of a variety of crops such as Casuarinas (Kumar et at. 2010); Cow pea (Pathrol & Bafna, 2015); Mung bean (Anbuselvam et al 2016; Vaithiyanathan et al. 2016); Black gram (Vaithiyanathan et al, 2014); Rice (Gassama et al, 2015; Saini et al 2014; Sajani et al, 2011; Dhanam, 2009); Wheat (Singh et al 2012; Bharti et al, 2012; Pandey et al, 2007).Thus the present study was done to appraise the effect of different concentrations of Hindon River water on biochemical & physical characteristics of Mung bean, Black gram and Wheat.
Materials and Methods
Collection and Analysis of Hindon River Water
For present study, the effluent samples were collected in a pre-cleaned glass bottles from Hindon River at Atali Village site, Muzaffarnagar district, (U.P) during June-Dec 2016. The collected water samples were stored at 4oC to maintain its original characteristics. These water samples were analyzed for Color, Odour, EC, and pH immediately at the sites of collection and TH, TA, DO, COD, BOD, TDS TSS, Chloride & Sulphate in the lab according to the method prescribed in APHA, 2012. These samples were also analyzed for concentration of Heavy Metals such as Cr, Pb, As, Ni, Cd, Cu, Hg & Zn by Inductively coupled plasma-mass spectrometer (ICP-MS).
Water Quality Index (WQI)
WQI provides single value that expresses the whole quality based on number of parameters. In this study, 8 parameters were selected for calculation of WQI on the basis of standard/specification recommended by WHO and BIS (Bureau of Indian Standard).
Calculation of WQI was done using the equation as stated below (Brown et al. 1970):
WQI=∑QnWn/∑Wn
Qn=100[(Vn−Vi)/(Vs−Vi)],
Where,
Wn = Unit weight of nth parameter, Qn = Quality rating of nth parameter
Vn = Actual quantity of nth parameter
Vi= Ideal value of the parameter, where Vi = 0, except for pH i.e. Vi = 7 and DO i.e. Vi = 14.6 mg/l
Vs = Standard permissible value for the nth parameter.
Wn=k/Vs,
k=[1/∑1/Vs=1,2,…,n]= constant of proportionality
Table 1: The range of WQI, quality status and conceivable usage of water (Brown et al. 1972).
| WQI | Water quality status | Conceivable usage |
| 0–25 | Excellent | Irrigation, industrial and drinking |
| 26–50 | Good | Irrigation, industrial and drinking |
| 51–75 | Poor | Irrigation and industrial |
| 76–100 | Very poor | Irrigation |
| Above 100 | Unsuitable for drinking, irrigation and aquaculture | Appropriate treatment required before taking in use |
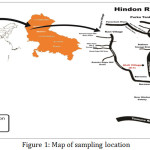 |
Figure 1: Map of sampling location. |
Seed Material
Seeds of Vigna radiata, Triticum aestivum and Vigna mungo were purchased from market and homogeny was maintained on the subject of size, weight and color for better interpretation.
Seed Germination
Seeds of Vigna radiata, Triticum aestivum and Vigna mungo were washed with sodium hypochlorite (NaClO) solution having one percent active chlorine for 10 minutes to sterilize from fungal contamination (Anbuselvam et al, 2016) and then repeatedly washed with sterilized double distilled water. In this study, three replicates from each dilution were prepared by spreading 20 sterilized seeds of identical size on equal distance in each decontaminated petri dish coated with whatman paper. Then each petri dish were flooded with 5ml of different dilution of river water (0 %, 25%, 75 %, 50%, and 100%) and kept at 25±20C. Concentration of river Water were as follows: (a) 20ml tap water i.e 0.00% concentration (Control) (b)15ml tap water +5ml river water i.e. 25% concentration (c) 10ml tap water +10ml sewage water i.e. 50% concentration (d)5ml tap water +15ml sewage water i.e. 75% concentration (e) 0.00 ml tap water+20ml sewage water i.e.100% concentration. Different growth parameters like germination %, seedling length & vigor index were observed after 12 hour of cultivation and followed with subsequent observation after one day interval till 7th day of cultivation.
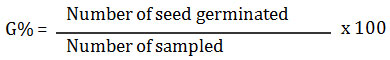
Germination (%)
Seed germination was calculated and expressed in percentage as given by ISTA rules (2016) and recorded every day for one week.
Seedling Length (cm)
Seedling lengths consist of the root and shoot length of the germinated seeds. The shoot length was measured as distance between the base of the primary leaf and the hypocotyl and the Root length was measured as distance between the tip of the primary root and hypocotyl.
Fresh weight and Dry weight (g)
Seedlings from each treatment were collected and measured for their fresh weights with the help of an electrical balance. The same seedlings used for fresh weight were dried in hot air oven at 80˚C for 24 hours and followed with keeping in desiccators for some time. Finally their dry weight is calculated with the help of an electrical balance (Kabir, 2008).
Seedling Vigour Index
Vigour index was computed by using formula i.e. Germination (%) X Seedling Length, given by Abul- Baki and Anderson (1973).
Statistical Analysis
The experimental data done in triplicate with 20 seeds per Petri plate was analyzed for each plant species by analysis of variance (ANOVA). Statistical significance between values was determined using Duncan’s multiple comparison tests at different level (P≤0.05).
Results and Discussion
Farming is the main occupation in Meerut & Muzaffarnagar (Uttar Pradesh) where about 75% of the populations are involved in agricultural activities for their income and cultivate two main crops such as Rabi crops i.e. Maize, rice, Sugarcane, jowar & bajra and Kharif crops i.e. wheat, pulses, mustard & rapeseed in this area. Wheat, Rice and Pulses are the major crops grown and eaten in this area.
In this study, water quality status of Hindon river water was analyzed (Table 2, 3 & 4) and effects of Hindon river water in different concentration (0%, 25%, 50%, 75%, 100%) on seed germination (%), seedling length, seedling weight and Vigor index of three different crops e.g. Vigna radiata, Triticum aestivum & Vigna mungo have been investigated as given in Table 5 & 6.
Analysis of Physico-chemical, Heavy metal and determination of WQI
Hindon River is one of the most polluted rivers in India due to the massive industrial and municipal discharge. Additionally it very much polluted with heavy metals and other harmful organic compounds. The values of different pollution parameters analyzed in collected water sample from Hindon River, along with prescribed tolerance limit as per BIS, CPCB & FAO are given in Table 2 and Fig 2.
Table 2: Concentration of Physico-chemical parameters of Hindon River Water and Tap Water used for Irrigation.
| Sl. No. | Parameters | Unit | Hindon River Water | Tap Water | BIS & CPCB* Specification |
| General Parameters | |||||
| 1 | Colour | – | Light Black | Colorless | – |
| 2 | Odour | – | Unpleasant | No odour | – |
| 3 | pH | – | 7.5 | 6.8 | 6.5-8.5 |
| 4 | EC | μs/cm | 1560 | 81 | 300 |
| 5 | TA | mgL-1 | 485 | 95 | 120 |
| 6 | TDS | mgL-1 | 1235 | 0.0014 | 500 |
| 7 | TSS | mgL-1 | 126 | ND | 500* |
| 8 | TH | mgL-1 | 355 | 5 | 300 |
| 9 | DO | mgL-1 | 0.5 | 6.9 | 5* |
| 10 | BOD | mgL-1 | 154 | 3.1 | 5* |
| 11 | COD) | mgL-1 | 486 | 2.8 | – |
| 12 | Chloride | mgL-1 | 118 | 14.52 | 250 |
| 13 | Sulphate | mgL-1 | 59 | 8 | 150 |
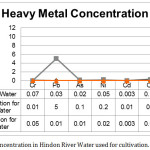 |
Figure 2: Heavy Metal concentration in Hindon River Water used for cultivation. |
Hindon River water used for irrigation was analysed and found light blackish in colour and had an unpleasant odour. A review of data presented in table 2 showed that river water has very low level of DO (0.5) and high level of BOD (154) & COD (486). Such levels of BOD & COD indicate the high level of organic concentration and cause DO depletion which threat to aquatic life. Moreover TDS results showed high attribution to high concentration of Ca and Mg.
The concentration of TSS, TH, TA, Chloride and Sulphate was found beyond the permissible limit as per BIS and it also contained heavy metals above the permissible limit which caused toxic effect on plant growth. This study is also supported by the earlier finding of other researchers (Malik et al, 2013; Sharma et al, 2005; Jain et al, 2003). Apart from this, Hindon river water was analysed in both seasons (pre-monsoon & post-monsoon) for 10 parameters and calculated WQI.
Table 3: Calculation of WQI of Hindon River (Pre-Monsoon).
| Water Quality Index (WQI) | ||||||
| Parameters | K | Vs | Wn | Vn | Qn | QnWn |
| k=[1/∑1/Vs=1,2,…,n] | Wn=k/Vs | Qn=100[(Vn−Vi)/(Vs−Vi)] | ||||
| pH | 1.822 | 8.5 | 0.214 | 7.5 | 33.33 | 7.15 |
| EC | 300 | 0.006 | 1364 | 454.67 | 2.76 | |
| TDS | 500 | 0.004 | 745 | 149 | 0.54 | |
| TSS | 500 | 0.004 | 123 | 24.6 | 0.09 | |
| TA | 120 | 0.015 | 443 | 369.17 | 5.61 | |
| TH | 300 | 0.006 | 374 | 124.67 | 0.76 | |
| DO | 5 | 0.364 | 1.1 | 140.63 | 51.24 | |
| BOD | 5 | 0.364 | 154 | 3080 | 1122.35 | |
| Chloride | 250 | 0.007 | 110 | 44 | 0.32 | |
| Sulphate | 120 | 0.015 | 54 | 45 | 0.68 | |
| WQI=∑QnWn/∑Wn | 1191.50 | |||||
| WSQ | WQI value >100, it comes under “Unsuitable ” category | |||||
Table 4: Calculation of WQI of Hindon River (Post-Monsoon).
| Water Quality Index (WQI) | ||||||
| Parameters | K | Vs | Wn | Vn | Qn | QnWn |
| k=[1/∑1/Vs=1,2,…,n] | Wn=k/Vs | Qn=100[(Vn−Vi)/(Vs−Vi)] | ||||
| pH | 1.822 | 8.5 | 0.214 | 7.1 | 6.67 | 1.43 |
| EC | 300 | 0.006 | 1154 | 384.67 | 2.34 | |
| TDS | 500 | 0.004 | 821 | 164.2 | 0.6 | |
| TSS | 500 | 0.004 | 110 | 22 | 0.08 | |
| Total Alkalinity) | 120 | 0.015 | 138 | 115 | 1.75 | |
| Total Hardness | 300 | 0.006 | 423 | 141 | 0.86 | |
| DO | 5 | 0.364 | 1.2 | 139.58 | 50.86 | |
| BOD | 5 | 0.364 | 173 | 3460 | 1260.82 | |
| Chloride | 250 | 0.007 | 124 | 49.6 | 0.36 | |
| Sulphate | 120 | 0.015 | 62 | 51.67 | 0.78 | |
| WQI=∑QnWn/∑Wn | 1319.88 | |||||
| WSQ | WQI value >100, it comes under “Unsuitable ” category | |||||
The high WQI scores for both season as shown in Table 3 & Table 4 are contributed mostly by different anthropogenic exercises like the direct disposal of sewerage from private and business foundations, absence of appropriate cleanness framework, horticultural run-off, transfer of untreated effluents from little scale enterprises and industrial facilities and persistent dumping of strong wastes by the groups dwelling close by the waterway and so on.
Effect of Hindon River Water on Seed germination of different Plants
Variation in seed germination, seedling length (shoot & root), fresh weight, dry weight and vigour index in different concentration of Hindon river water exhibited effects on plant growth. When river water treated and used for irrigation, maximum germination % was observed in 25% concentration and decreases steadily as the concentration increases. The high level of total dissolved solids absorbed by the seeds upsurge the salinity and conductivity which may cause the hindrance in the germination of seed after irrigation with high concentrated river water (Malaviya et al, 2011).
High concentration of heavy metal in Hindon river water also caused retard of seed germination and growth pattern of plant. (Solanki, 2011) investigated the effect of Zinc and copper on Vigna mungi (L) and (Abraham, 2013) discussed the effect of Cd, Pd and Cu on seed germination of Arachis hypogeae. L.
Table 5: Effect of Hindon River water on three different plant species.
| Attribute | Treatment | Mung Bean (Vigna radiata) | Black Gram (Vigna mungo) | Wheat (Triticum aestivum) |
| Germination (%) | Control (0%) | 86.67 ±2.36a | 85.00±4.08a | 76.67± 2.36ab |
| 25% | 76.67±2.36b | 86.67±2.36a | 68.33± 2.36bc | |
| 50% | 86.67±2.36a | 88.33±2.36a | 80.00± 4.08a | |
| 75% | 68.33±2.36c | 73.33±2.36b | 78.33± 2.36a | |
| 100% | 63.33±2.36c | 61.67±2.36c | 66.67± 4.24c | |
| F-Value | 22.013 | 44.898 | 4.727 | |
| Shoot Length (cm) | Control (0%) | 8.76±0.08 ab | 7.95±0.2ab | 6.38±0.21ab |
| 25% | 9.67±0.79ab | 9.21±0.44ab | 8.60±0.72ab | |
| 50% | 11.35±0.90a | 9.87±0.52a | 9.76 ±0.51a | |
| 75% | 9.72±0.60ab | 8.49±0.44ab | 7.01±0.70ab | |
| 100% | 7.96±0.36b | 6.83±0.65ab | 5.61±0.40ab | |
| F-Value | 2.361 | 1.067 | 1.511 | |
| Root Length (cm) | Control (0%) | 3.91 ±0.21b | 3.15 ±0.15c | 2.83 ±0.27d |
| 25% | 5.84±0.04a | 3.62±0.17b | 6.48 ±0.29a | |
| 50% | 6.83±0.62a | 4.66±0.16a | 5.43 ±0.29b | |
| 75% | 6.07±0.98a | 4.10±0.14b | 4.22±0.26c | |
| 100% | 3.28±0.12b | 2.98±0.36c | 2.65 ±0.13d | |
| F-Value | 13.551 | 20.681 | 83.841 | |
| Fresh Weight (gm) | Control (0%) | 2.40±0.14b | 2.61±0.11b | 1.80±0.04a |
| 25% | 3.12±0.11a | 3.29±0.15a | 2.06±0.06ab | |
| 50% | 3.45±0.14a | 3.57±0.09a | 2.25±0.37ab | |
| 75% | 3.18±0.18a | 3.46±0.17a | 1.93±0.05a | |
| 100% | 2.44±0.18b | 2.63±0.23b | 1.59±0.13b | |
| F-Value | 16.531 | 13.464 | 3.587 | |
| Dry Weight (gm) | Control (0%) | 0.26±0.03b | 0.29±0.03c | 0.32±0.01c |
| 25% | 0.35±0.02a | 0.39±0.02ab | 0.45±0.03b | |
| 50% | 0.36±0.01a | 0.43±0.03a | 0.63±0.04a | |
| 75% | 0.32±0.01a | 0.41±0.02a | 0.37±0.01bc | |
| 100% | 0.21±0.01b | 0.35±0.02bc | 0.39±0.05bc | |
| F-Value | 19.932 | 7.555 | 24.630 |
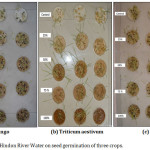 |
Figure 3: Effect of Hindon River Water on seed germination of three crops. |
Table 6: Vigour Index (VI) for three different plant species.
| Treatment | Vigna radiata) | Vigna mungo | Triticum aestivum |
| Control (0%) | 1097.80±50.95 | 942.93±53.55 | 705.28±38.33 |
| 25% | 1187.67±59.69 | 1111.52±42.21 | 1029.03±27.31 |
| 50% | 1575.43±139.97 | 1282.85±46.96 | 1212.42±55.39 |
| 75% | 1083.53±188.39 | 921.98±11.74 | 877.90±69.68 |
| 100% | 711.03±26.63 | 604.17±47.17 | 549.85±56.42 |
The seedling (root and shoot) length and fresh & dry weight were parameters for growth characteristic of Plants. In this study, plant showed irregular growth characteristic on treatment with Hindon river water and studied growth parameters analysed statistically using ANOVA showed significant difference, where in case of root length, it was as: Vigna radiata (F=13.551, p<0.05), Vigna mungo (F = 20.681, p<0.05) and Triticum aestivum (F = 83.841, p<0.05). For shoot length, Vigna radiata (F=2.361, p<0.05), Vigna mungo (F = 1.067, p<0.05) and Triticum aestivum (F =1.511, p<0.05). For fresh weight, it was as: Vigna radiata (F=16.531, p<0.05), Vigna mungo (F = 13.464, p<0.05) and Triticum aestivum (F = 3.587, p<0.05) and for dry weight, it was as: Vigna radiata (F=19.932, p<0.05), Vigna mungo (F = 7.555, p<0.05), and Triticum aestivum (F = 24.630, p<0.05).
In case of Vigna radiata, root and shoot length were found in range of 3.28-6.83 cm and 7.96-11.35 cm respectively (Table 5). Maximum root length (6.83 cm) was investigated at 50% concentration followed by 75% (6.07 cm) > 25% (5.84 cm) >0% (3.91cm)> 100% (3.28 cm). The growth of shoot length at different concentration was as: 50% (11.35 cm) > 75% (9.72 cm) > 25% (9.67 cm) > 0% (8.76 cm) > 100% (7.96 cm). The fresh weight (g) and dry weight (g) lied in the ranges of 2.40-3.45 and 0.21-0.36, respectively. The highest fresh weight was observed at concentration of 50% (3.45g) followed by 75% (3.18 g) > 25% (3.12 g) > 100% (2.44 g)> 0% (2.40 g). Likewise, Dry weight (g) increases from 50% (0.36 g) > 25% (0.35 g) > 75% (0.32 g)>0% (0.26 g)> 100% (0.21 g). It has been observed that the concentration at 100% significantly reduced the growth of plant.
In Vigna mungo, root and shoot length fall under the ranges of 2.98-4.66 and 6.83-9.87cm respectively (Table 5). The root length observed as follow: 50% (4.66 cm) > 75% (4.10 cm) > 25% (3.29 cm)>0% (3.15 cm)> 100% (2.98 cm). Likewise, shoot length showed trend as 50% (9.87 cm) > 25% (9.21cm) > 75% (8.49 cm)>0% (7.95 cm)> 100% (6.83 cm). The fresh and dry weight (g) falls between 2.61-3.57 and 0.29-0.43 respectively. The highest fresh weight (3.57 g) was found at 50% concentration, followed by 3.46 g (at 75% concentration) and 3.29 g (at 25% concentration). The minimum was at 100 % & 0% concentration. Similarly, the maximum dry weight (0.43g) was at 50% concentration, followed by 0.41g (at 75% concentration) and 0.39 g (at 25% concentration). The fresh and dry weight continue rise with increasing concentration, but the concentration of 100% revealed abrupt reduction in length and weight of plants.
Triticum aestivum plants showed impact of different concentration of river water on growth and development of plants (Table 5). However, better growth was noted at low concentration. Fresh and dry weight ranged 1.59-2.25 and 0.32-0.63 respectively. The highest root length (6.48 cm) was witnessed at 25% concentration, followed in the order 5.43 (at 50%) > 4.22 (at 75%) > 2.83 (at 0%) and 2.65 (at 100%). The shoot length was found in the range of 5.61-9.76 cm. The highest shoot length of 9.76 cm was witnessed at 50% concentration, followed by 8.60 (at 25%), 7.01 (at 75%), 6.38 (at 0%) and 5.61 (at 100%). The fresh weight showed as follow 2.25 (at 50%) > 2.06 (at 25%) > 1.93 (at 75%) > 1.80 (at 0%) > 1.59 (at 100%). Likewise, dry weight follows a trend of 0.63 (at 50%) > 0.45 (at 50%) > 0.39 (at 100%) > 0.37 (at 75%) > 0.32 (at 0%). As Hindon water strength get increases, the growth of plant keeps on decreasing.
Conclusion
In this study, The WQI values of water samples collected and analyzed in pre-monsoon and post-monsoon were 1191.50 & 1319.88 respectively, indicated that the Hindon river water quality highly worsened and extended just because of continuous discharge of contaminants mainly heavy metals and nutrient which affected the river fitness and moreover, endangered the fitness of Hindon water for many purposes. Hindon River water used in irrigation of plant would be useful alternate resources to fresh water after proper treatment. As revealed by three crops i.e. Vigna radiata, Triticum aestivum & Vigna mungo when was irrigated with Hindon River water (Fig 3), it can be recommended that Hindon river water is a potential source of different nutrients. Therefore, Hindon water can be used for the purpose to irrigate agricultural field after proper dilutions. This study showed that seed germination of the entire test species were not so sensitive like shoot and root elongation and different species show different levels of tolerance to Hindon river water. The deterioration of water quality due to waste produced by growing population and industrial evolution became a concern and imperilled public health (Anonymous, 1971). The collected water sample holds different ions that can be useful for development & growth of plant but its extreme concentration can cause adverse effects and can hinder the plant growth. Industrial wastes from different manufacturing units contribute to water pollution, which considerably polluted whole food chain. It is also recommended that treatment of effluent is indispensable to minimize the pollution loads which either directly or indirectly enter food chain.
Aknowledgement
The Authors are grateful to Amity University Haryana, India and Intertek India Pvt. Ltd. for its facilities, their support and guidance to carry out the research work.
References
- Abraham K., Sridevi R., Suresh B. and Damodharam T. Asian Journal of Plant Science and Research, 2013, 3, 10-12.
- Abdul AA, Baki, Anderson JD. Crop.sci. 1973, 13, 630-633.
- Anbuselvam Jeeva, Sridhar Arun, Anbuselvam Mohan, Periyasamy Subramanian. , OSR-JESTFT, 2016, 10, 86-89.
CrossRef
- APHA. Standard methods for examination of water and wastewater, 22th edn. American Public Health Association, Water Pollution Control Federation, Washington, DC.
- Brown RM, McClelland NI, Deininger RA, O’Connor MF. Indic Environ Qual , 1972, 1, 173–182.
- Bhardwaj Mamta, International Journal of Engineering Research & Technology, 2014, 3.
- Bharti Pawan Kr and Kumar Pawan. Environment Conservation Journal, 2012, 13, 39-41.
- Bernala AD, Ramosa SMC, Tapiaa NT, Portugalb VO, Hernandezc JTF, Dendoovena L. Applied Soil Ecology, 2006, 33, 269-277.
CrossRef - Dhanam S. Botanical Res. International, 2009, 2 61-63.
- Gassama Umaru Mohamed, Puteh Adam Bin, Abd-Halim Mohamed Ridzwan, Kargbo Bashiru. Journal of Crop Science and Biotechnology March, 2015, 18, 9–19.
CrossRef
- Jain CK, Singhal DC and Sharma MK. Journal of Environmental Hydrology, 2003, 11, 1-12.
- Kumar Yudhistra, A. and Reddy Vikram, M. Applied Ecology And Environmental Research, 2010, 8, 77-85.
CrossRef
- Kabir M., Iqbal M.Z., Shafiq M. and Farooqi Z.R. Pak. J. Bot. 2008, 40, 2419-2426.
- Kaushik, P., Garg, V.K. & Singh, B. Bioresour. Technol., 2005, 96, 1189-1193.
CrossRef - Malaviya Piyush, Sharma Anuradha,J. Journal of Environmental Biology, 2011, 32, 91.
- Murtaza G, Ghafoor A, Qadir M, Owens G, Aziz MA.. Pedosphere, 2010, 20, 23-34.
CrossRef - Mycin T. Ravi. IJOEAR, 2016, 2.
- Malik DR and Subhash Kumar Vinod. International Journal Engineering Science Research, 2013, 3, 714-721.
- Negi Chandranandani, Sirohi Sonam. Int. J. Life. Sci. Scienti. Res., 2016, 2, 258-261.
- Oregani Khosro Estaki, Esfeh Zahra Kazemi, Gholami Ali, Yazdi Hossein Lari. International Journal of Biosciences, 2014, 4, 89-98.
- Pathrol Manisha, Bafna Angoorbala. International Journal of Agriculture Innovations and Research, 2015, 4, 2319-1473.
- Pandey Sandeep K., Tyagi Pallavi and Gupta Anil K. ARPN Journal of Agricultural and Biological Science, 2007, 2.
- Rai S, Chopra AK, Pathak C, Sharma K, Sharma R and Gupta PM. Archives of Applied Science Research, 2011, 3, 318-325.
- Solanki Radha, Arjun, Poonam and Radhankar R. J. Environ. Biol, 2011, 32, 747- 751.
- Soumare M, Tack FMG, Verloo MG. Bioresource Technology, 2003, 86, 15-20.
CrossRef - Singh Shyam Veer, Swami V.K. International Journal of Innovative Research in Science, Engineering and Technology, 2014, 3.
- Singh Bhupinder and Yadav Anoop. World Journal of Environmental Biosciences, 2012, 1, 38-41.
- Saini Saurabh and Pant Shailja. IOSR-JESTFT, 2014, 8, 57-61.
- Sajani Samuel and Muthukkaruppan, S.M. International J. of Pharm. Bio.Archives, 2011, 2, 1469-1472.
- Sharma DC and MK. India. Environmental Monitoring and Assessment, 2005, 105, 193-207.
CrossRef - Vaithiyanathan, T., M. Soundari and P. Sundaramoorthy. International Journal of Research in Botany, 2014, 4, 15-18.
- Vaithiyanathan T. and Sundaramoorthy P. Journal of Applied and Advanced Research, 2016, 1, 20–24.
CrossRef - WHO, International Standards for Drinking Water. 1971, 3rd Edn. Geneva.

This work is licensed under a Creative Commons Attribution 4.0 International License.
![]()
A New Edition of Web of Science
Journal Impact Factor
2022: 0.5
Five Year: 0.8
Journal is Indexed in

Cabells Whitelist
![]()


