Data on the Microstructure and Passivation Behavior for Austenitic Nickel-Chromium (NO7718) and Nickel-Chromium-Aluminum-iron (NO7208) Nickel Alloys in Corrosive Media
Roland Tolulope Loto
Department of Mechanical Engineering, Covenant University, Ota, Ogun State, Nigeria.
Corresponding Author E-mail: tolu.loto@gmail.com
DOI : http://dx.doi.org/10.13005/ojc/340527
Article Received on : 21-07-2018
Article Accepted on : 28-08-2018
Article Published : 11 Oct 2018
Potentiodynamic polarization data for nickel alloys N07718 and N07208 in 2M H2SO4 solution at 0% - 5% NaCl concentrations are presented in tabular form showing the qualitative relationship between the corrosion resistance, passivation behavior and interfacial redox reactions of the alloys with the increase in chloride ion concentration. Tafel plots from the polarization test are presented to show the anodic-cathodic transition curves with respect to variable applied potential and scan rate. Data on open circuit potential measurement for the 1200s showed the active-passive behavior of both alloys and their thermodynamic stability in the acid solution. Optical micro-analytical images of the alloys before corrosion and at 0%, 0.5% and 5% NaCl after corrosion are presented for morphological and comparative analysis.
KEYWORDS:Corrosion; Passivation; Pitting; Steel
Download this article as:| Copy the following to cite this article: Loto R. T. Data on the Microstructure and Passivation Behavior for Austenitic Nickel-Chromium (NO7718) and Nickel-Chromium-Aluminum-iron (NO7208) Nickel Alloys in Corrosive Media. Orient J Chem 2018;34(5). |
| Copy the following to cite this URL: Loto R. T. Data on the Microstructure and Passivation Behavior for Austenitic Nickel-Chromium (NO7718) and Nickel-Chromium-Aluminum-iron (NO7208) Nickel Alloys in Corrosive Media. Orient J Chem 2018;34(5). Available from: http://www.orientjchem.org/?p=50439 |
Introduction
Austenitic nickel-chromium (NO7718) and nickel-chromium-aluminum-iron (NO7208) alloys are wrought, gamma-prime strengthened and high-performance alloys with excellent attributes including good mechanical strength, resistance to thermal creep deformation, excellent surface stability, and very high resistance to corrosion. As a result they have extensive applications in extreme environments such as high temperature structural applications in aero and industrial gas turbine engines, compressor, combustor, industrial piping and vessels, rocket motors and thrust reversers, nuclear fuel element spacers, hot extrusion tooling, high strength bolting, down hole shafting and constructional structures where they are exposed majorly to pitting corrosion. The corrosion resistance of these alloys results from the formation of a thin passive film, whose durability is the product of the metallurgical constituents of the alloys and anionc attack from their environment of application. Breakdown of the passive film in the presence of halides and the resulting localized corrosion is one of the important factors responsible for failure of this alloys.1-5
Experimental Methods
Austenitic nickel-chromium alloy (N07718) and nickel-chromium-aluminum-iron alloy (N07208) have nominal (wt. %) composition shown in Table 1. The super-alloy specimens were machined and sectioned to dimensions (width and length) of 0.4cm by 1cm, after which grinded with silicon carbide papers (80, 320, 600, 800 and 1000 grit). They were subsequently cleansed with distilled water and acetone, and kept in a desiccator for potentiodynamic polarization test and open circuit potential measurement according to ASTM G1 – 03.6 Recrystallized NaCl obtained from Titan Biotech, India was prepared in volumetric concentrations of 0%, 0.5%, 1%, 1.5%, 2%, 2.5%, 3%, 3.5%, 4%, 4.5% and 5% in 200 mL of 2M H2SO4 solution, prepared from analar grade of H2SO4 acid (98%) with deionized water.
Table 1: Nominal Composition (wt. %) of N07718 and N07208.
| Element Symbol | Cu | Si | Ni | Cr | Mn | P | S | C | Co | Al | Ti | Mo | Fe |
| % Composition (N07718) | 0.3 | 0.35 | 51 | 18 | 0.35 | 0.04 | 0.05 | 0.08 | 0.8 | 0.3 | 1.1 | 3 | 24.72 |
| % Composition (N07208) | – | 0.15 | 56 | 20 | 0.3 | – | – | 0.06 | 10 | 1.5 | 2.1 | 8.5 | 1.5 |
Polarization tests were performed at 30°C with Digi-Ivy 2311 electrochemical workstation attached to a triple electrode system (working, counter and reference electrodes) within a glass cell containing 200 mL of the test electrolyte with. UNS N07718 and N07208 sample electrodes mounted in acrylic resin with exposed surface areas of 0.4cm2 were prepared according to ASTM G59-97(2014).7 Tafel plots were obtained at a scan rate of 0.0015V/s between potentials of −0.75V and +1.5V according to ASTM G102-89(2015).8 Corrosion rate (ɤ) was calculated from the formula;
![]()
jcr is the current density in A/cm2, D is the density in g/cm3; Eqv is the sample equivalent weight in grams. 0.00327 is a constant for corrosion rate calculation in mm/y.9 Open circuit potential measurement (OCP) were obtained at a step potential of 0.05V/s using acrylic mounted UNS N07718 and N07208 sample electrodes (exposed surface of 0.4 cm2) and Ag/AgCl reference electrodes attached to Digi-Ivy 2311 potentiostat according to ASTM G69 – 12(2012).10 The working electrodes samples were fully immersed in 200 ml of the test media at NaCl concentrations of 0%, 0.5% and 5% for 1200s. Optical images of UNS N07718 and N07208 samples before, and after corrosion at 0%, 0.5% and 5% NaCl were obtained and analysed after polarization test with Omax trinocular through the aid of ToupCam analytical software.
Results and Discussion
Potentiodynamic polarization studies
The anodic-cathodic polarization plots for NO7718 and NO7208 alloys in 2M H2SO4/ 0% – 5% NaCl concentration are shown in Figs. 1(a) and (b). The corrosion rate results for the alloys are shown in Tables 2 and 3. NO7718 showed relatively higher corrosion rate results compared to NO7208 with respect to NaCl concentration. Observation of the Tables (Table 2 and 3) shows the corrosion rate of NO7718 decreased with increase in chloride concentration till 5% NaCl concentration, while the corrosion rate of NO7208 decreased from 0% to 0.5% NaCl concentration. However, beyond 0.5% NaCl concentration the corrosion rates of NO7208 did not decrease relative to increase in NaCl concentration. What occurred is a generally constant variation in corrosion rate value with limited changes which signifies relative stability of the passive oxide film on NO7208. Its polarization resistance are also lower than NO7208 confirming the higher corrosion resistance of NO7208. NO7718 shows weaker resistance to metastable pitting as shown in Fig. 1(a). Its metastable region increased proportionately (following anodic polarization) with increase in NaCl concentration, causing delayed passivation of the alloy in the acid chloride media. The polarization behavior of NO7208 contrasts NO7718. NO7208 showed relatively strong resistance to metastable pitting as shown in the short metastable pitting region following anodic polarization. Secondly while NO7718 pitted at generally the same pitting potential due to breakdown of its passive film, NO7208 displayed strong resistance to pitting at the transpassive region following breakdown at the pitting potential. There appears to be repassivation of the weakened passive film probably due to its higher nickel and molybdenum. Observation of the Tafel slope of both alloys shows generally similar hydrogen evolution and oxygen reduction reactions from their cathodic Tafel slope values; however the anodic Tafel slopes show the rate of anodic dissolution is higher for NO7718 than NO7208.
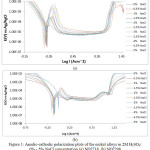 |
Figure 1: Anodic-cathodic polarization plots of the nickel alloys in 2M H2SO4/ 0% – 5% NaCl concentration (a) NO7718, (b) NO7208. |
Table 2: Potentiodynamic polarization data for NO7718 in 2M H2SO4/0% – 5% NaCl concentration.
| Sample | NaCl Conc. (%) | Corrosion Rate (mm/y) | Corrosion Current (A) | Corrosion Current Density (A/cm2) | Corrosion Potential (V) | Polarization Resistance, Rp | Cathodic Tafel Slope (Bc) | Anodic Tafel Slope (Ba) |
| A | 0 | 2.44 | 9.34E-05 | 2.33E-04 | -0.08 | 275.2 | -9.66 | -3.867 |
| B | 0.5 | 2.07 | 7.91E-05 | 1.98E-04 | -0.108 | 324.8 | -9.718 | -1.684 |
| C | 1 | 1.63 | 6.23E-05 | 1.56E-04 | -0.108 | 412.4 | -9.684 | 2.226 |
| D | 1.5 | 1.48 | 5.65E-05 | 1.41E-04 | -0.081 | 455 | -11.77 | 5.819 |
| E | 2 | 1.03 | 3.93E-05 | 9.82E-05 | -0.092 | 654.2 | -9.372 | 6.374 |
| F | 2.5 | 0.99 | 3.78E-05 | 9.45E-05 | -0.09 | 884.3 | -11.57 | 7.822 |
| G | 3 | 0.94 | 3.59E-05 | 8.98E-05 | -0.116 | 888.6 | -9.633 | 17.67 |
| H | 3.5 | 0.89 | 3.41E-05 | 8.52E-05 | -0.134 | 754.3 | -7.673 | 21.15 |
| I | 4 | 0.89 | 3.42E-05 | 8.54E-05 | -0.125 | 752.1 | -10.18 | 17.19 |
| J | 4.5 | 0.87 | 3.34E-05 | 8.35E-05 | -0.165 | 760.8 | -10.63 | 18.447 |
| K | 5 | 0.87 | 3.33E-05 | 8.33E-05 | -0.105 | 771.1 | -10.02 | 19.9 |
Table 3: Potentiodynamic polarization data for NO7208 in 2M H2SO4/ 0% – 5% NaCl concentration.
| Sample | NaCl Conc. (%) | Corrosion Rate (mm/y) | Corrosion Current (A) | Corrosion Current Density (A/cm2) | Corrosion Potential (V) | Polarization Resistance, Rp | Cathodic Tafel Slope (Bc) | Anodic Tafel Slope (Ba) |
| A | 0 | 1.02 | 3.97E-05 | 9.93E-05 | -0.009 | 646.9 | -8.112 | -4.392 |
| B | 0.5 | 0.47 | 1.84E-05 | 4.59E-05 | -0.064 | 1400 | -8.507 | -2.026 |
| C | 1 | 0.35 | 1.36E-05 | 3.41E-05 | -0.094 | 1833 | -10.08 | 0.578 |
| D | 1.5 | 0.6 | 2.33E-05 | 5.81E-05 | -0.111 | 1105 | -8.126 | 1.467 |
| E | 2 | 0.52 | 2.01E-05 | 5.02E-05 | -0.104 | 1280 | -10.02 | 0.063 |
| F | 2.5 | 0.38 | 1.47E-05 | 3.68E-05 | -0.123 | 1744 | -10.07 | 4.147 |
| G | 3 | 0.3 | 1.18E-05 | 2.95E-05 | -0.096 | 2179 | -10.03 | 8.595 |
| H | 3.5 | 0.25 | 9.60E-06 | 2.40E-05 | -0.136 | 2676 | -10.03 | 6.002 |
| I | 4 | 0.43 | 1.69E-05 | 4.22E-05 | -0.108 | 1522 | -8.503 | 2.509 |
| J | 4.5 | 0.4 | 1.54E-05 | 3.85E-05 | -0.16 | 1667 | -9.716 | 3.312 |
| K | 5 | 0.29 | 1.14E-05 | 2.86E-05 | -0.083 | 2250 | -10.12 | 7.816 |
Open Circuit Potential Measurement
The OCP plots of corrosion potential versus exposure time for NO7718 and NO7208 nickel alloys [Fig. 2(a) and (b)] at 0% NaCl without applied potential started at -0.058V and -0.001V (0s). The plot for NO7718 increase steeply in the anodic direction from cathodic potentials till 1200s, whereas the plot for NO7208 increased steeply within the passive state for 100s to 0.080V after which there was a mild increase till about 800s at 0.043V. Beyond this point the anodic shift in corrosion potential for NO7208 increased steeply till 1200s. At 0.5% NaCl, NO7718 showed relative stability till the end of the exposure hours whereas NO7208 progressively increased to 0.030V at 1200s. Variation in NO7718 OCP potentials at 5% NaCl concentration shows a significant cathodic shift starting at -0.154V at 0s compared to -0.058V and -0.108V at 0% and 0.5% NaCl concentration. No cathodic shift was observed for NO7208 at 5% NaCl due to its similar potential variation with at 0.5% NaCl till 400s after which relatively stable potential variation was observed. The OCP results shows NO7718 is more electronegative, thus thermodynamically stable at more active potentials than NO7208 whose OCP values are in the passive state due its thermodynamic stability at lower tendencies to corrode.
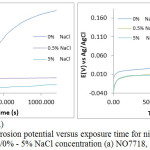 |
Figure 2: Plot of corrosion potential versus exposure time for nickel alloy specimens 2 M H2SO4/0% – 5% NaCl concentration (a) NO7718, (b) NO7208. |
Micro-Analytical Studies
Micro-analytical images of NO7718 and NO7208 surface morphology before corrosion, and after corrosion at 0%, 0.5% and 5% NaCl concentration are shown from Fig. 3(a) to 6(b). Changes in NO7208 morphology tends to be mild and in effect negligible with respect to its corrosion resistance and morphological deterioration which is in agreement with the data from potentiodynamic polarization. The optical images of NO7718 after corrosion showed a slightly etched morphology with visible superficial dark surface film at major portions of the alloy.
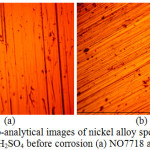 |
Figure 3: Micro-analytical images of nickel alloy specimens at mag.x40 from 2 M H2SO4 before corrosion (a) NO7718 and (b) NO7208. |
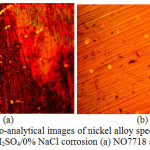 |
Figure 4: Micro-analytical images of nickel alloy specimens at mag. x40 from 2 M H2SO4/0% NaCl corrosion (a) NO7718 and (b) NO7208. |
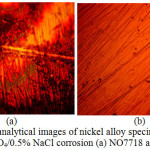 |
Figure 5: Micro-analytical images of nickel alloy specimens at mag. x40 from 2 M H2SO4/0.5% NaCl corrosion (a) NO7718 and (d) NO7208. |
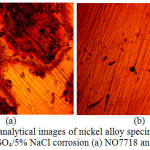 |
Figure 6: Micro-analytical images of nickel alloy specimens at mag. x40 from 2 M H2SO4/5% NaCl corrosion (a) NO7718 and (d) NO7208. |
Conclusion
NO7208 proves to be more resistant to corrosion compared to NO7718 with respect to increase in NaCl concentration. NO7718 shows relatively weak resistance to metastable pitting causing delayed passivation of the alloy in the acid chloride media while NO7208 displayed strong resistance to pitting at the transpassive region due to its higher nickel and molybdenum. This observation is confirmed from the higher anodic Tafel slopes of NO7718. The OCP results shows NO7718 is more electronegative, thus thermodynamically stable at more active potentials than NO7208 whose OCP values are in the passive state due its thermodynamic stability at lower tendencies to corrode. Optical microscopic studies shows both alloys are highly resistant to pit formation however the presence of superficial brown oxide occurred on NO7718.
Acknowledgements
The author acknowledges Covenant University Ota, Ogun State, Nigeria for the sponsorship and provision of research facilities for this project.
References
- McCafferty, E. Corros. Sci. 2003, 45, 1421-1438.
CrossRef - Abdel Rehim, S.S.; Hassan, H.H.; Amin, M.A. Corros. Sci. 2004, 46, 1921-1938.
CrossRef - Loto, R.T.; Loto, C.A. J Fail. Anal. and Preven. 2017, 17(4), 672–679.
CrossRef - Loto, R.T.; Loto, C.A. J. Mater. Res. Technol. 2017. doi.org/10.1016/j.jmrt.2017.07.004.
- Loto, R.T. J. Mater. Environ. Sci. 2013, 4(4), 448-459.
- ASTM G1 – 03. Standard Practice for Preparing, Cleaning, and Evaluating Corrosion Test Specimens, 2011. http://www.astm.org/Standards/G1.
- ASTM G59 – 97 (2014). Standard Test Method for Conducting Potentiodynamic Polarization Resistance Measurements. http://www.astm.org/Standards/G31.
- ASTM G102 – 89 (2015)e1. Standard Practice for Calculation of Corrosion Rates and Related Information from Electrochemical Measurements. http://www.astm.org/ Standards/G31.
- Choi, Y.; Nesic, S.; Ling, S. Electrochim. Acta. 2011, 56(4), 1752-1760.
CrossRef - ASTM G69 e 12, 2012. Standard Test Method for Measurement of Corrosion Potentials of Aluminum Alloys. https://www.astm.org/Standards/G69.htm.

This work is licensed under a Creative Commons Attribution 4.0 International License.
![]()
A New Edition of Web of Science
Journal Impact Factor
2022: 0.5
Five Year: 0.8
Journal is Indexed in

Cabells Whitelist
![]()


