Comparison of Iron Reduction Methods on the Determination of Antioxidants Content in Vegetables Sample
Yefrida , Hamzar Suyani, Hermansyah Aziz and Mai Efdi
Chemistry Department, Faculty of Mathematics and Natural Sciences, Andalas University, Kampus Limau Manis, Padang 25163, Indonasia.
Corresponding Author E-mail: yefanwar@gmail.com
DOI : http://dx.doi.org/10.13005/ojc/340525
Article Received on : 27-06-2018
Article Accepted on : 08-08-2018
Article Published : 01 Oct 2018
Determination of antioxidant content in 14 vegetables has been done using Modified Phenanthroline (MPM), Phenanthroline (PM) and Ferric Reducing Antioxidant Power (FRAP) methods. The SDR values obtained for the MPM and PM methods were (2.65 ± 1.26) % and (3.51 ± 0.88) %, while the recovery values were (100.86 ± 4.45)% and (99.93 ± 3.50) %, respectively. The antioxidant content of vegetables obtained by MPM, PM and FRAP methods were (30.4 ± 1.46 - 515.9 ± 3.32), (25.9 ± 1.13 - 327.3 ± 2.57) and (21.4 ± 0.51 - 371.7 ± 1.10) μmol Fe / g DW, respectively. The antioxidant content obtained with the three methods showed no significant different. The correlation values between MPM - PM, MPM - FRAP, and PM - FRAP methods are 0.9712, 0.9896 and 0.9611, respectively. These values indicate a very strong correlation among the three methods.
KEYWORDS:Antioxidant Content; FRAP Method; Iron Reduction Method; Modified Phenanthroline Method; Phenanthroline Method; Vegetables
Download this article as:| Copy the following to cite this article: Yefrida Y, Suyani H, Aziz H, Efdi M. Comparison of Iron Reduction Methods on the Determination of Antioxidants Content in Vegetables Sample. Orient J Chem 2018;34(5). |
| Copy the following to cite this URL: Yefrida Y, Suyani H, Aziz H, Efdi M. Comparison of Iron Reduction Methods on the Determination of Antioxidants Content in Vegetables Sample. Orient J Chem 2018;34(5). Available from: http://www.orientjchem.org/?p=50045 |
Introduction
Lately, consumption of health supplements undergo a sharp increase as part of human awareness to improve their health. In general, these supplements are plant products believed to reduce the risk of a number of chronic diseases such as atherosclerosis and cancer. The ability to reduce the risk of chronic diseases is tied to the presence of compounds that have antioxidant activity in these plants.1
Fruits, vegetables, and other plants contain antioxidants. Phenolic compounds are commonly found in vegetable-based food and are important components of the human diet. Phenolic compounds act as antioxidants by inhibiting free radicals and blocking their chain reactions. Antioxidant compounds contained in vegetables are generally non-enzymatic antioxidants such as polyphenols, carotenoids, vitamins, and minerals.2-6
There are many research that have been done to determine the antioxidant content in vegetables which is widely consumed in the countries such as Brazil, India, Singapore, Malaysia etc.2,4,7,8
Modified Phenanthroline Method (MPM) uses water as a solvent to replace methanol. Using water as a solvent is environmentally and economically friendly. Based on the method validation, it can be stated that this method is valid for determination of antioxidant content in fruits samples.14
In this study, MPM was used to determine antioxidant content in 14 vegetables. The antioxidant content obtained by this method is compared with those of PM and FRAP methods. Total Phenolic Content (TPC) was also determined and the correlation between two methods among all methods.
Materials and Methods
Sample
The samples used in this research were kale (Ipomoea aquatica), lettuce (Lactuca sativa, fern (Diplazium esculentum), lobak Singgalang (Raphanus sativus L), radish (Raphanus raphanistrum subsp. Sativus), cassava leaf (Manihot utilissima), spinach (Amaranthus), mustard (Brassica rapa subsp.pekinensis), broccoli (Brassica oleracea var.italica), bean sprouts (Flammulina velutipes), long beans (Vigna unguiculata ssp.sesguipedalis), melinjo leaf (Gnetum gnemon Linn.), katuk leaf (Sauropus androgynus) and mangkokan leaf (Polyscias scutellaria). All samples were bought at a traditional market in Padang, West Sumatera, Indonesia.
Sample preparation
The vegetable sample was cleaned from impurities and cut into small pieces. The sample was weighed as much as ± 2.0000 g, put into a beaker and then 25 mL of methanol was added. The extraction was carried out for 1 hour then the extract was filtered. Antioxidant content and total phenolic content of each vegetable were determined from these filtrates.
Chemicals and reagents
1,10 phenanthroline (99%), FeCl3.6H2O, FeSO4.7H2O, TPTZ (2,4,6-tri-(2-pyridyl-s-triazine))., HCH3COO, NaCH3COO, HCl, Folin–Ciocalteau’s reagent, Na2CO3, gallic acid, methanol, were obtained from Sigma–Aldrich and Merck. All chemicals and solvents were of analytical grade.
Instrument
PD 303-S UV-VIS Spectrophotometer was used in all measurement.
Calibration curves
Calibration curves were prepared using standard solutions of FeSO4.7H2O (0.05 – 0.5 mM) for Modified Phenanthroline, Phenanthroline and FRAP Methods, while gallic acid (50 -300) mg/L was used for TPC.
Modified Phenanthroline Method (MPM)
Determination of antioxidant content with this method was done according to the optimum conditions obtained in the previous study.14 Briefly, into 10 mL test tube 1 ml of 0.1% phenanthroline, 1 ml of 0.1% FeCl3, 1 mL sample solution and 2 mL distilled water were added and mixed. After standing at room temperature for 20 minutes, the absorbance was read at 510 nm using UV-Vis spectrophotometer.
Phenanthroline Method (PM)
The procedure was done according to the method of Szydłowska-Czerniak et al (2008).13 Briefly, 0.5 mL of 0.2% phenanthroline was transferred into 10 mL measuring flask. Then, 1 ml of 0.2% FeCl3 and 0.6 mL sample were added. Distilled water is added until the total volume is 10 mL. The mixture then was shaken. After standing at room temperature for 20 minutes, the absorbance was read at 510 nm using UV-Vis spectrophotometer
FRAP Method
The procedure as described by Szydłowska-Czerniak et al (2008).13 Briefly, into 10 mL measuring flask were added 2 mL of FRAP reagent (5 mL FeCl3 20 mM, 5 mL TPTZ dissolved in 50 mL in acetate buffer) and 0.3 mL standard/sample. Distilled water is added until the total volume is 10 mL The mixture then was shaken. After standing at room temperature for 10 minutes, the absorbance was read at 593 nm using UV-Vis spectrophotometer.
For MPM, PM and FRAP method, data were expressed as micromol Fe per gram dry weight (mmol Fe/g DW).
Total Phenolic Content (TPC)
TPC was determined using the Folin–Ciocalteau method according to previous procedure.14 Briefly, into 10 mL test tube were added 4.0 mL of 2 % Na2CO3, 0.2 mL Folin reagent (1 : 1 Folin : methanol) and 0.4 mL sample/standard. The mixture then was shaken. After standing at room temperature for 30 minutes, the absorbance was read at 750 nm using UV-Vis spectrophotometer. Data were expressed as milligram gallic acid equivalents per gram dry weight (mg GAE/g DW).
Statistical Analysis
The descriptive statistical analysis was performed using Minitab. The data were expressed as mean ± standard deviation from triplicate measurements.
Result and Discussion
Relative Standard Deviation (RSD) and Recovery
RSD is a value that states the level of precision of an analytical method. The RSD is expressed in percent units. In this study, the determination of RSD value is done by doing 8 replicates. The results obtained can be seen in Table 1. The RSD values obtained are (2.65 ± 1.26) % and (3.51 ± 0.88) % for the MPM and PM methods, respectively. The RSD values obtained in MPM and PM methods are below the threshold value set by AOAC at 6%.15 The p-value of 0.021 is smaller than the specified significance level or ɑ 0.05 then reject H0, means that there are significant differences of RSD values between the two methods.
The recovery value states the accuracy of a method. The recovery value is expressed in percent units. In this research, the determination of recovery value is done by measuring the antioxidant content in samples and samples plus standard. The results obtained can be seen in Table 1. The recovery values obtained are (99.93 ± 3.50) % and (100.86 ± 4.45) % for MPM and PM methods, respectively. The recovery values obtained in the MPM and PM methods are below the threshold value set by AOAC that is (90 – 108)%.15 The p-value of 0.289 is greater than the specified significance level or ɑ of 0.10 then H0 means that there is no significant difference in recovery value between the two methods.
Based on RSD and recovery values obtained in this study, it can be stated that MPM and PM method is valid to determine the antioxidant content in vegetable samples.
Table 1: RSD and recovery for MPM and PM.
| No | Sample | MPM | PM | ||
| SDR (%) | Recovery (%) | SDR (%) | Recovery (%) | ||
| 1 | Kale (Ipomoea aquatica) | 2.33 | 97 | 2.73 | 107 |
| 2 | Lettuce (Lactuca sativa) | 4.27 | 107 | 1.62 | 105 |
| 3 | Fern (Diplazium esculentum) | 1.95 | 102 | 3.89 | 101 |
| 4 | Singgalang cabbage (Brassica sp) | 3.04 | 93 | 4.80 | 102 |
| 5 | Cabbage (Brassica oleraceae) | 3.08 | 100 | 3.74 | 103 |
| 6 | Cassava Leaf (Manihot utilissima) | 2.51 | 100 | 3.80 | 93 |
| 7 | Spinach (Amaranthus sp) | 2.06 | 105 | 4.24 | 106 |
| 8 | Mustard (Brassica juncea) | 0.00 | 100 | 3.49 | 99 |
| 9 | Broccoli (Brassica oleracea var. Italica) | 3.83 | 102 | 3.98 | 98 |
| 10 | Bean-sprouts (Phaseolus aureus) | 4.52 | 99 | 4.57 | 98 |
| 11 | Long Beans (Phaseolus vulgaris) | 2.74 | 92 | 4.11 | 104 |
| 12 | Melinjo Leaf (Gnetum gnemon Linn.) | 1.32 | 96 | 2.26 | 99 |
| 13 | Katuk Leaf (Sauropus androgynus) | 1.27 | 99 | 3.52 | 107 |
| 14 | Mangkokan Leaf (Nothopanax scutellarium) | 3.26 | 100 | 2.90 | 94 |
Antioxidant Content in Vegetables
The vegetables used in this study are commonvegetablesconsumed by people in West Sumatra, Indonesia. These vegetables are self-cultivated and some are imported from nearby cities, but none are imported. Many people of West Sumatra consume vegetables every day because of the awareness of the importance of vegetables for health.
Cao et al (1996) state that vegetables such as kale, beets, pepper, broccoli, spinach, shallots, potato, carrots, and cabbage, have high antioxidant activities.16 Some of this vegetables are also widely consumed in West Sumatra, Indonesia, and Malaysia8 and their total antioxidant and phenolic contentwas determined in this study.
Antioxidant content in 14 vegetables was determined by using MPM, PM and FRAP methods. Comparison of antioxidant content in 14 vegetables tested can be seen in Table 2. Three of 14 vegetables tested that have the highest antioxidant content based on MPM method are cassava leaf (Manihot utilissima), katuk leaf (Sauropus androgynous) and lettuce (Lactuca sativa) with value (515.9 ± 3.32; 351.1 ± 1.67, 306.3 ± 1.38) µmol Fe/g DW, respectively. The same orderis true for the Phenanthroline and FRAP methods with values (327.3 ± 257; 257.7 ± 2.70; 217.3 ± 0.71) and (371.7 ± 1.10; 225.7 ± 2.46; 217.3 ± 1,08) µmol Fe/g DW, respectively. While 3 vegetables that have the lowest antioxidant content are beansprout < long beans < cabbage, in all three methods.There was no significant difference in mean on all three methods (p < 0.05).
Table 2: Antioxidant Content (AC) in vegetables by usingMPM, PM and FRAP method.
| No | Sample | Antioxidant Content (mean ± SD)
(µmol Fe/g DW) |
||
| MPM | PM | FRAP | ||
| 1. | Kale (Ipomoea aquatica) | 238.3 ± 2.04 | 228.8 ± 0.99 | 187.9 ± 1.70 |
| 2. | Lettuce (Lactuca sativa) | 306.3 ± 1.38 | 217.3 ± 0.71 | 217.3 ± 1.08 |
| 3. | Fern (Diplazium esculentum) | 73.7 ± 110 | 60.2 ± 2.79 | 74.2 ± 1.16 |
| 4. | Singgalang cabbage (Brassica sp) | 209.7 ± 0.15 | 122.6 ± 1.70 | 176.9 ± 0.82 |
| 5. | Cabbage (Brassica oleraceae) | 65.1 ± 0.40 | 44.8 ± 1.79 | 63.8 ± 1.17 |
| 6. | Cassava Leaf (Manihot utilissima) | 515.9 ± 3.32 | 327.3 ± 257 | 371.7 ± 1.10 |
| 7. | Spinach (Amaranthus sp) | 167.7 ± 2.05 | 150.7 ± 0.14 | 133.5 ± 0.75 |
| 8. | Mustard (Brassica juncea) | 144.5 ± 3.09 | 122.7 ± 6.89 | 108.1 ± 7.02 |
| 9. | Broccoli (Brassica oleracea var. Italica) | 101.5 ± 1.96 | 90.3 ± 1,85 | 81.2 ± 4.67 |
| 10. | Bean-sprouts (Phaseolus aureus) | 30.4 ± 1.46 | 25.9 ± 1.13 | 21.4 ± 0.51 |
| 11. | Long Beans (Phaseolus vulgaris) | 31.8 ± 1.71 | 19.7 ± 0.42 | 18.2 ± 1.36 |
| 12. | Melinjo Leaf (Gnetum gnemon Linn.) | 153.2 ± 1,32 | 115.3 ± 1.78 | 96.9 ± 1.34 |
| 13. | Katuk Leaf (Sauropus androgynus) | 351.1 ± 1.67 | 257.7 ± 2.70 | 225.7 ± 2.46 |
| 14. | Mangkokan Leaf (Nothopanax scutellarium) | 88.2 ± 1.16 | 71.7 ±1.41 | 59.0 ± 0.23 |
Cassava leaves are the most widely consumed vegetables in West Sumatra. These plants can grow easily without the need for fertilizers or pesticides. This plant is widely grown in the yard of the resident’s home. It can be used as vegetable leaves and its tubers used to make various types of food.
Katuk leaf widely consumed by mothers who have just given birth. The chemical content contained in katuk leaf is believed to improve the quality and quantity of breast milk. This is very important for baby growth and development.
Both types of vegetables with high antioxidant content are rarely found in other countries, so there is not much information found on the chemical content of these two types of vegetables.
Determination of antioxidant content in vegetables conducted by Tiveron et al (2012) found that the order of antioxidant content from highest to lowest is lettuce > spinach> broccoli > radish.7 Cao et al (1996) found kale > spinach > cabbage. The same order was found in this study.16 But Ismail et al (2004) got the different order spinach> cabbage > kale.8 The difference on the antioxidant content in vegetables may have been due to the difference in species cultivation, solvent, extraction methods and environmental factors.8,17
Correlation between the methods
The three methods of determining the antioxidant content used in this study are based on the mechanism of the iron reduction reaction. The Fe Ion (III) used in this method acts as an oxidizing agent which oxidizes the antioxidant to form Fe (II) ions. These ions form complexes with the complexing reagents used. In MPM and PM method, the complexing reagent used is ortho phenanthroline whereas, in FRAP method, the complexing reagent used is TPTZ. The absorbance of formed complexes was measured.
Determination of correlation value (r) aims to see the relationship between the 2 methods. The correlation between MPM with PM, FRAP, and DPPH can be seen in Fig 1 and 2. The correlation between MPM and PM is 0.9712, while MPM and FRAP are 0.9896. The correlation value obtained is greater than that obtained on the determination of antioxidant content in fruits that is equal to 0.9519 and 0.9747, respectively.14 Although the value is slightly different both indicate that the MPM and PM or FRAP have very strong correlation.18 Similar results are obtained by Szydłowska-Czerniak et.al that studied the antioxidant content in vegetable oils by using PM and FRAP method. The correlation value was obtained in acetone and methanol solvents is 0.9989 and 0.9986, respectively.13The full correlation values between the methods can be seen in Table 4 below.
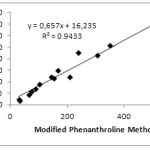 |
Figure 1: Correlation between MPM and PM. |
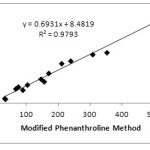 |
Figure 2: Correlation between MPM and FRAP. |
Total Phenolic Content (TPC)
TPC of 14 vegetables tested shows in Table 3. Its values vary from 12.21 to 182.56 mg GAE/g DW. Among all vegetables, 3 of 14 vegetables had the highest total phenolic content. They are cassava leaf (182.56 ± 0.70) > Singgalang cabbage (142.50 ± 0.31) > lettuce (107.17 ± 2.19). While the lowest are fern (12.21 ± 1.30) < long beans (13.15 ± 0.12) < cabbage (15.55 ± 0.54). Isabelle et al got the TPC of vegetables tested varied widely ranging from 0.1 to 5.3 mg GAE/g FW.4 If it is considered that the average water content of these vegetables is 90% then the TPC are approximately 11 to 53 mg GAE/g DW. This value is smaller than that obtained in our study. This is probably caused by differences in the types of vegetables tested, chemical content of soils and extraction methods.
Correlation coefficient (r) between MPM, PM and FRAP with TPC are 0.7852, 0.8000 and 0.6767, respectively. The correlation value between PM and FRAP with TPC are obtained by Szydłowska-Czerniak et al are 0.7818 and 0.7830, respectively.13 This value indicates a strong correlation between the methods. Based on the correlation coefficient, it can be stated that TPC seems to be a good indicator of antioxidant capacity for fresh vegetables.4
Table 3: Total Phenolic Content of 14 vegetables.
| No | Sample | Total Phenolic Content(mg GAE/g DW) |
| 1 | Kale (Ipomoea aquatica) | 55.21 ± 2.04 |
| 2 | Lettuce (Lactuca sativa) | 107.17 ± 2.19 |
| 3 | Fern (Diplazium esculentum) | 12.21 ± 1.30 |
| 4 | Lobak Singgalang (Raphanus sativus L.) | 142.50 ± 0.31 |
| 5 | Cabbage (Raphanus raphanistrum subsp.sativus) | 15.55 ± 0.54 |
| 6 | Cassava Leaf (Manihot utilissima) | 182.56 ± 0.70 |
| 7 | Spinach (Amaranthus) | 36.75 ± 0.51 |
| 8 | Mustard (Brassica rapa subsp.pekinensis) | 27.85 ± 1.52 |
| 9 | Broccoli (Brassica oleracea var.italica) | 32.88 ± 0.12 |
| 10 | Beansprout (Flammulina velutipes) | 19.76 ± 0.24 |
| 11 | Long Beans (Vigna unguiculata ssp.sesguipedalis) | 13.15 ± 0.12 |
| 12 | Melinjo Leaf (Gnetum gnemon Linn.) | 64.48 ± 1.63 |
| 13 | Katuk Leaf (Sauropus androgynus) | 59.79 ± 0.35 |
| 14 | Mangkokan Leaf (Polyscias scutellaria) | 87.69 ± 1.39 |
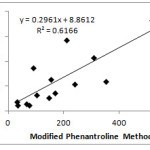 |
Figure 3: Correlation between MPM and TPC. |
Table 4: The correlation coefficient (r) between all methods
|
|
MPM |
PM |
FRAP |
|
PM |
0.9712 |
– |
– |
|
FRAP |
0.9896 |
0.9611 |
– |
|
TPC |
0.7852 |
0.8000 |
0.6767 |
Conclusion
MPM, PM and FRAP are precise and accurate methods for the determination of antioxidant content in vegetable samples. These three methods give results that do not differ significantly. These three methods have a very strong correlation, which shows a linear and significant relationship between methods. These three methods also show a strong correlation with TPC, so TPC value can be used as an indicator of antioxidant content in vegetable samples.
Acknowledgment
I would like to thanks The Ministry of Research, Technology, & Higher Education, Republic of Indonesia who has provided financial support for this research.
References
- Podsedek, A. LWT – Food Science and Technology, 2007, 40 (1), 1–11.
CrossRef - Venkatachalam, K.; Rangasamy, R.; Krishnan, V. International Food Research Journal, 2014, 21(3), 1003–1007.
- Lim, Y. Y.; Lim, T. T.; Tee, J. J. Food Chemistry, 2007, 103 (3), 1003-1008.
CrossRef - Isabelle, M.; Lee, B. L.; Lim, M. T.; Koh, W. P.; Huang, D.; Ong, C. N. Food Chemistry, 2010, 120 (4), 993-1003.
CrossRef - Nurliyana, R.; Syed Zahir, I.; Mustapha, S.K.; Aisyah, M. R.; Kamarul R.K. International Food Research Journal, 2010, 17, 367-375.
- Segev, A., Badani, H., Kapulnik, K., Shomer, I., Oren-Shamir, M. and Galili, S., Journal Food Science, 2010, 75, S115- S119.
CrossRef - Tiveron, A. P.; Melo, P. S.; Bergamaschi, K. B.; Vieira, T. M. F. S.; Regitano-d’Arce, M. A. B.; Alencar, S. M. International Journal of Molecular Sciences, 2012, 13(7), 8943-8957.
CrossRef - Ismail, A.; Marjan, Z. M.; Foong, C. W.; Food Chemistry, 2004, 87(4), 581-586.
CrossRef - Deng G. F.; Xu X. R.; Guo Y.J.; Xia E. Q.; Lia S.; Wu S.; Chen F.; Linga W.H.; Li H. B. Journal of functional foods, 2013, 4, 906 –914.
CrossRef - Bolanos de la Torre A.A.S., Henderson T., Nigam P. S., Owusu-Apenten R. K. Food Chemistry, 2015, 174, 119-123.
CrossRef - Tokusoglu O.; Yildrim Z.J. Field Crops, 2012, 17(1), 87-90.
- Berker, K. I.; Güçlü, K.; Tor, I.; Apak, R. Talanta, 2007, 72(3), 1157-1165.
CrossRef - Szydłowska-Czerniak, A., Dianoczki, C., Recseg, K., Karlovits, G., & Szłyk, E., Talanta, 2008, 76(4), 899-905.
CrossRef - Yefrida; Suyani, H.; Alif, A.; Efdi, M.; Aziz, H. Res. J. Chem. and Environ., 2018, 22(4), 28-35.
- https://www.aoac.org/aoac_prod_imis/AOAC_Docs/StandardsDevelopment/SLV_Guidelines_Dietary_Supplements.pdf
- Cao, G.; Sofic, E.; Prior, R. L. Journal of Agricultural and Food Chemistry, 1996, 44, 3426-3431.
CrossRef - Gazzani, G., Papetti, A., Massolini, G., & Daglia, M. Journal of Agricultural and Food Chemistry, 1998, 46, 4118–4122.
CrossRef - Evans, J. D., Straightforward statistics for the behavioral sciences, 1996, Pacific Grove, CA: Brooks/Cole Publishing.

This work is licensed under a Creative Commons Attribution 4.0 International License.
![]()
A New Edition of Web of Science
Journal Impact Factor
2022: 0.5
Five Year: 0.8
Journal is Indexed in

Cabells Whitelist
![]()


