Applications of Aquaponics on Pakcoy (Brassica Rapa L) and Nila Fish (Oreochromis Niloticus) to the Concentration of Ammonia, Nitrite, and Nitrate
Deswati , Niki Febriani, Hilfi Pardi, Yulizar Yusuf and Hamzar Suyani
Department of Chemistry, Faculty of Mathematics and Natural Science, Andalas University, Kampus Limau Manis, Padang, 25163 Indonesia.
Correspondence Author E-mail: deswati@sci.unand.ac.id
DOI : http://dx.doi.org/10.13005/ojc/340529
Article Received on : 16-08-2018
Article Accepted on : 18-09-2018
Article Published : 16 Oct 2018
To meet the consumption needs of fish and vegetables by utilizing a narrow urban land it can be used an aquaponic system. The aquaponic system is an integration of fish farming with hydroponic cultivation that utilizes the remains of feed and fish waste into nutrients for plants with the help of nitrifying bacteria. In this study used tilapia (Oreochromis niloticus) and Pakcoy (Brassica rapa L). Determination of ammonia, nitrite, and nitrate concentration aims to find the ammonia change to nitrite and nitrate in fish ponds, biofilter, and hydroponic sequences, and their absorption by plants. The ammonia concentration at three sampling points (3.231-8.989) mg/L and has exceeded the threshold of 0.02 mg/L, while for ammonia concentrations in each sample of pakcoy plant (558.563-2,001.659)mg/Kg. The concentration of nitrite (0.008-0.760)mg/L and has exceeded the standard quality threshold of 0.06 mg/L, except in the 0 day water sample sample 0.009 mg/ L and the water sample after the biofilter 0.008 mg/L, the concentration of nitrite pakcoy plant (3.764-12.321)mg/Kg. Nitrate concentration in water sample (1.046-2.275)mg/L, and still below the standard threshold of freshwater aquaculture (20-30)mg/L, nitrate concentration in pakcoy plant (4,890.09-12,864.7)mg/Kg. Ammonia and nitrite concentrations have exceeded the threshold, while nitrate concentrations are still below the threshold.
KEYWORDS:Ammonia; Aquaponic; Nitrite; Nitrate; Pakcoy; Tilapia
Download this article as:| Copy the following to cite this article: Deswati D, Febriani N, Pardi H, Yusuf Y, Suyani H. Applications of Aquaponics on Pakcoy (Brassica Rapa L) and Nila Fish (Oreochromis Niloticus) to the Concentration of Ammonia, Nitrite, and Nitrate. Orient J Chem 2018;34(5). |
| Copy the following to cite this URL: Deswati D, Febriani N, Pardi H, Yusuf Y, Suyani H. Applications of Aquaponics on Pakcoy (Brassica Rapa L) and Nila Fish (Oreochromis Niloticus) to the Concentration of Ammonia, Nitrite, and Nitrate. Orient J Chem 2018;34(5). Available from: http://www.orientjchem.org/?p=50826 |
Introduction
The world is currently faced with increased human population resulting in a high demand for energy, food, and water. Man’s quest to solve her ever-increasing needs has led to climate change, scarcity of fossil fuels, land degradation, and food shortages. Sustainable food production with little water and energy consumption is essential to finding solutions to this ever-increasing problem.1 The increase in human population has resulted in a significant increase in global food demand which has had an adverse effect on food security.2
In aquaculture, water quality plays an essential role in the survival of fishes. Poor water quality leads to an increase in the mortality rate of fishes cultivated in the waters. One of the factors leading to a reduction in fish farming activities is the high rate of ammonia and nitrites in these water. These substances are usually derived from the residual feed, urine, and feces of these sea animals.3
Aquaponics is an integrated crop production system between aquaculture (fish farming) and hydroponics (production of consumable crops) which has a vital role in sustainable food production. In an aquaponic system, organic materials toxic to animals can be transformed into nutrients for plants by microbes. In addition to this ecological benefit, it saves cost associated with the treatment water for aquaculture systems, and in fertilizers formulated for hydroponics systems which is beneficial to animals and plants. The waste generated on the aquaponic system can serve as a sustainable solution for commercial fish farming.4-5
The technology has been carried out in developed countries, especially those have limited land to optimize the productivity of aquatic biota. The basic principle beneficial for aquaculture is the remaining feed and fish dung that has the potential to worsen water quality will be used as fertilizer for water plants. The utilization is through the system recirculation of pond water that is distributed to the media plants, which mutually filter water so that when returning to the pool becomes “Clean” from ammonia elements and have conditions which is more feasible for fish farming. Recirculation function on very aquaponics systems closely related to the garbage “washing” process metabolic waste of fish (feces) and remnants undigested feed. This is closely related with the nitrogen cycle and the deep nitrification process waters of fish culture media.6
The aquaponics system cannot be released by nitrogen and nitrification in the aquaculture media. Nitrogen in the water can be in the form of organic nitrogen and inorganic nitrogen. Inorganic nitrogen can be ammonia (NH3), ammonium (NH4+), Nitrite (NO2), Nitrate (NO3) and Nitrogen (N2) molecules in the form of gases. While organic nitrogen is nitrogen derived from materials such as proteins, amino acids, and urea. Organic matter derived from the remaining feed and feces of the fish will experience deterioration of the main and released minerals which are nitrogen salts (derived from amino acids making up proteins). The decomposition process was first formed ammonia (NH3) as a result of the amendment of amino acids by various types of aerobic and anaerobic bacteria. Demolition will produce a free CO2 gas, according to the equation of the reaction are:
R. CH.NH2.COOH +O2 → R. COOH + NH3 + CO2
If the water situation gets worse, so that O2 in the water runs out, then the process of dismantling organic matter will be slowly taken away by other bacteria which are known to be Nitrosomonas into nitrite compounds. The reaction is as follows:
NH3+ HCO3–+ O2+ Phosphorous + trace elements → bacterial biomass + NO2–+ H+ If the water contains enough cations, the nitric acid formed can immediately be converted into nitrite salts, by Nitrobacter bacteria, the nitrite salts are then further worked into nitrate salts, the reaction is as follows:
NO2– + HCO3–+ O2+ Phosphorous + trace elements → bacterial biomass + NO3– Nitrite salts are important as minerals that are assimilated by green plants to make amino acids back in their bodies, to form protoplasm which then depends on nitrite, phytoplankton then become food ingredients for higher organisms. The nitrite can one day be further dismantled by denitrification bacteria (the famous Micrococcus denitrification), bacterium nitroxus becomes nitrogen-nitrogen free, the reaction is as follows:
5 C6H12O0 + 24 HNO3 → 24 H2 CO3 + 6 CO3 +18 H2O +12 N2
If the NH3 levels resulting from the dismantling of organic material in water are present in large quantities, which is caused by the process of breaking down the protein so that nitrate is not formed as the final result, then the water is called “being contaminated”.7
Pollution or pollution in aquaculture media is what then through the circulation system will be washed into the plant and utilized by the roots as natural fertilizer for the growth of aquatic plants. The “catch” water will become “clean” and can be reused as an aquaculture medium through an aquaponics process.
Ammonia (NH3) is a direct pollutant from fish farming activities. The existence of an aquaponics system, according to the results of the study, was able to provide improvements in water quality through the reduction of ammonia content. Other water quality parameters such as pH, DO and nitrite show results that have no real effect. This is presumably because the condition of aquaculture media is still in an ideal condition in a normal nursery system so that the aquaponics system does not show a significant improvement in media conditions.
Pakcoy (Brassica rapa L) is selected as a hydroponic plant because of its high commercial value, fast harvest rate, and its sufficient nutritional value for human health.8-9 The pakcoy plant classification is as follows:
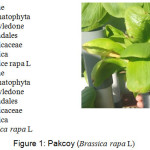 |
Figure 1: Pakcoy (Brassica rapa L). Click here to View figure |
In this study, the tilapia fish is used, because of its high demand by the local and foreign communities.10 Tilapia is the most widely used sea animal in the aquaponic system owing to its high availability, fast growth rate, high immunity rate, and its ability to easily adapt to an environment. Tilapia classification is as follows:
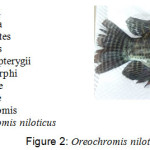 |
Figure 2: Oreochromis niloticus. |
Materials and Methods
Instruments and Materials
The instruments used in this study are UV-Vis Spectrophotometer DLAB Model SP-UV1100 range 190-1100 nm, kjeldhal pumpkin, heater, oven, analytical balance, fish pond, water pump, water tank, PVC pipe, netpot, aerator, and glassware commonly used in the laboratory.
The materials used in this study were 1000 nila fish (Oreochromis sp) (8-10) cm, fish food (pellets), plant seeds Pakcoy (Brassica rapa L), planting medium (Rockwool), water 6 m3, kalium bichromate (K2Cr2O7), concentrated sulfuric acid (H2SO4 (p)), potassium iodide (KI), starch, sodium thiosulfate (Na2S2O3), ammonium chloride (NH4Cl), mercury iodide (HgI2), sodium hydroxide (NaOH), seignette salt (K-Na Tartaric), sulfanilamide, NEDH, sodium nitrite (NaNO2), potassium nitrate (KNO3), hydrochloric acid (HCl), doubly distilled water.
Research Procedure
The Design of the Aquaponic System
The design of the aquaponic system comprises of a fish pond (diameter of 300 cm, and a height of 100 cm), a sediment filter tank (150 dm3), a biomedia tank (150 dm3), a filtration water tank (150 dm3), and a hydroponic circuit. The fishpond is filled with water to about 6 m3, with about 1000 fishes and protected by the transparent roof. Water from the fish pond is fed to the sediment filter tank, which flows through the biofilter tank, and to the filtration water tank resulting in the evolution of a hydroponic circuit. The water from the hydroponic chain was flowed to the last tank before being returned to the fish pond. The drainage is adjusted using a pump while an aerator was used to regulate the oxygen in the water.
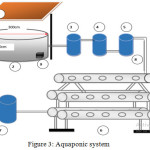 |
Figure 3: Aquaponic system. |
Information
Roof
Fish Pond Tank
Pond Water Container Tank
Biofilter tank
Waterfall Tank of biofilter
Hydroponics Series
Water holding tank from the hydroponic circuit
Pipe
Aerators
Preparation of planting media
The planting medium used is Rockwool with size 40×30 cm. It was cut into 1×1 cm to facilitate the transfer of seedlings from the seed medium into the netpot. Netpot served as a medium used to support the plant to enable its stem stand on the netpot. The netpot, is hence connected to a flannel cloth that serves as a water absorber, so that water can be stored on the planting medium, and nutrients in water can be absorbed by the plant. Pakcoy seedlings are shown for 2 weeks before being transferred to the hydroponics system.
Analysis of the Aquaponic System
Water quality analyzes performed on the aquaponic system are pH, DO (dissolved oxygen), COD (chemical oxygen demand), ammonia, nitrite, and nitrate by using the6, 11-12 procedure. Analysis of the aquaponic system is water in fish ponds, tanks after biofilter, and tank after hydroponic plants, as well as pakcoy plants. When the water analysis is done, the aerator in the fish pond is switched of.
Result and Discussions
pH
The pH value of water used was found to be between (7.7-8.09) (Fig.4). This is a standard pH value which meets the standard quality in accordance with Government Regulation13 for freshwater fish farming pH (6-9). From the first day till the last day (0 -30), there was no significant difference pH. The recommended pH value for an aquaculture system is (6.5-8.5), while for a slightly acidic hydroponic system (5.5-6.5). According to,14 if the pH value of water in the aquaponic system exceeds the recommended pH value, the nutrients and yields of the plants will be reduced.
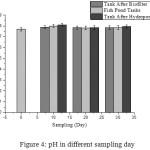 |
Figure 4: pH in different sampling day. |
Dissolved Oxygen (DO)
DO is an important element especially for plants and animals living in water. DO in water comes from aquatic plants during photosynthesis and from air entering into the water. Analysis obtained from the three sampling points proved an overall low DO concentration.
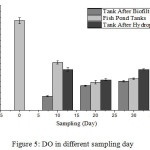 |
Figure 5: DO in different sampling day. |
DO concentrations of least 4 mg/L,13 and DO in the aquaponic system, do not meet the standard quality. It also met the standard quality on day 0, that is 7.5 mg/L. The accumulation of organic matter led to the formation of toxic compounds for fish, nutrient mineralization from organic matter and high oxygen uptake.15 Low DO concentrations in water, will result in the increased mortality rate of fishes in water.16 Low DO concentration is inversely proportional to ammonia concentrations in water, if the concentration of ammonia in water is high, then DO concentration it will be low water17 (Fig. 5).
Chemical Oxygen Demand (COD)
Based on Fig. 6, the COD concentration of pond water at 0 days was 6.0984 mg/L. For the next 10 days and 20 days, the COD concentration of pond water increased by 6.2080 mg/L and 9.5232 mg/L.This is because the aquaponics system was not operated in 0 days. However, after 30 days COD concentration of pond water decreased.
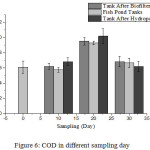 |
Figure 6: COD in different sampling day. |
Data on COD concentrations on days 10 and 20 decreased after passing it through the biofilter tank. This is because some organic substances were converted into inorganic substances by the bacteria and microbes present in the biofilter tank, so it takes less oxygen to oxidize organic substances that exist in the tank after passing the biofilter13. While the COD value again increased after passing the hydroponic circuit, due to the amount of decay in hydroponic plants, the value of COD increased. However, on day 30, the concentration of COD from pond to tank after passing biofilter decreased, as well as after passing hydroponic circuit (6.8288; 6.6736; and 6.2080) mg/L. This came about after the measurement on the 20th day, in which the root of the decomposed plant is cut so as to reduce the organic substances present in the hydroponic plant, and also to decrease the COD value in the hydroponic system. Thus, this aquaponic system can reduce the concentration of COD, and it is proven that the average COD value is still below the threshold value of 10 mg/L (Fig. 6).
Ammonia
In fish farming, ammonia is one of the causes of water pollution. Ammonia is obtained from the excretes of fish such as urine and feces, as well as the residual fish feed that settles on the base of waters.18
Fig. 7, displays the ammonia concentration of water in the pool water sample to be 3.231 mg/L. This is because the aquaponics system wasn’t treated and the dissolved oxygen concentration in the fish pond was relatively high (7.7 mg/L). According to,13 the maximum ammonia content for fish farming activities is 0.02 m/L with regards to our obtained results, the ammonia content in the pond has exceeded its threshold.
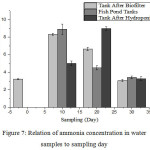 |
Figure 7: Relation of ammonia concentration in water samples to sampling day. |
The concentration of ammonia in a 10 old day fish pond is 8.333 mg/L, after passing a biofilter tank, it becomes 8.904 mg/L, and after passing the hydroponic plant, it becomes 5.027 mg/L. The ammonia concentration of water from the fish pond to the biofilter tank will increase should the ammonia level decrease due to the aid of a nitrifying bacteria that convert ammonia to nitrite. After passing the tank down to the hydroponic plant the concentration rate decreased by 5.027 mg/L indicating that the ammonia content had been changed to nitrite, then to nitrate, and absorbed by the plant after which it was dissolved. The oxygen concentration in the fish pond (1.2 mg/L) obtained from the previous day, also decreased after passing it through the biofilter tank 4.1 mg/L and in water after a hydroponic plant of 3.5 mg/L. On the 20th day, ammonia concentrations decreased from the pond to the biofilter tank, with an increase in ammonia concentration present in the tank water. On the 30th day, there was a decrease in ammonia concentration which had no significant difference on the ammonia concentration of the 0th day, because the roots of moss plants had been cut and the number of plants on the 30th day was added so that the plants could absorb ammonia well. The high concentration of ammonia is accompanied by a decrease in DO in water because, in order to convert ammonia into nitrite, a large amount of oxygen is required, therefore, the DO in water becomes reduced. According to,17 if the ammonia levels in the system are high, then the concentration of DO will be low. Rully,19 beams that if the DO levels in water are between (1 – 5) mg/L, the growth of fish will be really slow. However, small DO from 1 mg/L would be toxic to most fish species. The number of fishes in the pond also affects the concentration of DO in the water, if the number is too much, the oxygen in water should be increased. This is because fishes need oxygen for metabolism. In this study, fishes tend to die every week owing to the low DO in the water, and the high level of ammonia in the water. High levels of ammonia in water are also followed by high temperatures and pH in the aquaponic system, from the previous studies.20 If the pH value is higher than the ammonia value found, and if the temperature and pH at day 10 is higher than that on the 20th day then the ammonia concentration found on the 10th day is higher compared to the 20th day or day to the pH value of fish cultivated on the 30th day.13 The temperature difference in the aquaponic system is caused by weather conditions such as heat, rain, and the duration of sunlight coming in on the aquaponic system. The high levels of ammonia in the aquaponic system are because the fish excreted large amounts of feces and urine in the pond.
Inserting an unequal amount of fishes and plants will also affect the absorption of ammonia by plants if the number of fish and plants are unbalanced, then there will be excess ammonia in the water, so which will be to the detriment of both fishes and plants5. Based on Government regulation,13 the entire water sample which analyzed ammonia content showed ammonia concentration exceeding the threshold for freshwater fish culture.
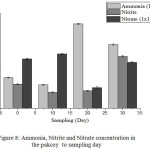 |
Figure 8: Ammonia, Nitrite and Nitrate concentration in the pakcoy to sampling day. |
Levels of ammonia in plants on the day-0 equal 723.420 mg/Kg. High levels of ammonia in plants mean that there is a high level of ammonia contained in water so that plants absorb ammonia in large quantities. On day 10 the ammonia concentration in the plant was 558.563 mg/Kg and showed a reduction in the concentration between day 0 plant samples and 10-day plant samples which meant that the samples of the plants on the 10th day absorbed less ammonia. On the 20th-day, plant samples showed an increase in ammonia levels with a value of 2,001.659 mg/Kg. However, there was a decrease in the 30th-day with a value of 1.510.38 mg/Kg. Excess ammonia in crops adversely affects plant growth and produces yellowish leaves. Differences in ammonia levels in plant samples indicate that there are differences in the absorption of each plant even in one plant species (Fig. 8).
Nitrite
As with ammonia, nitrite can also cause poisoning in fish and plants, if the nitrite levels exceed the limits under Government Regulation 2001, it is likely to have an adverse effect on freshwater aquaculture (Fig. 9).
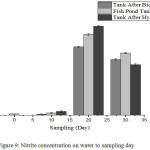 |
Figure 9: Nitrite concentration on water to sampling day. |
In Fig. 9, it can be seen that the concentration of nitrite on day 0 ≤ 0.009 mg/L in the fish pond tank. On the 10th day the nitrate concentration increased from day 0, and on the 20th day, the concentration of nitrite increased quite significantly in the fish pond to 0.691 mg/L but decreased to 0.583 mg/L after passing through the biofilter tank. This condition indicates that the nitrite in a fish pond, changes to nitrate in biofilter tank. However, after hydroponic plant, nitrite concentration increases. This means that nitrite absorption is not absorbed by the plant and the hydroponic plant tank changes nitrite to little nitrate. The change from ammonia to nitrite in the tank after pakcoy has been absorbed by the plant is not optimal because, by the 20th day, many fungi will be found on the roots of plants, making it difficult for the plant to properly absorb nutrients. On the 30th day there was a decrease of nitrate concentration at the three sampling points, the concentration of nitrite from the fish pond tank to the tank after the hydroponic plant decreased, because on the 30th day the plant root containing moss was cut, and the number of hydroponic plants increased, so that the filtration process in plants becomes more effective. The nitrification process is more efficient at high oxygen conditions, but ammonia changes into nitrite still in progress, albeit under low oxygen conditions.17
Nitrite concentrations of days 10, 20, and 30 using three water sampling points obtained results that exceeded the quality standard threshold for freshwater aquaculture. According to4, 21, nitrate concentrations are undetectable in water. The aquaponics system cannot be separated from the nitrogen cycle process and the nitrification process in the culture medium, inorganic nitrogen in the form of ammonia, ammonium, nitrite, and nitrate and nitrogen molecule (N2) in gaseous form, whereas organic nitrogen is protein, amino acid and urea derived from the rest feed that is not consumed by the fish, the rest of the metabolism of fish in the form of feces and urine will experience the process of decomposition into ammonia which is the result of amino acid reshuffle by aerobic bacteria and anaerobes. If the water conditions deteriorate, the dismantling of organic material will be carried out by Nitrosomonas bacteria into nitrite compounds (Fig. 9).
The concentration of nitrite each day showed a different result. Each day that passes by, it was found that the nitrite concentration kept increasing. It was high enough on the first-day plant sample, followed by the 10th day. However, on the 20th day, the concentration of nitrite on the sample plant under study was smallest whereas in the 30th-day plant samples had a significant increase, indicating that on the 30th-day nitrite was absorbed by the plant. This is also shown on the 30th-day when water samples of nitrate concentrations in the tank decreased after the hydroponic plants were passed through the biofilter, which means that on the 30th-day adequate nitrite was absorbed. Nitrite compounds are important minerals used by plants to regulate amino acids. The absorption of nitrite can lead to plant poisoning which prevents the plant from developing properly (Fig. 9).
Nitrate
 |
Figure 10: Nitrate concentration on water samples to sampling day. |
From Fig. 10, it can be seen that the nitrate concentration in pool water samples on the first day was 1.069 mg/L, with no much difference with that on the 10th day. Furthermore, the on the 10th day, the nitrate concentration in the tank water after the biofilter has passed through the pond water, decreased; this indicates that the nitrate present in the biofilter tank is not completely converted to nitrate. This shows that the plants did not absorb the nitrate in large quantities. The 20th-day sampling showed that the concentration of nitrate in pond water increased in the fish pond tank. This increase is, however, proportional to the increased value of ammonia concentration on the 10th day, where the ammonia was converted to nitrite and nitrate on the 20th day. This indicates that plants do not absorb nitrates, because on the 20th day the roots of the plants were overgrown with moss, so that the nitrate content in the water is not absorbed completely by the plants, and the nitrate can be absorbed by the moss attached to the plant roots. Nitrate concentration also has a significant effect on DO in water. According to,17 if DO is low then the concentration of nitrate is low, and if DO is high then the concentration of nitrate in water will be high because nitrifying bacteria do not need oxygen in large amount to convert nitrite to nitrate. The 30th-day sampling showed that the concentration of nitrate in the water decreased. While taking in the fish pond, the nitrate concentration was found to be 1.757 mg/L. It later increased in the tank after passing through the biofilter to 1.977 mg/L. This indicates that the ammonia in the biofilter tank has been converted to nitrate, whereas in the final tank after the hydroponic plant, the nitrate concentration decreases meaning that the nitrate has been absorbed by the plant. Nitrate is the final product of the nitrification process, nitrate is not toxic to fish if it does not exceed a predetermined threshold14. Based on the 2001 government regulation, nitrate concentration of 10 mg/L for flower cultivation, was obtained from three sampling points for 30 days.
During nitrification, ammonia is converted to nitrate, this nitrate is used as a source of plant nutrients. Nitrogen is an essential the macro element needed by plants to grow, just like phosphor and potassium. The absorption of nitrogen will affect the growth, appearance, color, and growth of the plant. Nitrogen can make plants green because it contains chlorophyll which plays an essential role in photosynthesis. The different nitrate concentrations obtained in each plant sample is due to differences in the absorption of each plant sample.
Conclusion
It can be concluded that the ammonia and nitrite content in water has exceeded the predetermined concentration threshold, while the nitrate is still below the threshold. In the analysis of ammonia, nitrite, and nitrate in the plant, different samples were obtained from the different samples. The concentration of DO is not yet optimal, while COD and pH are in compliance with the standard quality standard set by the Government.
Acknowledgments
The authors would like to the Ministry of Research and Higher Education, which has funded (BOPTN) this study superior research at the University of Andalas in 2018.
References
- Suhl, J; Dannehl, D; Kloas, W;Baganz, D. J. Scheibe, G; Schmidt, U. Agricultural water management. 2016, 178, 335-344.
CrossRef - Conforti, P. Looking ahead in world food and agriculture: Perspectives to 2050. Food and agriculture organization of the united nations (FAO). Rome. Italy, 2009.
- Syamsu Roidah, Ida. Journal of Tulungagung University, 2014, 1(2), 43-51.
- Nugroho, R.A; Pambudi, L.T; Chilmawati, D; Haditomo, A.H.C. Journal of Saintek Fishery. 2012,8(1), 46-51.
- Liang, J.Y; Chien, Y.H. Int. Biodeteration & Biodegradation. 2013,85(5), 693-700.
CrossRef - Suyani, H; Deswati; Refilda; Sutopo, J. Der Pharma Chemica. 2016, 8(10), 102-108.
- Metcalf and Eddy. Wastewater engineering treatment disposal reuse. Third edition, revised by George Tchobanoglous, Frank Burton. Newyork. McGraw Hill. 1991.
- Effendi, H; Utomo, B.A; Darmawangsa, G.M.. Ecolab J. 2015, 8 (2), 47-104.
- Oktafiani, B. Modified hydroponics water culture system in Pakcoi (Brassicachinensis L.) Plant. Thesis of Lampung University. 2009.
- Hussain, M.G. Farming of tilapia-breeding plans, mass seed production and aquaculture techniques. Bangladesh Fisheries Reseach Institute, Mymensingh 2201, Bangladesh 2004, 149.
- Refilda; Gustin, L.P; Suyani, H; Deswati. Asian Journal of Microbiology, Biotechnology, and Environmental Sciences. 2018, 20(Feb. suppl), S9-S16.
- Indrawati; Achmad, R; Suyani, H; Refilda; Pardi, H; Deswati. Pollution Research. 2018, 37(2), 9-14.
- Government Regulation Number 82 the year 2001 class 2 and 3
- Tyson, R.V; Simonne, E.H; Davis, M.; Lamb, E.M; White, J.M; Treadwell, D.D. Journal of Plant Nutrition. 2007, 30 (6), 901–913.
CrossRef - Hopkins, J. S; Sandifer, P. A; Browdy, C. L. Aquacultura Engineering., 1994, 13, 11-30.
CrossRef - Fardiaz. Pollutions of water and air. Yogyakarta: Kanisius. 1992.
- Wongkiew, S.; Popp, B.N.; Khanal, S.K. Int. Biodeterioration & Biodegradation. 2007,125, 24-32.
CrossRef - Pillay, T.V.R. Aquaculture and The Enviroment2nd. UK. Blackwell Publishing. 2004.
- Rully, R. Determining the time of retention of the aquaponics system to reduce cultivation of Red Tilapia, fish Cyprinus sp. essay. Bogor. Department of Aquaculture, Faculty of Fisheries and Marine Sciences, Bogor Agricultural Institute. 2011.
- Widyastuti, Y.R. Increase of freshwater production through aquaculture the aquaponic system. Bogor. Proceedings of national seminar of limnology IV LIPI. 2008.
- Spotte, S. Fish and invertebrate culture : water management in closed systems. Willey-Interscience Publication. John Wiley & Sons. Inc. New York., 1970.

This work is licensed under a Creative Commons Attribution 4.0 International License.
![]()
A New Edition of Web of Science
Journal Impact Factor
2022: 0.5
Five Year: 0.8
Journal is Indexed in

Cabells Whitelist
![]()


