A Correlation Study Between the Concentrations of Gold, Iron and Sulphate in Quartz Rock Samples Obtained from four Different Locations in Sudan
Abualreish M. J. A1,2 and Mohamed Ezeldin1
1Department of Chemistry, Faculty of Science and Technology, Omdurman Islamic University, Khartoum, Sudan.
2Department of Chemistry, Faculty of Science, Northern Border University, Arar, Kingdom of Saudi Arabia.
Corresponding Author E-mail: Mustjeed_2008@hotmail.com
DOI : http://dx.doi.org/10.13005/ojc/340520
Article Received on : 06-06-2018
Article Accepted on : 11-10-2018
Article Published : 18 Oct 2018
From four different locations in Sudan namely, Aboharaz (Central Sudan), Port – Sudan (Eastern Sudan) , Algaab (Western Sudan) and Ombal (Southern Sudan) three quartz rocks samples from each location were collected; All samples were analyzed to determine the concentration of Gold (Au(III)), Iron (Fe (III) and Sulphate(SO4-2). Atomic absorption spectrometry technique was used to determine the concentrations of Gold and Iron ,while that of Sulphate has been determined by the use of spectrometry technique. All samples showed positive correlation between gold and sulphate concentration except those collected from Port – Sudan, in addition a negative correlation between gold and iron concentration has been observed in all samples.
KEYWORDS:Correlation; Gold; Iron; Spectrometry, Sulphate; Sudan
Download this article as:| Copy the following to cite this article: Abualreish M. J. A, Ezeldin M. A Correlation Study Between the Concentrations of Gold, Iron and Sulphate in Quartz Rock Samples Obtained from four Different Locations in Sudan. Orient J Chem 2018;34(5). |
| Copy the following to cite this URL: Abualreish M. J. A, Ezeldin M. A Correlation Study Between the Concentrations of Gold, Iron and Sulphate in Quartz Rock Samples Obtained from four Different Locations in Sudan. Orient J Chem 2018;34(5). Available from: http://www.orientjchem.org/?p=51142 |
Introduction
Gold is widely distributed throughout the world, normally in very low concentration and generally in native form as metal. It is shiny yellow, soft and chemically inert metal. Gold belongs to the group of elements which occur on the Earth with very low natural abundances and its origin is one of the most attractive problems in geochemistry.1 Gold occurs in small quantities in clays, pyrite and in almost all silver, copper, bismuth, lead, zinc, tellurium and antimony ores.2 The increase in gold exploration has led to further development and refinement of methodologies for its determination in geological materials .Due to its very low concentration, the sample matrix may cause serious interferences during gold determination; therefore pre concentration and separation methods should be used to solve these problems and render more sensitive, accurate and interference free determination. Gold is the most noble of all the metals and this is the key to both its eternal romance and its many practical uses in industry. It is the only metal, for example, that is not attacked in air or water by either oxygen or sulphur, and its durability under the most corrosive conditions has led to its widespread use in coinage and jewellery through the ages.3 Gold is the only metal that is generally found in nature in the metallic state,4,5 and the only gold compounds that occur in a natural state are the telluride and stibnite species, AuTe2 and AuSb2 • Gold reacts with all the halogens, most vigorously with bromine, which undergoes an exothermic reaction with gold powder at room temperature to produce Au2Br6 • gold complexes in aqueous solutions, and this is a far broader subject.6,7 It has been traditionally accepted that gold complexes in aqueous solution can exist in one of two oxidation states, the aurous (+1) or the auric (+3), and that all the gold complexes of hydrometallurgical interest fall into these two groups.5 In more recent years, compounds with formal oxidation states of -1, +2, +4, and +5 have been prepared and identified, but these compounds are more of an academic curiosity at present and will not be dealt with in this review.8,9
Materials and Methods
All chemicals used were of analytical reagent grade (AR, they are obtained from Sigma Chemical Co. (St. Louis, MO). Hydrochloric acid 35%, nitric acid 63%, hydrofluoric acid 40% and DIBK (di-isobutyl ketone). The quartz rock samples used in this study were collected from four different locations in Sudan namely, Aboharaz (Central Sudan ), Port – Sudan (Eastern Sudan), Algaab ( Western Sudan ) and Ombal (Southern Sudan).The samples were converted to powder by using rock cracker. The Atomic Absorption Spectrometry (AAS) instrument used in this study was worked by flame atomization technique. The AAS instrument was planked by injection of methyl isobutyl ketone.
Determination of Gold and Iron Concentration in Quartz Rock Samples by Using Atomic Absorption Spectrometry (AAS)
Preparation of Samples
About 10g from each sample were weighted and transferred into a separate clean Teflon beaker, each sample was then dissolved by adding 45mL conc HF, and heated at 250oC until it was converted to white paste. The produced paste from each sample was then transferred into separating funnel. About 20mL HCl (0.1M) and 50mL of DIBK were added to the aqueous layer in the separating funnel at batching, then each bottom layer (sample) was separated in a clean tube.10,11,12
Preparation of Standards
A 0.5, 1, 10 and 50 ppm of Au solutions have been prepared by diluting appropriate amount from stock Au (IV) solution. They were injected to the AAS instrument, in which a standard calibration curve was constructed from the results. Then the samples S1,S2,S3 and S4 were injected in the same manner to determine their concentration. all above steps were repeated to determine the concentration of iron.13
Determination of Sulphate Concentration in Quartz Rock Samples by Using UV – Spectrophotometry
The concentration of sulphate in quartz rock samples was determined according to the method described by Ezeldin and Osama13
Results and Discussion
The concentration of the marked samples.
Table 1: The Gold, Iron and Sulphate concentration of quartz rock samples collected from aboharaz are shown in tables 1,2,3 and 4.
| Sample Number | Au(ppm) | Fe (ppm) | SO42- (ppm) |
| H1 | 1.379 | 1.99 | 0.0023 |
| H2 | 1.391 | 0.974 | 0.006 |
| H3 | 1.484 | 4.04 | 0.0037 |
The results obtained in table 1 revealed that when the concentration of sulphate increase the concentration of gold increase. No relationship between gold and iron concentration has been observed. Fig.1 shows the correlation between the concentrations of Gold, Iron and Sulphate for aboharaz sample separately, and Fig. 2 shows the relation between the net concentrations of Gold, Iron and Sulphate in aboharaz.
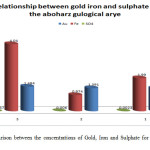 |
Figure 1: Comparison between the concentrations of Gold, Iron and Sulphate for aboharaz sample separately. |
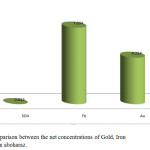 |
Figure 2: Comparison between the net concentrations of Gold, Iron and Sulphate in aboharaz. |
Table 2: The Gold, Iron and Sulphate concentration of quartz rock samples collected from Algaab.
| Sample Number | Au (ppm) | Fe (ppm) | SO42- (ppm) |
| G1 | 1.505 | 2.68 | 0.0041 |
| G2 | 1.847 | 0.88 | 0.005 |
| G3 | 1.66 | 0.93 | 0.0153 |
It is obvious from table 2 that the data from algaab shows a positive correlation between gold and sulphate concentration, while there is no correlation between gold and iron concentration. Fig.3 shows the relation between the concentrations of Gold, Iron and Sulphate for agaab samples separately and fig.4 shows the relation between the net concentrations of Gold, Iron and Sulphate in algaab.
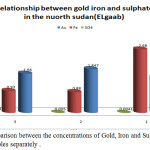 |
Figure 3: Comparison between the concentrations of Gold, Iron and Sulphate for algaab samples separately. |
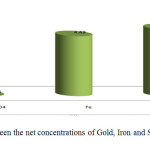 |
Figure 4: Comparison between the net concentrations of Gold, Iron and Sulphate in algaab. |
Table 3: The Gold, Iron and Sulphate concentration of quartz rock samples collected from port-Sudan.
| Sample Number | Au (ppm) | Fe (ppm) | SO42- (ppm) |
| P1 | 0 | 0.522 | 0.0045 |
| P2 | 0.078 | 0.535 | 0.0907 |
| p3 | 9.364 | 0.414 | 0.0002 |
The data obtained from port – Sudan samples revealed that no correlation has been observed between the concentrations of gold, Iron and sulphate. Fig.5 shows The Crelation between the concentrations of Gold, Iron and Sulphate for port – sudan samples separately, while fig.6 shows the relation between the net concentrations of Gold, Iron and Sulphate in port – Sudan.
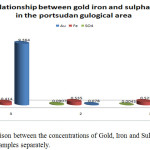 |
Figure 5: Comparison between the concentrations of Gold, Iron and Sulphate for Port –Sudan samples separately. |
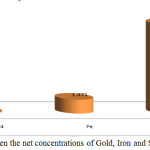 |
Figure 6: Comparison between the net concentrations of Gold, Iron and Sulphate in port- Sudan. |
Table 4: The Gold, Iron and Sulphate concentration of quartz rock samples collected from Ombal.
| Sample Number | Au (ppm) | Fe (ppm) | SO42- (ppm) |
| M1 | 14.58 | 7.05 | 0.0102 |
| M2 | 2.179 | 6.98 | 0.0019 |
| M3 | 6.194 | 7.51 | 0.0023 |
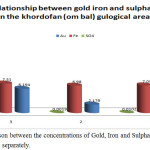 |
Figure 7: Comparison between the concentrations of Gold, Iron and Sulphate for Ombal samples separately. |
It is obvious from table 4 that the concentration of gold and sulphate shows positive correlation in ombal samples but there is no correlation between iron and gold concentrations. Fig. 7 shows The realtion between the concentrations of Gold, Iron and Sulphate for ombal samples separately, while fig. 8 shows the relation between the net concentrations of Gold, Iron and Sulphate in ombal.
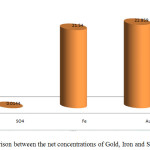 |
Figure 8: Comparison between the net concentrations of Gold, Iron and Sulphate in Ombal. |
Conclusion
Twelve samples from deferent areas in Sudan (aboharaz, algaab, Port – Sudan and Ombal) were objected to analysis of Gold, Iron and Sulphate concentration. Gold and iron concentrations have been investigated by Atomic Absorption Spectrometry technique while the concentration of sulphate has been determined by spectrometery technique. All samples in deferent areas have showed positive correlation between gold and sulphate concentration except the samples collected from port – Sudan. All samples have been showed a negative correlation between gold and Iron concentration.
Acknowledgments
We greatly thanks the ministry of minerals in Sudan (Khartoum) and the chemical laboratory at Omdurman Islamic University at which the experimental work has been conducted.
References
- De Heer.W.A. “The physics of simple metal clusters: experimental aspects and simple models” Rev. Mod. Phys. 1993, 65, 611. https://doi.org/10.1103/RevModPhys.65.611.
CrossRef - Johnston. L. Atomic and molecular clusters. 2002, Taylor Francis, USA, Canada. https://doi.org/10.1201/9781420055771.
CrossRef - Ellis, T. “The future of gold in electronics” Gold bulletin, 2004, 37, 66. https://doi.org/10.1007/BF03215518.
CrossRef - Yoon,B. Koskinen, Huber,P. B. Kostko, von Issendor, O. B. Häkkinen, H. Moseler M.and Landman,U. “Size-dependent structural evolution and chemical reactivity of gold clusters” Chem. Phys.Chem 2007, 8, 157. https://doi.org/10.1002/cphc.200600524.
CrossRef - Taylor, K.J. Pettiette-Hall, C.L. Cheshnovsky ,O. and Smalley, R.E. “Ultraviolet photoelectron spectra of coinage metal clusters” J. Chem. Phys. 1992, 96, 3319. https://doi.org/10.1063/1.461927.
CrossRef - Häkkinen, Moseler H. M. and Landman,U. “Bonding in Cu, Ag, and Au clusters: Relativistic e_ects, trends, and surprises” Phys. Rev. Lett. 2002, 89, 033401. https://doi.org/10.1103/PhysRevLett.89.033401.
CrossRef - Hutchings,G. J. “Vapor-phase hydrochlorination of acetylene – correlation of catalytic activity of supported metal chloride catalysts” J. Catal. 1985, 96, 292. https://doi.org/10.1016/0021-9517(85)90383-5.
CrossRef - Nkosi,B. Coville, N. J. and Hutchings,G. J. “Reactivation of a supported gold catalyst for acetylene hydrochlorination” J. Chem. Soc., Chem. Commun. 1988, 71. https://doi.org/10.1039/c39880000071.
CrossRef - Nkosi,B. Coville,N. J. Hutchings, G. J. Adams, M. D. Friedl, J. and Wagner, F. “Hydrochlorination of acetylene using gold catalysts – A study of catalyst deactivation” J. Catal. 1991, 128, 366. https://doi.org/10.1016/0021-9517(91)90295-F.
CrossRef - Hutchings ,G. J. and Haruta,M. “A golden age of catalysis”: A perspective. Appl.Cat. A . 2005 , 291, 2. https://doi.org/10.1016/j.apcata.2005.05.044.
CrossRef - Haruta,M. Kobayashi,T. Sano ,H. and Yamada,N. “Novel gold catalysts for the oxidation of carbon monoxide at a temperature far below 0±C” Chem. Lett. 1987,16,405. https://doi.org/10.1246/cl.1987.405.
CrossRef - Hayashi,T. Tanaka, K. and Haruta,M. “Selective vapor-phase epoxidation of propylene over Au/TiO2 catalysts in the presence of oxygen and hydrogen” J. Catal. 1998, 178, 566. https://doi.org/10.1006/jcat.1998.2157.
CrossRef - Ezeldin, M and Alsiddig ,O “determination of gold concentration in quartz rock samples” International Journal Current Research, 2015, 6(7),24-28.

This work is licensed under a Creative Commons Attribution 4.0 International License.
![]()
A New Edition of Web of Science
Journal Impact Factor
2022: 0.5
Five Year: 0.8
Journal is Indexed in

Cabells Whitelist
![]()


