Water Resource use and Management, Determination of Physical-Chemical Water Parameters in Radonique Lake
Adem Dreshaj and Bedri Millaku
Department of tourism management and environment University of “Haxhi Zeka”, Peja, Kosovo.
Corresponding Author E-mail: adem.dreshaj@unhz.eu
DOI : http://dx.doi.org/10.13005/ojc/340409
Article Received on : 25-07-2018
Article Accepted on : 04-08-2018
Article Published : 26 Aug 2018
This paper aims to reach clear conclusions and conclusions about the importance of management in increasing water quality, monitoring wind, taste and color, and so on. . Studies have been carried out in Radoniq Lake, monitoring physical and chemical parameters as well as heavy metals. Research results have been successful since we have managed to come up with concrete results and conclusions about what it is aimed at. Normally, heavy metals are defined in some locations such as : H-1, H-2, H-3, H-4, H-5 (Fe, Mn, Al, NO 3, NO 2, NH 4+). So the management of water resources has an irrefutable importance in achieving the desired performance on the market, which has also been proven by scientific research, the results of which will appear in some cases exceed international standards.
KEYWORDS:Chemical Parameters; Irrefutable; Radonique
Download this article as:| Copy the following to cite this article: Dreshaj A. Millaku B. Water Resource use and Management, Determination of Physical-Chemical Water Parameters in Radonique Lake. Orient J Chem 2018;34(4). |
| Copy the following to cite this URL: Dreshaj A. Millaku B. Water Resource use and Management, Determination of Physical-Chemical Water Parameters in Radonique Lake. Orient J Chem 2018;34(4). Available from: http://www.orientjchem.org/?p=48748 |
Introduction
Water is a substance without which there would have been no life on our planet. It is a constituent of all living plant and animal organisms.1,2 Most of the water is found in the ocean (97%), or in the form of ice. Less than 1% of the planet’s water is destined for human consumption. The vast majority of fresh water is found in the form of groundwater.2,3 Only one fraction (about 0.01%) of water is found in the form of surface water (lakes, rivers, etc.). This fraction is very important for ecosystems and human life.4 This natural resource is becoming increasingly scarce in some places, and its security is a major social and economic concern.
Experimental
With population growth and industry development, water demands are increasing, resulting in the formation of large quantities of polluted waters.8,9 Polluted waters, in most cases, are poured straight into the natural streams of the lake, causing undesirable phenomena in the case of changing the organoleptic properties of water, such as wind and taste.5,1
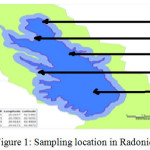 |
Figure 1: Sampling location in Radoniq lake Click here to View figure |
Fine water quality parameters.10,11 According to the WHO, the main parameters for drinking water can be divided into groups:
Organic-Leptic Parameters: Color, Blur, Wind, and Taste;
Physical-chemical parameters: temp, pH, electrical conductivity, chlorides, sulphates, silicates, total hardness, calcium, magnesium, sodium, potassium, dried residue at 1800 C, dissolved O2;
Substances: NO3-, NO2, NH4 +, KMnO4, Total Organic Carbon (TOC), H2S, Fe, Mn, Cu, Zn, F, B, Cl2, Ba, Ag;
Toxic substances: As, Cd, CN, Cr, Hg, Ni, Sb, Se, pesticide;
Microbiological parameters: total coliform (Escherichia coli), fecal coliform bacteria, fecal streptococcus, total bacteria, etc.
Sampling Frequency
The sampling frequency and water quality analysis is determined in accordance with AI.3,11 Based on the number of inhabitants, respectively the average daily amount of water entering a supply area.6,7 This frequency is presented for each supply area in tabular form divided by the following routine.
Table 1: Determination of physical and chemical parameters in heavy metals in Radoniq lake.
| Supply area RA 01 -1population / volume of water 76100 inhabitants – 25,360 m3 / day | |||||
| R1 | |||||
| Parameters | Unit | Parameters Value | Monitoring point | No. Pattern | |
| Potassium Bacteria | Number /100 ml | 0 | IT+RZ + RB | 180 | |
| Escherichia coli | Number /100 ml | 0 | IT+RZ + RB | 180 | |
| Residual chlorine | mg/l | 0.2 | IT+RZ + RB | 180 | |
| Turbidity | IT+RZ + RB | 180 | |||
| R2 Controller Monitoring | |||||
| Strom | – | – | RB | 79 | |
| Color | – | – | RB | 79 | |
| Flavor | – | – | RB | 79 | |
Table 2: Determination of the wind sensitivity threshold expressed by the system of points 0-5.
| Column calculated at 22 oC and 37 oC | nr/mg/l | Without change | IT+RZ + RB | 79 | |||
| Ammonia | mg/l | 0.5 | RB | 79 | |||
| Chlorides | mg/l | 250 | RB | 79 | |||
| Flexibility | μS/cm at 20oC | 2500 | RB | 79 | |||
| pH | Njësi të pH | ≥ 6,5 dhe≤ 9,5 | RB | 79 | |||
| R2 Additive Monitoring | |||||||
| Antigens | μg/l | 5.0 | RB | 5 | |||
| Arsenic | μg/l | 10 | RB | 5 | |||
| Mercury | μg/l | 1.0 | RB | 5 | |||
| Cadmium | μg/l | 5.0 | RB | 5 | |||
| Chromium | μg/l | 50 | RB | 5 | |||
| Copper | mg/l | 2.0 | RB | 5 | |||
| Cianied | μg/l | 50 | RB | 5 | |||
| Enterococci | n/100 ml | 0 | RB | 5 | |||
| Fluoride | mg/l | 1.5 | RB | 5 | |||
| Lead | μg/l | 10 | RB | 5 | |||
| Manganese | μg/l | 50 | RB | 5 | |||
| Nickel | μg/l | 20 | RB | 5 | |||
| Nitrates | mg/l | 50 | RB | 5 | |||
| Nitrites | mg/l | 0.5 | RB | 5 | |||
| Selenium | μg/l | 10 | RB | 5 | |||
| Trihalomethanes | μg/l | 100 | RB | 5 | |||
| TOC | μg/l | Without abnormal cahnge | RB | 5 | |||
| Number of points | Intensity | Descriptive Determination |
| 0 | No smell | Era (Taste) is not dictated. |
| 1 | Very fragile taste | Eater (taste) is only dictated by people working in the lab. |
| 2 | Poor smell | Consumers can not discern if it is not known. |
| 3 | The smell that is dictated | Era and taste are dictated and may be a cause for complaints. |
| 4 | Era (Taste) clearly defined | The feeling of smell is easily dictated and can cause bad feelings to consumers (the consumer does not use it for drinking this type of water). |
| 5 | The wind (taste) is very strong | Era (taste) is of high sensitivity and water is inadequate for drinking. |
Table 3: Number of wind sensitivity threshold depending on the volume of water.
| Pattern- water with smell |
Pattern- Water without smell |
Volume of water pattern on cm3 diluted up to 200 cm3 |
Wind sensitivity threshold number |
Windshield index |
|
12,5 |
187,5 |
200 |
1 |
0 |
|
12,5 |
87,5 |
100 |
2 |
1 |
|
12,5 |
37,5 |
50 |
4 |
2 |
|
12,5 |
12,5 |
25 |
8 |
3 |
|
12,5 |
0,0 |
12,5 |
16 |
4 |
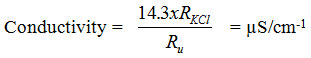
Water temperature measurement is done by immersion of the thermometer in the water and once the unchanged temperature value is achieved, the reading of the value is made. For instrument calibration use KCl solution, with 0.0100 mol dm-3 concentration at 25°C. This solution has an electrical conductivity at 25°C 1413 S cm-1 and is suitable for calibration to most of the water when using a constant-sized dipstick of 1-2 cm-1. If the measurement of the standard solution of KCl (RKCl) and the water being analyzed (Ru) is carried out at the same temperature, then the water conductivity analyzed at 25°C is equivalent to the expression:
pH value
Most natural waters have a pH value of 4.5-8.5 and these values, the most accurate determination of the pH value, is achieved by potentiometric measurements with the help of the glass electrode as the indicator electrode and the saturated electrode of the colomel . This pH measurement system is based on the fact that the pH change for one unit causes the electrical potential to change to 59.1 mV at 25°C.
Water Hardness
Water hardness, derived from dissolved salts of calcium and magnesium. Calcium and magnesium are found in natural waters, mainly in the form of bicarbonates, sulfates and chlorides:
Ca(HCO3)2 = CaCO3 + CO2 + H2O
During the water analysis, general and transitional hardness is determined, and permanent strength is calculated as the difference between the two. Water hardness is expressed in mg CaCO3 / dm3 water. The water affinity can be classified into several groups, but the measurements we make with the German units. Calculation:
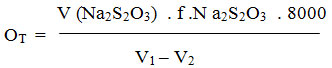
V – the volume of Na2S2O3 spent on titration
F – the Na2S2O3 digestion factor
N – the normality of Na2S2O3
V1 – the volume of whisker bottle
V2 – the volume of reactants such as. 5 ml HCl.
Bacteriological parameters of water quality
During the monitoring of bacterial water treated, these parameters are defined:
Total number of coliform bacteria; (Esheria-kernel bacteria) – incubated at 37ºC;
nourishing terrain – Violet Red Bile -Agar.
coliform bacteria with fecal origin; ground nutrition – m – Endo Agar – Less.
Total number of aerobic arsophilic bacteria; nourishing terrain – Total plate count agar.
Results and Discussions
This research presents the findings of the study including analysis and interpretation of the data analyzed. The data is presented in the table and interpreted by following the order of response to specific problem questions.
Table 4: Physico-chemical analyzes of untreated water and water treated average January 2017
| Parametrat | Njësia | H- 1 | H- 2 | H- 3 | H- 4 | H- 5 | Avg. | Max. | Min. |
| Water temperature | 0C | 10.5 | 10.1 | 9.7 | 9.2 | 9.1 | 9.72 | 10.5 | 9.1 |
| Smell | – | less |
less |
less | less |
less |
– | – | – |
| Flavor | – | — | — | — | — | – | – | – | – |
| Turbidity | NTU | 1.9 | 1.95 | 2.02 | 2.1 | 2.14 | 2.022 | 2.14 | 1.9 |
| Color | Sh. Co-Pt | less |
less |
less | less | less | – | – | – |
| Value of pH | 7.85 | 7.84 | 7.83 | 7.86 | 7.86 | 7.848 | 7.86 | 7.83 | |
| Sulfates | mg/dm3 | 21 | 21.5 | 21 | 22 | 21.5 | 21.4 | 22 | 21 |
| m-alkaline | 22 | 22.5 | 22.5 | 22 | 22.5 | 22.3 | 22.5 | 22 | |
| Total hardness | 0 Dh | 7.56 | 7.28 | 7.42 | 7.56 | 7.56 | 7.476 | 7.56 | 7.28 |
| Electricity invasion | μ/cm | 241 | 235 | 231 | 239 | 237 | 236.6 | 241 | 231 |
| Waste dried | mg/dm3 | 144.6 | 141 | 138.6 | 143.4 | 142.2 | 142 | 144.6 | 139 |
| Dissolved oxygen | mg/dm3 | 10.6 | 10.5 | 10.1 | 9.8 | 9.8 | 10.16 | 10.6 | 9.8 |
| Free chlorine | mg/dm3 | – | – | – | – | – | – | – | – |
| Chlorides | mg/dm3 | 6.38 | 6.02 | 6.38 | 6.02 | 6.02 | 6.164 | 6.38 | 6.02 |
| Expense of KMnO4 | mg/dm3 | 6.63 | 6.79 | 6.32 | 6.63 | 6.32 | 6.538 | 6.79 | 6.32 |
| Ammoniacal NH4 + | mg/dm3 | 0.19 | 0.21 | 0.18 | 0.17 | 0.16 | 0.182 | 0.21 | 0.16 |
| Nitrates | mg/dm3 | 1.45 | 1.55 | 1.59 | 1.57 | 1.54 | 1.54 | 1.59 | 1.45 |
| Nitrites | mg/dm3 | 0.009 | 0.008 | 0.008 | 0.008 | 0.008 | 0.008 | 0.009 | 0.01 |
| Iron | mg/dm3 | 0.23 | 0.22 | 0.19 | 0.21 | 0.22 | 0.214 | 0.23 | 0.19 |
| Manganese | mg/dm3 | 0.085 | 0.08 | 0.075 | 0.08 | 0.08 | 0.08 | 0.085 | 0.08 |
| Phosphates | mg/dm3 | 0.95 | 0.93 | 0.9 | 0.87 | 0.85 | 0.9 | 0.95 | 0.85 |
| Aluminum | mg/dm3 | 0.08 | 0.082 | 0.084 | 0.082 | 0.08 | 0.082 | 0.084 |
0.08 |
The following tables will show the researched results in Lake Radoniq about water resources management and management. The analyzes used in this topic are: physical-chemical analysis of water at five levels of Lake Radoniqi.
Table 5: Physico-chemical analyzes of untreated water and treated water mean January 2018
| Units | Max. Value allowed | Results of water on S.F | ||
| Parameters | Units | Drink water | Unproduced water | Produced water |
| Water temperature | 0C | 8 deri 12 | 5.1 | 6.2 |
| Smell | – | without | without | without |
| Flavor | – | without | – | without |
| Turbidity | NTU | 1,2-2,4 | 2.7 | 0.29 |
| Color | Scale Co-Pt | 10*-20* | without | without |
| Value of pH | 6,8-8,5 | 7.64 | 7.56 | |
| Sulfates | mg/dm3 SO4-2 | 200 | 18 | 19 |
| m-alkaline | – | 22 | 21 | |
| Total hardness | 0dH | 30 | 7.14 | 7 |
| Electricity invasion | μ/cm | 500-1500 | 202 | 211 |
| Waste dried | mg/dm3 | 1000 | 121.2 | 126.6 |
| Dissolved oxygen | mg/dm3 O2i tr. | <5 | 10.5 | 11.2 |
| Free chlorine | mg/dm3 Cl2 | 0,2-0,5 | – | 0.53 |
| Chlorides | mg/dm3 Cl– | 200-250 | 3.84 | 4.6 |
| Expense of KMnO4 | mg/dm3KMnO4 | 12-Aug | 4.74 | 3.79 |
| Ammoniacal NH4 + | mg/dm3 NH4+ | 0,10 | 0.12 | 0.07 |
| Nitrates | mg/dm3 NO3 | 10 | 1.48 | 0.89 |
| Nitrites | mg/dm3 NO2 | 0,005 | 0.007 | 0.0035 |
| Iron | mg/dm3 Fe | 0,3 | 0.19 | 0.06 |
| Manganese | mg/dm3 Mn | 0,05 | 0.07 | 0.03 |
| Phosphates | mg/dm3 PO4– | 3,0 | 0.51 | 0.06 |
| Aluminum | mg/dm3 Al | 0,2 | 0.06 | 0.09 |
Table 6: Average physico-chemical analysis of water treated in the supply network -2018.
| Parameters | Units | Values max. Allowed in drinking water | Water supply network |
| Water temperature | 0C | 8 to 12 | 6.5 |
| Smell | – | Without | Without |
| Flavor | – | without | without |
| Turbidity | NTU | 1,2-2,4 | 0.27 |
| Color | Scale Co-Pt | 10*-20* | Without |
| Value of pH | – | 6,8-8,5 | 7.68 |
| Sulfates | mg/dm3 SO4-2 | 200 | 21 |
| m-alkaline | – | – | 21.5 |
| Total hardness | 0dH | 30 | 7.14 |
| Electricity invasion | μ/cm | 500-1500 | 245 |
| Waste dried | mg/dm3 | 1000 | 144.6 |
| Dissolved oxygen | mg/dm3 O2i tr. | <5 | 11.1 |
| Free chlorine | mg/dm3 Cl2 | 0,2-0,5 | 0.32 |
| Chlorides | mg/dm3 Cl– | 200-250 | 6.38 |
| Expense of KMnO4 | mg/dm3KMnO4 | 12-Aug | 3.31 |
| Amoniacal NH4+ | mg/dm3 NH4+ | 0,10 | 0.06 |
| Nitrates | mg/dm3 NO3 | 10 | 0.87 |
| Nitrites | mg/dm3 NO2 | 0,005 | 0.002 |
| Iron | mg/dm3 Fe | 0,3 | 0.03 |
| Manganese | mg/dm3 Mn | 0,05 | 0.02 |
| Phosphates | mg/dm3 PO4– | 3,0 | 0.05 |
Table 7: Average of the results of the bacteriological analyzes of untreated and treated water for 2018.
| No. | Cfu | Bacteriological examination | Water untreated | Water during treatment (flocculation-coagulation) | Handled water |
| Rate | ResultCfu / ml | ResultCfu / ml | ResultCfu / ml | ||
| 1 | Total number of coliform bacteria in 100 ml. | 010 ose 5100 ose 10 | 70 | 20 | 0 |
| 2 | Folical coliform bacteria in 100 ml | 0 | E- coli | E- coli | 0 |
| 3 | Total number of mesophilic aerobic bacteria. | 1010030 | 80 | 30 | 0 |
Conclusion
Radoniq Lake water quality is influenced by natural factors and human activity in the watershed area. The results of the study confirm that the objectives were focused on the problem of drinking water treatment and feasible. The key parameters for water quality are assessed in accordance with WHO recommendations.
These parameters are evaluated for water at five different levels of the lake, for water prior to treatment, during treatment and post-treatment phases as well as in the supply network. This information is useful to change the level of water intake from the most appropriate layer according to seasons and climatic conditions. The average water temperature varies from 9.72 oC from the bottom to the lake surface and there are no significant changes from one year to the next.
During 2018, the average turbulence at five levels of the lake fluctuated at the 2,022 NTU interval. The average pH values are above 7 and do not differ during the year or year to year. Electrical conductivity ranges from 7.848 μS / cm-1. During 2018 the average oxygen value dissolved at different depths of the lake results to be 10.16 mg / l.
The expenditure of KMnO4 can be considered as a measure of the content of organic substances in water. The KMnO4 Expense Values range from 6.79 to 6.32. The content of Fe is low. The highest values are 23 mg / l water. For phosphorus the highest values are 0.95. The average nitrites in five levels fluctuate to about 0.008 mg / l. The bacteriological parameters analyzed in the treated water as well as in the supply network water do not present the presence of bacteria (total coliform bacteria, coliform bacteria of fecal origin, or Esherichio coli).
Recommendations
Adopting as soon as possible the National Strategy for Drinking Water in the Municipality of Gjakova. Completion of the legal basis for water and its harmonization with the European Union Directives:
Promotion of sustainable use of water resources;
Construction of wastewater treatment plants;
Setting up measures for saving water in all sectors;
Maintenance and expansion of the water supply and sewerage system;
Increased cooperation and information between central and local institutions;
Realization of scientific research in the field of waters, especially in the exploration of underground water resources;
Raising the level of awareness and education for the sustainable protection and use of water resources;
Measure as accurately the water produced and consumed;
Detecting illegal connections;
Best network maintenance;
Expanding the network;
Further development of the management information system;
Further development of the Office of Customer Relationships.
Reference
- Dakonta. (2009). Consulting services for Environmental Assessment and Remedial Action Plan for Mitrovica Industrial Park, Kosovo, UNDP.
- Damek-Poprawa, M. & Sawicka-Kapusta, K. (2003). Damage to the liver, kidney, and testis with reference to burden of heavy metals in yellow-necked mice from areas around steelworks and zinc smelters in poland. Toxicology, 186(1-2), 1-10.
CrossRef - Davis Jr, K. B. & McEntire, M. E. (2006). Comparison of the cortisol and glucose stress response to acute confinement and resting insulin like growth factor-concentrations among white bass, striped bass and sunshine bass. Aquaculture America Book of Abstracts pg. 79.
- Dreshaj, A. (2014). Product Quality Management and Environmental Impacts in Business, Pristina. Olymp; ISBN, 978-9951-635-32-5.
- Ferguson, HW. (1989). Systemic pathology of fish: a text and atlas of comparative tissue responses in diseases of teleosts. Iowa State University Press, Ames, IA, 263p.
- Dreshaj, A. (2013). Doctorate: Study chemical – environmental watershed White Drin and Ibar in Kosovo. University Tirana www.fshn.edu.al.
- Daci, N. (1978). Organic Chemistry, University Natural Sciences Pristina: 04nr.413-235/80.
- Lajçi, A. & Kalaj, V. (1998). Chemistry, University of Pristina, Faculty of Natural Sciences. Nr .177/28 (1997).
- Qullaj, A. (2010). Environmental Chemistry, University of Tirana, Faculty of Natural Sciences, ISBN: 978-99927-0-562-9.
- Shehu, E. (2006). Basics of Chemical and Environmental Technology, Tirana University of Tirana, Faculty of Natural Sciences: ISBN 99927-931-3-9.
- Veseli, B. (2015). Environmental impact of emission of harmful substances in air quality in Republic of Kosovo. PhD studies.

This work is licensed under a Creative Commons Attribution 4.0 International License.
![]()
A New Edition of Web of Science
Journal Impact Factor
2022: 0.5
Five Year: 0.8
Journal is Indexed in

Cabells Whitelist
![]()


