Study of Dissolved Copper(II) Speciation at Coastal Water of Peninsular Malaysia
Edrianna Godon1, Khairul Nizam Mohamed1,2 , Mohamad Azrul Gani1,2 and Shamsuddin Johan1,2
1Department of Environmental Sciences, Faculty of Environment Studies, Universiti Putra Malaysia.
2Environmental Forensic Research Unit(ENFORCE), Faculty of Environmental Studies, Universiti Putra Malaysia, 43400 UPM Serdang, Selangor, Malaysia.
Corresponding Author E-mail: k_nizam@upm.edu.my
DOI : http://dx.doi.org/10.13005/ojc/3404021
Article Received on : 01-07-2018
Article Accepted on : 21-07-2018
Article Published : 13 Aug 2018
Samples from Perhentian and Pangkor Island Marine Park, Peninsular Malaysia were analyzed for Cu(II) speciation by using CLE-AdCSV. Northeast monsoon effect was studied in Perhentian and compared with Pangkor. Excess concentration of CuL found for all stations in both islands showed >99.5% of total dissolved Cu (dCu) was bound to Cu (II) complexing ligands. The log K’CuL>12 data indicated the presence of strong natural ligands (L1) in Perhentian Island. Lower log K’ (log K’=10 to 12) and two types of ligands (L1 and L2) were found in Pangkor Island. The ratio of CuL/dCu was analysed to see the ligand distributions, and saturation rate with dissolved Cu. Statistical analysis showed weak relationship between the in-situ parameters to log K’ values (p>0.05). The log K’CuL (PP: 12.00-12.96, PG: 10.93-12.840) data suggested that the dissolved Cu are used by marine organisms, thus preventing the free Cu2+ ions to be produced.
KEYWORDS:Cu Speciation; Cu Toxicity; Northeast Monsoon; CLE-AdCSV; South China Sea
Download this article as:| Copy the following to cite this article: Godon E, Mohamed K. N, Gani M. A, Johan S. Study of Dissolved Copper(II) Speciation at Coastal Water of Peninsular Malaysia. Orient J Chem 2018;34(4). |
| Copy the following to cite this URL: Godon E, Mohamed K. N, Gani M. A, Johan S. Study of Dissolved Copper(II) Speciation at Coastal Water of Peninsular Malaysia. Orient J Chem 2018;34(4). Available from: http://www.orientjchem.org/?p=48291 |
Introduction
Metal speciation has long been studied1, where many studies were done specifically for Cu, since it has both nutrient and toxic effects on microorganisms.2-9 Copper speciation analysis is necessary in order to understand its reactivity in the environment, such as its toxicity and biological availability, as well as the geochemical behavior of its species. Dissolved copper has the role as both micronutrients for growth and toxicant to phytoplankton and microorganisms in natural waters.10, 11 Free cupric ion (Cu2+) has been shown to be toxic at concentrations as low as 10-12 M to marine phytoplankton.10,12 The Cu2+ ions become toxic to phytoplankton by affecting the uptake sites for micronutrients such as Zn2+ and Mn2+. Thus, measuring the organic complexation of trace metals, rather than the ‘‘total dissolved’’ analysis is an exceedingly important component and give more realistic information on trace metal bioavailability and toxicity.
Complexation of a metal cation by organic ligands can decrease its toxicity by decreasing the metal’s free ion concentration.12 However, a pH decrease may reduce copper binding by organic ligands through enhanced competition for ligand binding sites between protons and copper, therefore making copper more bioavailable and consequently toxic to marine organisms.13 It has been predicted that the increase for the free form of copper under a scenario reaching pH 7.5 will be as high as 30%. It is also thought that Cu(II) will be more toxic in estuarine water, due to the much lower pH that these environments will experience.
Latest study by Gledhill et al.14 highlighted the effect of pH to Cu speciation, where decreased pH resulted in inability of natural ligand pool to compete and form a complex, since the complexation of natural ligands were strongly affected by the changes in pH. However, this study was done in a simulation laboratory, where the pH range was controlled. Previously, dissolved trace metals in seawater samples were done in Peninsular Malaysia by Adiana et al.15 and Godon and Mohamed,16 where their findings suggested comparable range of dissolved trace metals concentrations with effects from the Northeast monsoon in Terengganu coastal area. Unfortunately, no speciation data reported for both studies. The main concern about changes in trace metal speciation is that a monsoon event could alter water physical-chemical parameters and might be resulting to a proportion of the free dissolved forms of toxic metals or essential trace metals bioavailable forms. The seasonal monsoon event, resulting to the chemical changing in coastal water, especially dissolved oxygen, salinity and pH.16 These changes would influence a biogeochemistry cycle of trace metal, which is influenced strongly by their chemical speciation. Any changes in pH generally affected the fraction of free ionic forms14 especially of those metals that form strong complexes with OH– and CO3-2 ions (e.g., Cu (II)).13 Since it was reported that the concentration of dissolved oxygen (DO) and pH level changed during monsoon season, the complexation of metals in the water column might also be affected by the changes.
Speciation studies have been conducted in neighboring countries such as in Singapore,17 East China Sea18 and Bohai Sea, China.19 As part of the GEOTRACES program, it had been reported that the Cu speciation in southern Yellow Sea, China are massively affected by twebstrerhe in-situ primary production, while in Bohai Sea, the chelating ligands are contributed from the fluvial discharge.19 Meanwhile in Gullmar Fjord, Sweden, Croot20 reported the Cu speciation was dominated by >99.8 % organic complexation and that the seasonal cycle contributed to the strong binding ligands, log K, in the study area. Studies have reported the relationship between the excess ligands with Cu speciation21-23 and the strong ligand-producer phytoplankton such as Synechoccocus23 in Sargasso Sea. However, lack of speciation studies in Malaysia, which experiences monsoon system, have triggered the needs to conduct such research as an approach to monitor the ecosystem health at coastal water. Most researches conducted in Malaysia were focus in dissolved metals concentrations in sediment24 or aquatic species25 with shortage of studies in seawater samples themselves. ree cupric ions (During this study, we provide an initial assessments of dissolved natural organic Cu(II) binding ligands for the coastal tropical region in two Marine Parks in Peninsular Malaysia. We undertook Cu speciation measurements using electrochemical methods to determine the concentration of natural dissolved organic Cu(II)-binding ligands and the strength of their complexes, as well as the toxicity level in both areas as an indication of its ecosystem’s health for monitoring and better management in the study areas.
Materials and Method
Sampling Areas
Perhentian Island Marine Park (east coast of Peninsular Malaysia) is located at South China Sea east coast of Terengganu Malaysia, receiving the Northeast monsoon (NEM) during November to March every year.26 Meanwhile, Pangkor Island Marine Park (west coast of Peninsular Malaysia) is located in state of Perak. The island receives the Southwest monsoon from late May to September26. Since both islands receive the monsoon impact, there had been studies proving the upwelling processes, as well as the changes of pH, dissolved oxygen and salinity during monsoon,27 which might affect the complexation processes in the water column. Interestingly, both islands were gazetted as Marine Parks, which ensure protection for marine species and limited activities, however, tourism and marine activities were carried out in both island. Perhentian Island is a small island, with a size of only 15 km2 but it is one of the main island ecotourism hotspots in Malaysia with highest number of resorts and chalets28. Perhentian Island had been seen to have fewer coral reefs around the island, mainly due to the tourism activity. The same situation was also observed in Pangkor Island, where tourism effect may decrease live coral areas in Peninsular Malaysia29.
Samplings Activities
Seawater samples were collected in two series of sampling; April 2016 (PP1) and April 2017 (PP2) at Perhentian Island, Terengganu, Malaysia (Fig. 1). The seawater samples (1 L) were sampled at five different depths (3 – 30 m) at five stations (Fig. 1). The stations were located in 2 kilometres distance between each station in linear transect toward to the South China Sea. Seawater for Pangkor Island, Perak, Malaysia was collected in September 2017. Five stations were specifically chosen, before collecting seawater samples at 5 depths (3 m, 6 m, 15 m, 20 m and 30 m) at 5 selected stations. The station was located at Tanjung Terangganu (St. 1), Pangkor Laut (St.2), Tanjung Teluk Batok (St. 3) and Teluk Belanga (St. 4).
Filtration of 1 L seawater sample was carried out through 0.45μm Whatman® pore size filters (25 mm diameter, Sigma- Aldrich) fitted to filtration set that connected to a peristaltic pump. A 250 mL of filter sample was stored into a Polytetrafluoroethene (PTFE) bottles (Nalgene) for copper-binding ligand analyses which were immediately stored at 4°C for subsequent analysis. Samples for dissolved copper analyses were acidified to pH 2 using ultra clean HCl (Romil UHP grade).
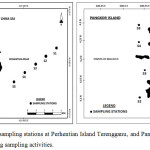 |
Figure 1: Location of our sampling stations at Perhentian Island Terengganu, and Pangkor Island Perak, Peninsular Malaysia during sampling activities. |
Bottle Washing and Reagents
A 1 L Low-Density Polyethylene (LDPE) bottle was used to sample all the seawater from van dorm on the boat. All the bottle samples and equipment during this study have been cleaned according to a standard protocol.30 Sample bottles were thoroughly rinsed with Millipore; (N 18.2 mΩ cm−1) and then seawater before filling completely.
An aqueous solution of 0.01 M SA (salicylaldoxime) was prepared in 0.1 M HCl and functioned as the added ligand to measure the concentration of natural ligand in the sample. SA solution was stable for a period of at least 8 weeks in 4°C. Copper standard solution (10-6 M) (Merck, SpectrosoL grade) was prepared in 0.01 M HCl to be added in the samples with ligand. Stock solutions of 1.5 M boric acid (final concentration 0.01 M); pH buffer (8.05) were prepared and cleaned prior to use by the addition of 0.02 M of 2-(2-Thiazolylazo)-p-cresol (TAC) with subsequent removal of TAC and Fe(TAC) using a C18 column (SepPak, Whatman).31
Instrument and Equipment
A Metrohm Model VA 797 automated hanging mercury drop electrode (HDME) was used throughout the analysis. The reference electrode was Ag/AgCl, saturated AgCl, 1 M KCl, and a platinum wire as the counter electrode. The drop surface area of the HDME was 0.45 mm2. A rotating PTFE rod was used to stir the solutions during the deposition step. Scans produced during complexing ligand determinations were transferred to a Lenovo computer by using a serial link and the evaluations of peak heights were carried out using a software program (VA 797 Computrace).
Total Dissolved Cu Analysis
UV-irradiation was applied to the acidified sample for 4.5 minutes for total copper determination. After cooled to room temperature, 10 ml of sea water sample was pipetted into the voltammetric vial; 100 μL borate buffer (pH 8.05, final concentration 0.01 M) and 20 μL SA (final concentration 25 μM SA) were added. Next, 100 μL of Cu standard solution (10-6 M) (Merck, SpectrosoL grade) was added thrice during the standard addition step. Oxygen was eliminated from the samples by deaeration for 500 s with dry nitrogen gas. Subsequently, a fresh mercury (Hg) drop was used to adsorb the total Cu in the sample (Hanging Mercury Drop Electrode, HMDE) at an applied potential of -0.1 V for 120 s, while the sample was stirred. Upon completion, the stirrer was then stopped and by using the differential pulse mode from -0.9 V to -0.01 V at 0.04 s pulse time, the potential was scanned, and the stripping current from the adsorbed Cu was swept.
Natural Organic Cu(Ii)-Binding Ligands Analysis
Determination of natural organic copper (II)-complexing ligands in seawater was performed by using competitive ligand exchange–adsorptive cathodic stripping voltammetry (CLE–AdCSV). The equipment consisted of a static mercury drop electrode (Metrohm Model VA797), a double-junction Ag/saturated AgCl reference electrode with a salt bridge containing 3 M KCl, and a counter electrode of glassy carbon. Millipore; N 18.2 mΩ cm−1 was used to prepare aqueous solutions. Labile copper concentrations in seawater samples were determined by CLE–AdCSV with salicylaldoxime (H2SA)32 as a competing ligand. A 250 mL of frozen seawater sample (in PTFE bottle) was defrosted at room temperature in the laboratory. About 120 mL of the seawater sample was added with 0.8 mL of 0.01 M borate buffer and left for an hour before the addition of 20 μL of 25 μM SA. Then, 11 sub-samples were prepared by pipetting 10 mL of seawater into 11 FEP bottles before adding the Cu standard in increasing concentrations (0–35 μM).
The subsamples were left to equilibrate overnight to ensure all reactions had taken place between Cu and added Salicylaldoxime (SA) in the sample. It is possible to equilibrate the samples for a longer period, but adsorption onto the container walls might increase the amount of metal lost with time, so it is better not to leave it too long. Titrations were analysed only once after an overnight equilibration (6 h is sufficient for equilibration), since shorter equilibration time will also affect the complexation process.32 The titrations were used to determine the concentration of natural metal-complexing ligands (L) and their conditional stability constants (K’CuL), by utilizing a ligand competition approach.
Theory: Determination of Complexing Ligand Titrations and Calibration of Copper Complexes Stability With SA
The linearization procedure to evaluate complexing ligand concentrations and conditional stability constants from the titration data has been described before.33 Briefly, the following relationship is used:
[Culabile] / [CuL] = [Culabile]/CL + α’ / (K’CuL) (1)
where [CuL] is the concentration of copper complexed by natural ligands L, [Culabile] is the labile copper concentration, CL, is the ligand concentration, and (K’CuL) is the conditional stability constant for the formation of CuL in sea water. The labile copper concentration is defined by;
[Culabile] = Σ [Cu(SA)x] + [Cu’] (2)
where [Cu(SA)x] is the concentration of copper complexed by SA and [Cu’] is the concentration of inorganic copper (all copper not complexed by SA or natural organic complexing ligand L.
Results and Discussion
Physicochemical Characteristics of the Water Column
Two sets of in-situ parameters data were taken from April 2016 (PP1) and April 2017 (PP2) at Perhentian Island (Table 1) and one set from Pangkor Island (PG) (Table 2). For both PP1 and PP2, these two sampling activities were conducted during transition period between both monsoon systems (Northeast and Southeast monsoon). 27 The evidence of upwelling processes in respect to the monsoon seasons had been documented in the study area34 where the seasonal changes in the water column affect the water parameters. As a result of vertical mixing carried by the winds, parameters such as temperature, salinity, pH, dissolved oxygen (DO) and nutrients.35 These changes in turn, could affect the speciation process, especially for pH and DO, since complexation depended highly on the seawater pH14 and phytoplankton need the DO for the production of ligands for complexation.36
Based on our record, the range of salinity in PP1 was 38.17 to 38.97 (Table 1), with an average of 38.37 (n=22). In PP2, the average value for salinity recorded was 31.03 (n=22) and ranged from 30.48 to 31.59 units (Table 1). This range was lower than the previous year (PP1) but still in the range for typical ocean salinity, 30-40 units34. Since PP1 and PP2 were affected by the Northeast monsoon season, the effects of the natural phenomenon were revised to explain the in-situ parameters data.
Table 1: In-situ parameters in seawater collected during April 2016 (PP1) and April 2017 (PP2) at Perhentian Island.
| ST | DEPTH (m) | SALINITY | TEMP (°C) | pH | COND(mS/cm) | DO (mg/L) | |||||
| PP1 | PP2 | PP1 | PP2 | PP1 | PP2 | PP1 | PP2 | PP1 | PP2 | ||
| 1 | 3 | 38.36 | 31.01 | 29.95 | 29.4 | 8.35 | 8.05 | 63.37 | 51.85 | 6.34 | 5.06 |
| N’102.4901, E’5.5651 | 6 | 38.68 | 30.99 | 29.31 | 29.3 | 8.35 | 8.06 | 63.44 | 51.71 | 5.65 | 4.96 |
| 15 | 38.35 | 30.88 | 30.28 | 29.5 | 7.45 | 8.07 | 63.51 | 51.75 | 4.97 | 5.13 | |
| 20 | 38.48 | 31.45 | 29.37 | 29.2 | 8.31 | 8.07 | 63.23 | 52.28 | 3.71 | 5.73 | |
| 30 | 38.45 | 31.59 | 29.34 | 29.2 | 8.28 | 8.06 | 62.29 | 52.53 | 5.48 | 5.15 | |
| 2 | 3 | 38.51 | 30.95 | 30.13 | 29.6 | 8.23 | 8.07 | 63.03 | 51.93 | 7.02 | 5.67 |
| N’102.4829, E’5.5551 | 6 | 38.34 | 30.94 | 30.15 | 29.6 | 8.36 | 8.08 | 63.49 | 51.92 | 3.54 | 5.76 |
| 20 | 37.44 | 30.93 | 29.3 | 29.7 | 8.32 | 8.08 | 62.35 | 51.98 | 4.33 | 5.44 | |
| 30 | 38.29 | 31.4 | 28.88 | 29.2 | 8.02 | 8.08 | 62.12 | 52.21 | 4.44 | 5.36 | |
| 3 | 6 | 38.44 | 30.96 | 29.58 | 29.6 | 8.25 | 8.08 | 63.43 | 51.94 | 4.85 | 5.33 |
| N’102.4753, E’5.5415 | 15 | 38.46 | 30.48 | 29.62 | 29.2 | 8.37 | 8.1 | 63.38 | 40.18 | 4.48 | 6.30 |
| 20 | 38.52 | 31.17 | 29.7 | 29.1 | 8.35 | 8.09 | 63.3 | 51.82 | 4.45 | 5.79 | |
| 30 | 38.44 | 30.95 | 29.22 | 29.8 | 7.45 | 8.08 | 62.57 | 28.7 | 4.56 | 6.43 | |
| 4 | 3 | 38.45 | 30.95 | 29.85 | 29.7 | 8.33 | 8.08 | 63.47 | 52.06 | 6.14 | 5.58 |
| N’102.4701, E’5.5320 | 6 | 38.33 | 30.95 | 29.9 | 29.6 | 8.49 | 8.08 | 63.31 | 51.89 | 4.61 | 4.75 |
| 15 | 38.17 | 30.94 | 29.97 | 29.4 | 8.37 | 8.09 | 62.97 | 51.75 | 4.74 | 5.44 | |
| 20 | 38.23 | 31.25 | 29.5 | 29.2 | 8.05 | 8.09 | 62.54 | 51.96 | 4.41 | 5.78 | |
| 5 | 3 | 38.44 | 30.97 | 30.1 | 29.8 | 8.22 | 8.09 | 63.33 | 52.15 | 4.43 | 5.71 |
| N’102.4637, E’5.5233 | 6 | 38.38 | 30.97 | 29.95 | 29.7 | 8.52 | 8.09 | 63.31 | 52.04 | 5.80 | 5.85 |
| 15 | 38.52 | 30.98 | 29.73 | 29.6 | 8.39 | 8.09 | 63.44 | 51.92 | 4.54 | 5.77 | |
| 20 | 38.52 | 30.92 | 29.83 | 29.4 | 8.24 | 8.09 | 63.26 | 51.69 | 5.32 | 5.67 | |
During the Northeast monsoon (NEM) 2015/16 period, a strong El Niño episode occurred. This episode was among the top three strongest episodes since 1979. The duration of this NEM was longer than usual, in agreement with the finding that NEMs generally last longer during El Niño episodes. NEM 2015/16 happened in line with a very strong El Niño episode, which started at early onset date on October 2015 and withdrew normally at March 2016.37 By referring to the bathymetry data from Ocean Data View (Fig 2), the salinity from PP1 and PP2 are displayed to compare the water condition during both periods.
The wind data from February 2016 NEM review showed pressure level at 850-hPa, indicating a stronger than normal northerly flow over South China Sea, Indochina and Borneo which converged over the southern South China Sea, Indian Ocean, and the southern Sarawak37 in PP1. Interestingly, a high tide phenomenon also occurred during this month at Peninsular East Coast, as reported by the Malaysian Meteorological Department and the local news. This condition would contribute to the significantly high readings on all the in-situ parameters on PP1 (April 2016), compared to the readings in PP2 (April 2017) (Fig. 2). Salinity data for PP1 showed the high salinity (38.68) (Table 1) on the upper layer compared to PP2 (30.99) as a result of high tide phenomenon, which included the mixing of the water column in the middle layer (20 m).
Significant variations were observed in pH units for PP1, with an average of 8.22 (n=22) with range between 7.45 to 8.52 unit. Meanwhile, pH ranged from 8.05 to 8.10 units (Table 1, Fig. 2) in PP2 with an average of 8.08 (n=22), giving a constant pattern in pH measurement. As the NEM 2015/16 wind promoted strong mixing and water turbulence, this might had contributed to the high pH readings in PP1, which showed unstable patterns throughout the water column (Fig. 2). In addition, the high tide phenomenon might also be the important factor for the increased pH observed in this season. Usually, pH varies with tidal cycle and conditions, where higher values are measured at high tide and low values at low tide.38 This could explain the odd readings of pH 7.45 in PP1 (Table 1). However, the pH values in PP2 indicated an acidic seawater condition, compared to PP1.
The bathymetry data for pH (Fig 2) in PP1 showed the mixing of the pH in the water column, with no consistent source as a result of the high tide phenomenon as reported by the meteorological data. Meanwhile in the data shown in PP2, a pattern was seen coming from the island from St. 5, with slightly higher pH on the surface, as a result of island input.
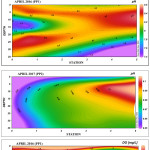 |
Figure 2: Bathymetry data for salinity, pH and DO in April 2016 PP1 and April 2017 (PP2) at five different stations. |
Variations were observed in the DO data for PP1 (Fig. 2), where the ranges were from 3.54 mg/L to 7.02 mg/L (Table 1) with a mean of 4.94 mg/L (n=22). In contrast, constant readings were recorded in PP2 (Fig. 2), from a range of 4.75 mg/L to 6.43 mg/L (Table 1), giving an average of 5.56 mg/L. For PP1, the high tide phenomenon might be the key factor in the high DO values found in our study area, where high DO was found during the high tide, and vice versa. Similar findings were recorded by Fortune and Mauraud,38 where they found the highest DO values at high tide and lowest values at low tide. These findings were comparable to Adiana et al.39; Suratman et al.40 and the Malaysian Meteorological Data reports by Sang et al.,37 The variations in DO indicated a temporal pattern since DO change with tides condition38 for PP1 and PP2. DO measured increases and decreases for each high and low tide, which also reflecting diurnal patterns. Butler and Padovan41 also observed similar complex patterns for DO, thus suggesting the probability of a number of factors may involve in determining this variability.
The DO data in PP1 showed higher concentration on the upper layer (Fig 2) as expected, since the DO is associated with solar radiation and penetration, however mixing were also shown in the middle layer of the water column, suggesting the large influence from the variation of tidal movement.38 Compared to data in PP2, the DO pattern was lower than PP1 and more complex, indicating a number of factors involving in the distribution.
Meanwhile, the conductivity data showed a constant pattern for both PP1 and PP2 (Table 1), with lower readings recorded in PP2, ranged from 28.7 mS to 52.53 mS (Table 1) with an average 50.30 mS (n=22) in the post-monsoon season. In comparison, PP1 had a higher conductivity with an average of 63.10 mS (n=22) from a range of 62.12 mS to 63.51 mS (Table 1). High turbulence and rapid mixing might affect conductivity resulted from the unusual strong wind El Niño episode and the high tide phenomenon might had contributed to this condition. Fortune and Mauraud38 reported similar findings in a review, where their conductivity data was observed to increase with high tides with peaks at strongest tide.
For Pangkor Island (PG), the salinity was found at 28.51 to 31.32 psu (Table 2), with an average of 30.71 (n=16). Salinity distribution within coastal water indicates the fluxes of fresh water from the rivers, and seawater supplied by exchange with the ocean. Salinity concentration and distribution can be affected by the tidal flows, rapid mixing of fresh and marine water, by wind and the water currents.42 In the other hand, temperature was found to be in between to 28.6 to 29.7oC, with an average of 29.5oC (n=16). Temperature is an important indicator in water quality, since it shows the trend of the temporal variation present,43 where the water currents, change in solar insulation and local hydrodynamics can cause water temperature to change.
Table 2: In-situ parameters in seawater collected during September 2017 at Pangkor Island, (PG).
| ST | DEPTH (m) | SALINITY | TEMP (°C) | pH | COND(mS/cm) | DO (mg/L) |
| 1 | 3 | 28.51 | 29.7 | 7.55 | 48.345 | 5.85 |
| N’100.5763, E’4.1814 | 6 | 30.73 | 29.5 | 7.86 | 51.496 | 5.71 |
| 15 | 31.32 | 29.4 | 7.90 | 52.262 | 6.16 | |
| 2 | 3 | 30.94 | 28.6 | 6.16 | 51.891 | 7.99 |
| N’100.5295, E’4.2026 | 6 | 30.95 | 29.6 | 8.01 | 51.938 | 6.09 |
| 20 | 30.96 | 29.6 | 8.02 | 51.981 | 6.65 | |
| 30 | 30.99 | 29.5 | 8.01 | 51.927 | 5.79 | |
| 3 | 3 | 30.83 | 29.6 | 8.03 | 51.723 | 6.66 |
| N’100.5303, E’4.2344 | 6 | 30.83 | 29.5 | 8.03 | 51.677 | 6.01 |
| 15 | 30.92 | 29.5 | 8.02 | 51.808 | 6.17 | |
| 4 | 3 | 30.28 | 29.7 | 8.04 | 51.028 | 6.07 |
| N’100.5268, E’4.2544 | 6 | 30.83 | 29.7 | 8.04 | 51.834 | 6.09 |
| 15 | 30.85 | 29.7 | 8.04 | 51.852 | 6.27 | |
| 5 | 3 | 30.77 | 29.7 | 8.06 | 51.776 | 5.94 |
| N’100.5291,E’4.2665 | 6 | 30.83 | 29.7 | 8.06 | 51.834 | 6.59 |
| 15 | 30.85 | 29.7 | 8.06 | 51.848 | 5.78 |
Constant pH was found at 6.16 to 8.06 unit (Table 2), with an average of 7.86 (n=16). Compared to the pH data in PP1 and PP2, PG data had the lowest pH range, starting at 6.16. This could be due to the shallower depth and more marine activites conducted around the island during the sampling time. DO was found between 5.71 to 7.99 mg/L (Table 2), with average 6.23 (n=16). DO production and consumption are influenced by algal and plant biomass, water temperature and light and are also influenced by seasonal variations44. Since the island had a shallower depth, increased solar radiation and penetration could influence the DO concentration in the water column.
In general, the changes in pH, salinity and DO concentration could affect the complexation processes in the water column, especially for pH parameter. Speciation is highly dependent on the water pH, thus slight changes would affect the process.14 The lower pH in PP2 and PG might influence the complexation process, as suggested by Gledhill et al.,14 since a number of ligand pool were affected by the pH of the water, while DO and salinity might affect the phytoplankton and the production of natural ligands by phytoplankton for speciation. Hence, further speciation analyses were conducted to study the effects (if any) and the results were discussed as follows.
Distribution of natural organic Cu(II)-ligands binding (CuL) in Perhentian Island (PP)
The complexation analysis for organic Cu(II)-ligands binding was carried out by using the competitive ligand exchange-adsorptive cathodic stripping voltammetry (CLE-AdCSV). The CLE-AdCSV is an indirect method, which detects an electrochemically active complex, formed between Cu and SA, organic ligand added to the sample. The measurement was made after equilibrium has been established between the competing ligand SA and naturally occurring, Cu(II)-binding organic ligands. In CLE-AdCSV, the surface-active Cu(SA)2 complex formed during the competitive equilibration is subsequently adsorbed to a hanging mercury drop electrode (HMDE) for a time period appropriate to the concentration of Cu2+, and the analytical signal obtained was the reduction current resulting from reduction of Cu(II) in the adsorbed complex to Cu (0) during the cathodic stripping step.
Recovery analysis was carried out by using 10 L surface seawater sample of the study area. From this sample, 10 bottles of 250 ml Nalgene were used to freeze the sample for recovery analysis. The results showed good agreement with all ten analyses, which ensured the accuracy of the titration method.
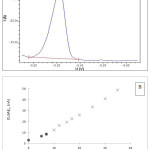 |
Figure 3: (A) Voltammogram of Cu (SA) peak under differential pulse mode from seawater sample from St. 2 (6 m depth) at Perhentian Island, Terengganu. |
Voltammetric parameters: deposition time 120s; deposition potential -1.1 V and start potential -0.15 V. (B) The current (nA) plotted versus the total amount of Cu (nM) from St. 5 (6 m depth). The first few points (black-square) of the titration indicated that about half of the natural organic complex dissociated due to the competition with the added ligand (SA). The concentration of added ligand and Cu (II) complex is directly related to the peak heights (ip) of the voltammetric measurements.
The peak potential for the copper was detected at ca. -0.32 V (Fig. 3 A), compared with a peak potential of -0.36 V found by Campos and van den Berg32 in a similar SA concentration of 25 µM. This difference might be due to the storage of the reference electrode, which is supposedly stored in KCl 3 M solution. The height of the peak was found to increase approximately linearly with the increased Cu standard addition in each titration cell (subsamples) (Fig. 3 B). The equilibration time was long (overnight), to allow slow reaction process in low concentration of free copper (excess SA complexed the added copper) and possible side-reactions of the natural complexing ligands with the major cations in the sea water might also occurred.32
The presence of an excess of the organic ligands in the seawater samples from Perhentian Island (PP) was indicated by the curvature in a plot of the measured voltammetric current (ip) versus the total Cu concentration (Fig. 3 B). The theory of the curve and the straight line had been discussed previously.31,47 Curvature is usually only observed at low Cu(II) concentrations. The curvature is an evidence for natural organic Cu(II) binding ligands complex formation with added Cu, and as the natural ligands become saturated with Cu a straight line is observed indicating that all the added Cu is being complexed by the SA added ligand.47 The function of the SA added ligands is to bind Cu(II) which is present in the seawater samples to make it detectable by AdCSV. The SA added ligand competes with the natural ligands in the sample so, if half of the Cu(II) is bound by the added ligand, the complex stability of natural ligand is about the same as that of added ligand.31,47
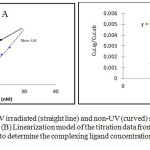 |
Figure 4: (A) Comparison of UV irradiated (straight line) and non-UV (curved) seawater sample from St.2 at Perhentian Island, Terengganu. Click here to View figure |
(B) Linearization model of the titration data from St. 5 (6 m depth) by using van den Berg linearization formula to determine the complexing ligand concentrations and conditional stability constant.
An UV irradiation seawater (UVSW) sample was used according to Campos and van den Berg14 where it functioned to remove any organic ligand present in the seawater samples. The comparison between UVSW and non-UV sample was presented in Fig 4 above. The straight line obtained in UVSW showed the non-existence of organic ligand in the seawater and Cu reacted to the added SA meanwhile in non-UV curved line showed the opposite.
The plot did not start at 0,0 intersections for the sample due to the significant concentration of natural copper in the seawater (3.7 nM) which was strongly complexed prior to the beginning of the experiment and affecting the detected concentration of complexing ligands.14 The ligand concentrations and conditional stability constants were derived from the linearized data (Fig. 4 B). The peak heights from the complexing ligand titrations as function of added copper concentration are needed to evaluate the strength of copper complexation with SA before conducting the linearization procedure. Ligand concentrations (CL) and the conditional stability constant; which will be referred here (K’CuL) are obtained by titrations method of linear least-square regression of [Culabile] / [CuL], as function of CL in accordance with the equation followed.46, 47
For Cu speciation analyses at Perhentian Island (PP), we have classified our St 1, 2 and 3 as are stations located far away from the Perhentian island (> 5 km), while St. 4 and St. 5 as are close stations to the island (< 5 km). For April 2016 (PP1), the data at St. 1 and St. 2 were unavailable for discussion due to unseen circumstances during analysis. The PP1 data showed slight variations of distribution patterns of dissolved Cu (dCu) and Cu-ligand (CuL) throughout the water column, where the concentrations were quite similar for all stations (Fig. 5) and the concentrations decreased from the surface (3 m) to the bottom layer (20 m) with dCu range between 3.12 nM to 9.61 nM (Table 3). Excess ligands were detected in all stations, giving 99.7-100% CuL binding percentage, with strong ligand present in the water (log K>12). The data for distribution of natural organic Cu(II)-ligands binding (CuL) is presented in Table 3.
The dissolved Cu (dCu) for PP1 is lower than in PP2 as shown in Table 3. The dCu range in PP1 was between 3.12 to 9.61 nM, while in PP2, the range was in 5.48 to 10.08 nM (Table 3), respectively. This result might be affected by the monsoon season which causes changes to the seawater condition, especially with the El-Nino phenomenon and longer NE 2015/2016 period, as discussed in the in-situ data above.
Meanwhile, for PP2, the dCu patterns showed a constant pattern in St. 1, St. 2 and St. 3, with a wide range of concentration pattern observed in St. 4 and 5 (Fig. 5). Interestingly, for NE 2016/2017, the NE period was shorter compared to the NE 2015/2016, where it started late in November 2016 and ended earlier in March 2017 due to the weak La-Nina influence45. This condition might had affected the dCu and CuL formations in the water column and also be the reason why similar distribution pattern was observed in St. 1 and 2 in April 2017 (Fig. 5). The pattern however was observed to be different in St. 4 and 5, which might be influenced by the island input during this period, since the monsoon effect had withdrawn. Since the stations (St. 4 and St. 5) were close to the island and the seawater was shallow in the area, benthic influence to the chelators’ production might also be the possible cause of high CuL in St 4. and 5. Skrabal et al.48 reported a large benthic source of chelators in shallow water of Chesapeake Bay that may be produced from heterotrophic bacteria, which supplied 10-50 % of the Cu-complexing ligand in the area.
Table 3: Natural organic dissolved Cu(II) speciation data in April 2016 (PP1) and April 2016 (PP2). Dissolved Cu concentration ([dCu]), total Cu binding ligand ([CuL]) and stability constant of Cu ligand (log K’) were determined, and free Cu binding-ligand([L’] = [CuL] – [dCu]) are presented.
| St | DEPTH | [dCu] | CuL | log K’ | L– | CuL | CuL/dCu | Cu2+ (M) | pCu | ||||||||
| (m) | (nM) | (nM) | (mol-1) | (nM) | (%) | (M) | |||||||||||
| St.1 | PP1 | PP2 | PP1 | PP2 | PP1 | PP2 | PP1 | PP2 | PP1 | PP2 | PP1 | PP2 | PP1 | PP2 | PP1 | PP2 | |
| 3 | NA | 5.98 | NA | 7.23 | NA | 12.10 | NA | 1.25 | NA | 100 | NA | 1.20 | NA | 3.80×10⁻²² | NA | 11.42 | |
| 6 | NA | 10.08 | NA | 10.29 | NA | 12.12 | NA | 0.21 | NA | 99.6 | NA | 1.00 | NA | 3.64×10⁻²¹ | NA | 10.44 | |
| 15 | NA | 5.48 | NA | 6.11 | NA | 12.00 | NA | 0.63 | NA | 99.8 | NA | 1.10 | NA | 8.70×10⁻²² | NA | 11.06 | |
| 30 | NA | 8.24 | NA | 8.34 | NA | 12.58 | NA | 0.10 | NA | 99.7 | NA | 1.00 | NA | 2.17×10⁻²¹ | NA | 10.66 | |
| St.2 | 3 | NA | 7.33 | NA | 7.35 | NA | 12.01 | NA | 0.02 | NA | 95.1 | NA | 1.00 | NA | 3.58×10⁻²⁰ | NA | 9.45 |
| 6 | NA | 8.61 | NA | 10.49 | NA | 12.15 | NA | 1.88 | NA | 100 | NA | 1.20 | NA | 3.24×10⁻²² | NA | 11.49 | |
| 20 | NA | 9.11 | NA | 9.62 | NA | 12.30 | NA | 0.51 | NA | 99.9 | NA | 1.10 | NA | 8.95×10⁻²² | NA | 11.05 | |
| 30 | NA | 6.60 | NA | 6.88 | NA | 12.14 | NA | 0.28 | NA | 99.7 | NA | 1.00 | NA | 1.71×10⁻²¹ | NA | 10.77 | |
| St.3 | 3 | 9.61 | 7.32 | 10.10 | 8.11 | 12.09 | 12.41 | 0.49 | 0.79 | 99.80 | 100.00 | 1.05 | 1.10 | 1.59×10⁻²¹ | 3.60×10⁻²² | 10.80 | 11.44 |
| 6 | 9.45 | 8.64 | 13.05 | 8.90 | 12.04 | 12.09 | 3.60 | 0.26 | 100.00 | 99.70 | 1.38 | 1.00 | 2.39×10⁻²² | 2.70×10⁻²¹ | 11.62 | 10.57 | |
| 15 | 5.4 | 6.39 | 12.45 | 7.94 | 12.05 | 12.53 | 7.05 | 1.55 | 100.00 | 100.00 | 2.31 | 1.20 | 6.82×10⁻²³ | 1.22×10⁻²² | 12.17 | 11.91 | |
| 30 | 7.5 | 4.66 | 8.73 | 5.96 | 12.60 | 12.09 | 1.23 | 1.30 | 100.00 | 99.90 | 1.16 | 1.30 | 1.53×10⁻²² | 2.91×10⁻²² | 11.81 | 11.54 | |
| St. 4 | 3 | 8.12 | 7.19 | 9.19 | 11.42 | 12.55 | 12.04 | 1.07 | 4.23 | 100.00 | 100.00 | 1.13 | 1.60 | 2.13×10⁻²² | 1.55×10⁻²² | 11.67 | 11.81 |
| 15 | 4.12 | 5.29 | 5.24 | 6.55 | 12.96 | 12.33 | 1.12 | 1.26 | 100.00 | 100.00 | 1.27 | 1.20 | 4.03×10⁻²³ | 1.96×10⁻²² | 12.39 | 11.71 | |
| 20 | 3.12 | 5.19 | 3.68 | 5.60 | 12.27 | 12.85 | 0.56 | 0.41 | 99.90 | 100.00 | 1.18 | 1.10 | 2.99×10⁻²² | 1.79×10⁻²² | 11.52 | 11.75 | |
| St.5 | 3 | 8.19 | 6.04 | 9.11 | 8.75 | 12.38 | 12.59 | 0.92 | 2.71 | 100.00 | 100.00 | 1.11 | 1.50 | 3.71×10⁻²² | 5.73×10⁻²³ | 11.43 | 12.24 |
| 6 | 9.23 | 11.87 | 9.37 | 13.36 | 12.31 | 12.77 | 0.14 | 1.49 | 99.70 | 100.00 | 1.02 | 1.10 | 3.23×10⁻²¹ | 1.35×10⁻²² | 10.49 | 11.87 | |
| 15 | 6.79 | 6.11 | 7.41 | 8.02 | 12.76 | 12.97 | 0.62 | 1.91 | 100.00 | 100.00 | 1.09 | 1.30 | 1.90×10⁻²² | 3.43×10⁻²³ | 11.72 | 12.46 | |
| 20 | 5.49 | 13.24 | 6.64 | 13.42 | 12.50 | 12.19 | 1.15 | 0.18 | 100.00 | 99.60 | 1.21 | 1.00 | 1.50×10⁻²² | 4.75×10⁻²¹ | 11.82 | 10.32 | |
For all stations in PP1 and PP2, dCu concentration was the highest at the middle and bottom layer (Fig 5), which might be caused by rapid mixing and strong turbulence of water current during the season. The presence of strong current velocity during monsoon can affect the metal concentrations and distributions in the water column, as well as the metals remobilization and fluxed phase in the water column.49, 50 Potential diagenetic remobilization of metals back into dissolved phase from suspended sediments might also be one of the factors contributing to the increased concentrations at the bottom layer.51 Meanwhile, the CuL concentrations were always in excess to the dCu (Fig. 5).
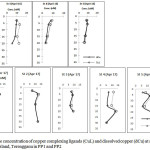 |
Figure 5: The concentration of copper complexing ligands (CuL) and dissolved copper (dCu) at all stations at Perhentian Island, Terengganu in PP1 and PP2. |
Distribution of natural organic Cu(II)-ligands binding (CuL) in Pangkor Island
The speciation analysis for Pangkor Island Marine Park (PG) was conducted to study the current status of Cu complexation in the area (west cost of Peninsular Malaysia) and compare the data in Perhentian Island Marine Park (PP). In this study, Cu speciation and its distribution data are displayed in Table 4 and Fig 6. Constant dCu and CuL distribution patterns were observed in Fig 6. The lowest concentration of dissolved Cu (dCu) was detected in St.1 (6 m), with 2.09 nM (Table 4), while the highest dCu was found at St.2 (15 m) with 9.11 nM (Table 4). In general, the dCu range was between 2.09 nM to 9.11 nM. Excess Cu-complexing ligand, CuL, was found at all stations with wide concentration range between 4.05 nM to 13.70 nM.
Table 4: Cu speciation data at Pangkor Island (PG). Dissolved Cu concentration ([dCu]), total Cu binding ligand ([CuL]) and stability constant of Cu ligand (log K’) were determined, and also the free Cu binding-ligand ([L’]) = [CuL] – [dCu].
| St | Depth(m) | [dCu] | CuL | log K’ | L– | CuL | CuL/dCu | Cu2+ (M) | pCu |
| (nM) | (nM) | (mol-1) | (nM) | (%) | (M) | ||||
| 1 | 3 | 3.41 | 4.41 | 11.93 | 1.00 | 99.88 | 1.29 | 4.0064×10⁻²² | 8.83 |
| 6 | 2.09 | 4.05 | 12.08 | 1.96 | 99.96 | 1.94 | 8.86932×10⁻²³ | 9.04 | |
| 15 | 3.10 | 8.59 | 12.10 | 5.49 | 99.99 | 2.77 | 4.48528×10⁻²³ | 8.87 | |
| 2 | 3 | 6.40 | 13.25 | 11.67 | 6.85 | 99.97 | 2.07 | 1.99751×10⁻²² | 8.56 |
| 6 | 4.20 | 4.81 | 12.66 | 0.61 | 99.96 | 1.15 | 1.50633×10⁻²² | 8.74 | |
| 20 | 9.11 | 11.14 | 12.84 | 2.03 | 99.99 | 1.22 | 6.48668×10⁻²³ | 8.40 | |
| 30 | 5.81 | 13.70 | 11.19 | 7.89 | 99.92 | 2.36 | 4.75444×10⁻²² | 8.60 | |
| 3 | 3 | 7.12 | 9.00 | 12.17 | 1.88 | 99.96 | 1.26 | 2.56048×10⁻²² | 8.51 |
| 6 | 5.34 | 6.24 | 12.36 | 0.90 | 99.95 | 1.17 | 2.58999×10⁻²² | 8.63 | |
| 15 | 6.37 | 9.28 | 10.93 | 2.91 | 99.60 | 1.46 | 2.57185×10⁻²¹ | 8.56 | |
| 4 | 3 | 4.30 | 8.55 | 11.73 | 4.25 | 99.96 | 1.99 | 1.88399×10⁻²² | 8.73 |
| 6 | 5.31 | 5.48 | 12.46 | 0.17 | 99.80 | 1.03 | 1.08304×10⁻²¹ | 8.64 | |
| 5 | 3 | 4.29 | 7.74 | 11.55 | 3.45 | 99.92 | 1.80 | 3.5046×10⁻²² | 8.73 |
| 6 | 4.61 | 6.22 | 11.58 | 1.61 | 99.84 | 1.35 | 7.53139×10⁻²² | 8.70 | |
| 15 | 5.22 | 5.90 | 12.27 | 0.68 | 99.92 | 1.13 | 4.12251×10⁻²² | 8.64 |
For St.1, 2 and 3, which were located far from the island, the dCu concentrations were high at the surface (3 m depth), before decreasing at the middle layer (6 m) depth. This was related to the uptake processes by the phytoplankton in the water column, as discussed by Trevors and Cotter51. In surface layer, strong Cu-binding ligands were produced by the phytoplankton and other marine organisms present in the water column for the uptake processes52. In contrast, the dCu concentration in St.4 and 5 was found to be higher in the middle layer, which was related to the island input, since these two stations were located near the island.
The conditional stability constant (log K’), which indicates the binding strength between Cu and complexing ligand, showed the presence of both strong, L1 and weak, L2 ligand class. 53The strong ligand was widely defined to have a log K’>12.00, while the weak would have log K’<12.00. Each station showed both strong and weak ligand buffering capacity, with the lowest log K value found at St.3 (15 m) with 10.93 (Table 4), while the highest was found at St. 2 (15 m) with 12.84 (Table 4). The log K’ values are important indicator, as it shows the binding strength between the dissolved Cu and also the ligand present. The strong Cu-ligand complex would prevent the free Cu2+ in the water column. In every station, the surface layer had lower log K’ values, compared to the higher values found in the middle layer. As suggested by Croot,20 the phytoplankton species present in the water column is an important factor of the Cu-complexing ligand produced. However, the lack of data for phytoplankton species in the study area is limiting this study to make further suggestions on the phytoplankton species present.
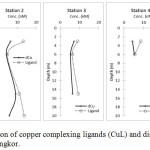 |
Figure 6: The concentration of copper complexing ligands (CuL) and dissolved copper (dCu) at all stations at Pulau Pangkor. |
The saturation state of Cu-organic ligands was found with ratio range between 1.03 to 2.77 (Table 5). This indicated the low capacity of buffering ligands to bind to dissolved Cu inputs. The findings in this study was found comparable to Thuro´czy et al.54 The measured pCu values (10.59 to 12.35 M) were found to be in comparable to other coastal studies.19 The pCu values were measured for Cu lability and mobility in the water, where it reflected the Cu uptake and toxicity to marine organisms. The calculated pCu in this study showed low Cu toxicity, due to the low free Cu2+ ion in the study area. This indicated that dissolved Cu functions in bioavailability, rather than toxic in the area.
Cu(II) Speciation in Malaysia Coastal Water
The speciation analysis was carried out twice in Perhentian Island (PP1 and PP2) to study the possible effect of the Northeast monsoon in the area, calculated in the log K’ values as suggested by Gledhill et al.14 Based on the results collected, changes in distribution and concentration were seen between the two samplings, where the Northeast monsoon affected the physiochemical properties in the water column (Fig. 2). Next, one similar analysis was done in Pangkor Island (PG), to compare the seawater condition between the two Marine Park sites before the results were compared to other studies in coastal areas to discuss the findings. In the previous study by Gledhill et al.14, the small changes in pH values caused major differences in the log K’ calculations. The wide range of pH (6.16-8.06) found in this study also showed the similar result seen in Gledhill et al.14 Statistical analysis was carried out (regression analysis and Pearson’s correlation) for all three pH, DO and salinity data. However, the results showed weak relationship to the log K’ values (p> 0.05). Other factors, such as phytoplankton species and the natural ligand productions might had affected the results and more studies are required in the future to help us understand the relationship.
For detail Cu(II) speciation discussion in both our sampling areas (PP and PG), a simplified table by using range was applied for discussion due to the lack of data and for clear comparison in Table 5. In this study we have analysis two series of samplings in Perhentian island (PP1 and PP2) in order to identify the possible effect of Malaysia’s climate (Northeast monsoon) to the Cu speciation distribution. In fact, there was a strong El Niño episode occurred in the area during the Northeast monsoon (NEM) 2015/16 period59 during the PP1 sampling, but not in PP2. The El Niño caused the Northeast monsoon to be longer than59 and in turn, affecting the water condition by releasing of some metals from the suspended particulate materials which led to re-suspension of surface sediment due to the strong current velocity39 and influenced the metal remobilization in the water column.50
Besides that, we also determined the role of physical chemical parameters (pH or salinity) on log K’ value of Cu speciation by comparing its distribution between two different sides; east coast (Perhentian island, PP) and west coast (Pangkor island, PG) of Peninsular Malaysia.
Table 5: Simplified table for Cu speciation data at Pulau Perhentian, Terengganu in April 2016 (PP1), April 2017 (PP2) and Pangkor Island (PG). Dissolved Cu concentration ([dCu]), total Cu binding ligand ([CuL]) and stability constant of Cu ligand (log K’) were determined, and also the free Cu binding-ligand ([L’]) = [CuL] – [dCu].
| Sampling | Salinity | pH | [dCu] | [CuL] | log K’ | [L–] | CuL | CuL/dCu | [Cu2+] | [pCu] |
| site | (ppt) | (nM) | (nM) | (mol-1) | (nM) | (%) | (M) | (M) | ||
| PP1 | 37.44-38.68 | 7.45-8.52 | 3.12-9.61 | 3.68-13.05 | 12.04-12.96 | 0.49-7.05 | 99.7-100 | 1.05-2.31 | 6.82×10⁻²³ – 3.23×10⁻²¹ | 10.49-12.39 |
| PP2 | 30.92-31.59 | 8.05-8.10 | 5.48-10.08 | 6.11-10.29 | 12.00-12.58 | 0.10-4.23 | 95.1-100 | 1.00-1.60 | 5.73×10⁻²³ – 3.58×10⁻²⁰ | 10.44-11.42 |
| PG | 28.51-31.32 | 6.16-8.06 | 2.09-9.11 | 4.05-13.70 | 10.93-12.84 | 0.17-7.89 | 99.60-99.99 | 1.03-2.77 | 8.86×10⁻²³ _ 2.57×10⁻²¹ | 8.40-9.04 |
For both PP1 and PP2 data, crucial parameters in Table 5 (salinity and pH) clearly showed large differences in values, especially in PP1, which showed a large range of data in the in-situ parameters readings compared to PP2 and PG. This was due to the unstable condition because of the monsoon and high tide phenomenon, shown by the salinity values, which was higher in PP1 (38 ppt) compared to PP2 (31 ppt). In PP1, the unstable condition might had affected the odd pH readings in the area, leading to a lower pH value (7.45 unit) compared to PP2 (8.05 unit). In theory, lower pH leads to lower log K’ values, as a result of reduced complexation capacity by natural ligands calculated in log K’ values14. However, based on the excess L– data, the higher concentration of free ligands was found in PP1 (0.49-7.05 nM), compared to PP2 (0.10-4.23 nM) (Table 5). Then the saturation ratio (CuL/dCu) in PP1 was also higher (2.31) compared to PP2 (1.60), which explained the higher excess ligand concentration. The pCu value was also higher in PP1 (12.39 M), which explained the higher rate of free Cu2+ production, as a result of non-complexed Cu-ligands. This could suggest that the lower pH in PP1 compared to PP2 was not necessarily against the previous suggestion14 but perhaps other factors such as existence of strong ligand producer had influenced the higher log K’ values compared to PP2.
The saturation state of Cu-organic ligands can be identified by using the CuL/dCu ratio (Table 5). Thuro´czy et al54 stated that a low ratio (close to 1) indicated a saturated ligand-metal complexation and the probability of low capacity of the ligands to bind and buffer any extra metal input, whereas high ratio (more than 1) can increase the metal solubility and keep metal in dissolved phase, since the ligand pool is unsaturated and able to buffer extra metal input. An enhanced ratio indicates a relatively large excess of ligands where external inputs of metal would be readily complexed by ligands. The CuL/dCu ratios calculated (Table 5) showed consistent pattern with depth and location. For both PP1 and PP2, the ratios were in low ranges (PP1:1.02-2.31, PP2:1.00-1.60), especially in PP2. This could indicate a saturated Cu-ligand complexation in the areas (Perhentian Island), as stated in previous work by Thuro´czy et al57 . In his study, Thuro´czy57 found a low ratio (1-2) at the surface ocean, and found higher ratio (4-13) at ~50 m depth. Similar ratio range was found in this study, where areas usually had ratio < 2.5, and approximately constant with depth. These findings were then supported by the low excess ligand (L–) found in the study area (Table 4 and 5). The concentration of excess ligand ([L–] = [CuL] – [dCu]) showed the concentration of free Cu-binding sites, where low values of L– indicated a near-saturation of Cu and ligand (Thuro´czy et al.54 as shown in our data. The findings suggested a saturated ligand-Cu complexation in the area, even though a higher ratio was found during the unstable condition in PP1, but the lower ratio close to 1 in PP2 indicated a good complexation processes in the water column, thus reducing the concentration of free Cu2+ ions, and excess ligand, L– concentrations.
The concentrations of Cu2+ in PP1 and PP2 were slightly similar with range 6.82×10⁻²³-3.23×10⁻²¹ M and 5.73×10⁻²³–3.58×10⁻²⁰ M (Table 5), respectively. This Cu2+ concentrations were still below the threshold limit for both PP1 and PP2. In fact, free Cu2+ concentrations as low as 10-11 M can completely inhibit cyanobacteria growth rates, while at Cu2+ concentrations above ~10-11 M, it appears as though the viability of many phytoplankton species, including diatoms, begins to decline. At the higher concentrations of Cu2+ (~10-11 M), copper will become toxic to aquatic microorganisms.10.12The Cu2+ ions become toxic to phytoplankton by affecting the uptake sites for micronutrients such as Zn2+ and Mn2+.The low concentrations of Cu2+ in PP1 and PP2 were resulted by production of the strong type ligand (L1) during both sampling periods at Perhentian Island. The binding strength (log K’) between Cu and complexing ligand were 12.04-12.96 and 12.00-12.58 in PP1 and PP2 (Table 5), respectively. This strong binding of CuL resulting to the more than 95.1% of dissolved copper in this sampling site exists as organic complexes. Wide range of log K’ value was observed at Perhentian island, especially in PP1, which probably resulted from the NE monsoon, with variations in the percentages of Cu-ligand recorded. However, all stations showed acceptable strong buffering capacity in Cu-ligand complexes. This suggested that dissolved Cu in the area function in bioavailability and possibly low toxicity threat to the marine microorganisms, since Cu bioavailability in marine environments is controlled by the concentration of free Cu2+ ion species, and not the dissolved copper or the organically complexed copper species.52 These findings are comparable to other studies of which the conditional stability constants were in the range between 10-9 and 10-15 M and more than 99% of copper present as organic complexes.53
Comparison with other coastal data showed agreement with our data (Table 6). Similar sites with acceptable salinity range within our own suggested the presence of strong Cu-ligand complexed with log K’ >12. Similar range of dCu concentrations were also observed in these sites and the pCu values also suggested the probability of dCu to function more to bioavailability, thus eliminating the toxicity threats of free Cu2+ ions in the study areas.
Table 6: Cu speciation and comparison at Pulau Perhentian and other coastal areas.
| Site | Salinity | dCu (nM) | Log K’ | pCu (M) | Reference |
| PP1 | 38-39 | 3-10 | 12-12.96 | 10-12.4 | This study |
| PP2 | 30-32 | 4-13 | 12-12.97 | 9-12.46 | This study |
| PG | 28-31 | 2-9 | 10-12.84 | 8-9 | This study |
| Vineyard Sound | 31-32 | 4.4 | 12.75 | – | Moffett et al.55 |
| Great Pond | 29-32 | 6.3 | 14.08 | – | Moffett et al.55 |
| Waquoit Bay | 29-31 | 4.3 | 12.74 | – | Moffett et al.55 |
| San Simon Inlet | 33-35 | 5-15 | 12.92 | 13.3 | Echeandia et al.56 |
| Bohai Bay | 29-31 | 18-25 | 12-13.6 | 12-13.1 | Li et al.57 |
| Venice Lagoon, Italy | 28-29 | 10-25 | 13-15 | 13-13.5 | Chapman et al.58 |
On the other hand, we have recorded the lowest and a wide range of salinity and pH values in PG, but not happen to others parameters. The range of salinity and pH in PG was 28.51-31.32 and 6.16-8.06 (Table 5), respectively. This condition during our sampling in PG might be influence the distribution of dissolved Cu speciation in the area. Previous study by Gledhill et. al.14 has suggested that at low pH the copper binding by organic matter is decreases and this will be increasing a solubility of inorganic Cu. Based on our log K’ value for PG, it was ranged 10.93-12.84 (Table 5) and indicated a wide range of log K’ value compared to PP1 and PP2. Thus, this could suggest that pH plays an importance role in Cu binding ligand in our study areas. The decreasing of pH values could cause the binding strength (log K’) to become weaker, which was supported by the highest saturation ratio values (1.03-2.77; Table 5) in PG which influenced the existence of two types of ligands in PG. Since pH could affect the primary production especially in a non-stable coastal environment59 the decreased pH in PG might had influence the phytoplankton compared to PP1 and PP2.
However, since there was no direct relationship between the in-situ parameters and log K’ values proven by statistical analysis, the discussion then focused on the crucial element of speciation, which is the presence of natural ligand produced by phytoplankton species in the area. This finding was also in odd with the theory for metal speciation, where the changes in pH values should affect the speciation processes14. However, referring to the complexation percentage and the saturation ratio of dCu/CuL, it could be suggested the roles of phytoplankton in buffering the metal ions present in the water column, as displayed by the saturation ratio values. Previously, phytoplankton studies were done in Perhentian Island, but not in Pangkor thus providing a little information on the phytoplankton groups in the area. Further study of the phytoplankton species in the Pangkor Island (PG) needs to be done to give an input about the species and their type of ligand produced for more detail information.
Phytoplankton identification data from Li Yu and Mohamed60 showed the presence of at least 32 species of phytoplankton detected in the Perhentian Island. Each station had different amount of phytoplankton at different depths. Notable species with highest amount at all stations include Peridinium sp, Ankistrodesmus acicularis sp, Rhizosolenia styliformis sp. and Aphanocapsa delicatissima sp. Station 2, 3 and 5 recorded high amount of phytoplankton measured with 1127, 1138 and 1149 in 0.1 mL sample respectively. From the previous studies,61 the percentage composition of phytoplankton groups in Perhentian Island for diatom was 98.69% of Bacillariophytes and 0.54% for Dinoflagellates species. This data indicated that diatoms were the phytoplankton communities that dominated the Perhentian Island seawater.
Currently, only Synechococcus has been found to produce L1-type ligands, although the prochlorophyte Prochlorococcus might also be a source.62 In our data, there is no such species detected. This is due to the fact that the cyanobacteria Synechococcus are minor constituents or are absent of the phytoplankton assemblages in coastal regimes. Evidence from many field studies of strong Cu complexation in coastal waters during eucaryotic phytoplankton blooms suggested the possibility that phytoplankton species other than Synechococcus produce strong Cu complexing ligands.63 In our data, diatoms species such as Rhizosolenia styliformis sp and Chaetoceros similis sp were among the phytoplankton species such as Peridinium sp, Ankistrodesmus acicularis sp, Aphanocapsa delicatissima sp, Microcystis firma sp found in high amount on the upper water.60 Interestingly, the diatom species detected in our sample, Chaetoceros sp had been found to be producing a weaker L2 type of ligand in previous study62 but not detected in our analysis due to different detection window, which was related to the concentration of added ligand, SA chosen in our analysis. The type of ligand produced by such species have not been studied yet and thus cannot be suggested in this work and need to be justified in future works. However, this finding does not deny the probability of type L1 ligand production by the missing phytoplankton species or the heterotrophic bacteria-which is not detected in this project. However, it must be pointed out that trace metals speciation by natural organic ligands excreted and produced by phytoplankton are not the only sources of metal complexing ligands. Previous studies showed that some marine bacteria and marine fungi64 also produced and absorbed ligands that strongly complex Cu2+, although the importance of these groups in affecting metal speciation65 in the coastal ocean is as yet unknown.
In previous works, diatoms were found to produce Cu complexing ligands in laboratory analysis62 with one strain of the common coastal diatom S. costatum found to produce Cu chelating ligands with log K’>12. Even though this species was not found in this study, we cannot eliminate the possibility of more phytoplankton species present in the study area that were not found in our laboratory analysis. The conditional stability constants, log K’, as well as metal complexing capacity, had been used as physicochemical parameters used to see the metal-organic complexes in seawaters. These values indicated the ionic species of the metal which would be affected by the low concentrations of complexing material present. Since the data obtained from this study indicated a strong Cu-ligand relationship (log K’>12), and the diatoms were found to be the dominant species in the area, it is acceptable then that in Perhentian, the phytoplankton community present was a major source of Cu complexing ligands
All the results observed in saturation rate, complexation percentage, and the conditional stability constant, log K’CuL and also the pCu data for all three PP1, PP2 and PG islands suggested that the dissolved Cu in the study area are taken up by marine organisms, thus preventing the free Cu2+ ions to be produced. The complexing capacity of the species in the area were also highlighted in the results, which gave an indication of the ability of the organisms to absorb dissolved Cu and render it non-toxic, by complexing with dissolved Cu. In addition, the presence of dominant diatoms species might had also influence Cu bioavailability in the area. Since Cu is an essential micro-nutrient for growth, and the Cu species in the area appeared to be non-toxic by complexation, this had enabled the uptake process by marine organisms in the area. Further studies need to be done to get the information on the natural strong-ligand producer in the areas to clearly discuss their existence, distributions and roles in controlling the speciation processes.
Conclusion
Our preliminary data for Perhentian and Pangkor Islands are presented here. Strong complexing ligands were found in Perhentian samples. The pCu and the free Cu2+ values were found below the threshold value (10-11 M) and these values should not generally induce toxic effects in biota. Even though the water parameter was affected by the Northeast monsoon, the speciation however, was found to be successful, indicating the role of organic ligands in the area. On the other hands, two types of ligands (strong and week ligands) was detected in Pangkor Island. This finding highlighted the influence of seawater pH on the binding strength of natural organic Cu(II) binding ligand in these study areas and to the primary production of phytoplankton. The saturation rate for both parks also showed good range of saturated ligand-dissolved Cu in the area. This further suggested that dCu in the area function in bioavailability, with low toxicity threat. Extensive works need to be done in the future to tighten the missing information collected and to provide more data on speciation, toxicity and phytoplankton species for these marine parks.
Acknowledgment
The authors would like to thank the Ministry of Higher Education (07-02-14-1533FR) for the funds given for Perhentian Island project and also the Pangkor Island Scientific Expedition 2017 (PISE) organizing committee, together with all the sponsors involved in the expedition. Thanks to the Ecotourism & Conservation Society Malaysia (ECOMY), Vale Malaysia Minerals Sdn Bhd, and Perak State Forestry Department & Majlis Perbandaran Manjung. The authors also highlight the generous help from Fakulti Pengajian Alam Sekitar, UPM ENFORCE team during the expedition.
References
- Williams, P.M. Limnol. Oceanogr. 1969, 14, 156-158.
CrossRef - Van den Berg, C.M.G..Mar. Chem. 1982, 11, 307-322.
CrossRef - Van den Berg, C.M.G. Mar. Chem. 1984, 15, 1-18.
CrossRef - Sunda, W. G. and Ferguson, R. L. Trace Metals in Sea Water. ed. C. S. Wong, E. Boyle, K. Bruland, J. Burton, and E. D. Goldberg, Plenum, New York. 1983, 871.
CrossRef - Donat, J.R.; Statham, P.J. and Bruland, K.W. Mar. Chem. 1986, 18, 85-99.
CrossRef - Moffett, J.W. and Zika, R.G. Mar. Chem. 1987, 21, 301-313.
CrossRef - Coale, K. H. and Bruland, K. W. Limnol. Oceanogr. 1988, 33, 1084–1101.
CrossRef - Coale, K. H. and Bruland, K. W. Deep-Sea Res. 1990, 37, 317–33.
CrossRef - Brand, L.E.; Sunda, W.G. and Guillard, R.R.L. J. Exp. Mar. Biol. Ecol. 1986, 96, 225–250.
CrossRef - Moffett, J. W., Brand, L. E. and Zika, R. G. Deep-Sea Res. 1990, 37, 27–36.
CrossRef - Peers, G. and Price, N.M. Nature. 2006, 441 (7091), 341–344.
CrossRef - Sunda, W.G. and Huntsman, S.A. Limnol. Oceanogr. 1998, 43 (6), 1055–1064.
CrossRef - Millero, F.J.; Woosley, R.; Ditrolio, B. and Waters, J. Oceanography. 2009, 22 (4), 72–85.
CrossRef - Gledhill, M.; Achterberg, E. P.; Li, K.; Mohammed, K. N. and Rijkenberg, M. J.A. Marine Chemistry. 2015, 177 (3), 421-433.
CrossRef - Adiana, G.; Shazili, N. A. M.; Marinah, M. A. and Bidai, J. Environ Monit Assess. 2014, 186, 421–431.
CrossRef - Godon, E. and Mohamed, K. N. In-house Seminar of the Chemical Oceanography Laboratory. 2016, Issue 1, Vol. II, 12-18 (ISNN: 0127-9629).
- Cuong, D.T. and Obbard, J.P. In Applied Geochemistry. 2006, Volume 21, Issue 8, 1335-1346, ISSN 0883-2927.
- Han, A.; Dai, M.G.; Jianping K.; Shuh-JI Z.; Xiaozheng J.; Sen L.; Qing L.; Hua C.; Chen-Tung A.W.; Lei H.; Jianyu L. and Wang G.F. In Press. 2013.
- Li, L.; Pala, F.; Haskins, J.; Sukola, K. and Wallace, G.T. Environ. Sci. Technol. 2011, 5, 5660–5667.
CrossRef - Croot, P.L. Limnol. Oceanogr. 2003, 48(2), 764–776.
CrossRef - Van den Berg, C.M.G. and Nimmo M. Anal Chem. 1987, 59, 924.
CrossRef - Coale, K. H. and Bruland, K. W. Deep-Sea Res. 1990, 37, 317–33.
CrossRef - Moffett, J. W. and Brand, L. E. Limnol. Oceanogr. 1996, 41, 388–395.
CrossRef - Adiana, G.; Shazili, N.A.M.; Bidai, J. and Shaari, H. Special Issue Number 1: The International Seminar on The Straits of Malacca and the South China Sea: J. Sustain. Sci. Manage. 2016, 93-106.
- Irwandi, J. and Farida, O. Int Food Res J. 2009, 16, 105-112.
- Cruz, F.T.; Narisma, T.G.; Villafuerte II M.Q.; Cheng-Chua, K.U. and Olaguera, L.M. Atmospheric Research. 2012, 122, 609-616.
CrossRef - Zainol, Z. and Akhir, M.F. Jurnal Teknologi (Sciences & Engineering). 2016, 78(8), 11–27.
- Sazali, M.F.; Azlan, M.R.P and Badaruddin M. Proceedings of International Conference on Tourism Development, February 2013.
- Badaruddin, M.; Yusnita, Y.; Abdul, A.H. and Abdullah. In Proc. KUSTEM 3rd Annual Seminar on Sustainability Science and Management, Kuala Terengganu, Malaysia. 2004, 496–499.
- Achterberg, E.P.; Holland, T.W.; Bowie, A.R.; Mantoura, R.F.C. and Wordfold, P.J. Anal Chim Acta. 2001, 442, 1-14.
CrossRef - Mohamed, K. N.; Steigenberger, S.; Nielsdottir, M. C.; Gledhill, M. and Achterberg, E. P. Deep Sea Res Part I. Oceanographic Research Papers. 2011, 58 (11), 1049-1059 (doi:10.1016/j.dsr.2011.08.011).
CrossRef - Campos, M. L. A. M. and Van den Berg C. M. G. Anal. Chim. Acta. 1994, 284, 481–496.
CrossRef - Baron, M.; Arelland, J.B. and Gorge, J.L. Physiol. Plant. 1995, 94, 147–180.
CrossRef - Akhir, M.F.; Daryabor, F.; Husain, M.L.; Tangang, F., and Qiao, F. Open Journal of Marine Science. 2015, 5, 273-279.
CrossRef - Stuhldreier, I.; Sánchez-Noguera, C.; Rixen, T.; Cortés, J. and Morales, A. PLOS ONE. 2015, 10 (11).
CrossRef
- Buck, K. N.; K. E. Selph, and K. A. Barbeau. Mar. Chem. 2010, 122, 148-159.
CrossRef - Sang, Y. W.; Adam, M. K.M.; Fakaruddin, F. J.; Saleh, F. Z.; Chang, N. K.; Yunus, F. and Abdullah, M. H. MOSTI Research Publication. 2016, 4/2016.
- Fortune, J. and Mauraud, N. Department of Land Resource Management, Aquatic Health Unit. Palmerston, N.T. 2015, Report No. 02/2015D.
- Adiana, G.; Shazili, N. A. M.; Marinah, M. A. and Bidai, J. Environ Monit Assess. 2014, 186, 421–431.
CrossRef - Suratman, S.; Hussein, A.N.A.R.; Tahir, N.M.; Latif, M.T.; Mostapa, R. and Weston, K. Sains Malaysiana. 2016, 45(4), 551-558.
- Butler, J and Padovan, A. Water Monitoring Branch, Natural Resource Management Division. Department of Natural Resources, Environment and the Arts. 2005.
- Talley, L. D. Encyclopedia of Global Environmental Change. 2002, vol. 1, M. C. MacCracken and J. S. Perry, editors, John Wiley and Sons.
- Wu, M. L. and Wang, Y. S. Estuarine Coastal and Shelf Science. 2007, 72, 732–742.
CrossRef - Jack, J.P.; Amal, T. A. and Naima, S. K. J. Black Sea/Mediterranean Environment. 2009, 15, 135-156.
- Fakaruddin, F.J.; Sang, Y.W.; Adam,M.K.M.; Chang, N.K. and Abdullah, M.H. Research Publication No. 1/2017. Malaysian Meteorological Department. 2017, 1/2017.
- Van den Berg, C.M.G. and Kramer, J.R. Analytica Chimica Acta. 1979, 106, 113 – 120.
CrossRef - Ruzic, I. Anal Chem. Acta. 1982, 140, 99-113.
CrossRef - Skrabal, S. A., Donat, J. R., and Burdige, D. J. F Limnol. Oceanogr. 1997, 42, 992–996.
CrossRef - Helios-Rybicka, E. and Kyziol, J. Mitt.österr. geol Ges. 1991, 83, 163–176.
- Charriau, A.; Ludovic, L.; Gao, Y.; Leermakers, M.; Baeyens, W.; Ouddane, B. and Billon, G. Applied Geochemistry. 2011, 26, 80–90.
CrossRef - Trevors, J. T. and Cotter, C. M. Journal of Industrial Microbiology. 1990, 6(2), 77–84.
CrossRef - Van den Berg, C.M.G. Anal. Chem. 2006, 78 (1), 156–163.
CrossRef - Ellwood, M. J. and Van den Berg, C. M. G. Mar. Chem. 2001, 75, 49–68.
CrossRef - Thuroczy, C.E.; Gerringa, L.J.A.; Klunder, M.B.; Laan, P. and de Baar H.J.W. Deep-Sea Research II. 2011, 58, 2695–2706.
CrossRef - Moffett, J.W., Brand, L.E., Croot, P.L. and Barbeau, K.A. Limnol. Oceanogr. 1997, 42,789–799.
CrossRef - Santos-Echeandia, J., Laglera, L.M., Prego, R. and Van den Berg, C.M.G. Estuarine, Coastal and Shelf Science, 2008, 76, 447–453.
CrossRef - Li, L.; Liu, J.; Wang, X. and Shi, X. Mar Chem. 2015, 172, 34-35.
CrossRef - Chapman, C.S., Capodaglio, G., Turetta, C. and Van den Berg, C.M.G. Mar Environ. Res, 2009, 67, 17–24.
CrossRef - Terje, B.; Daugbjerg, N.; Andersen, B. and Betina. H. P. Marine Ecology Progress Series. 2010, 416, 79-91.
- Li, Y. and Mohamed, K. N. Thesis, Universiti Putra Malaysia. 2016
- Yusoff, F. M.; Zubaidah, M. S.; Matias, H. B. and Kwan, T. S. Aquaculture Research. 2002, 33(4), 269–278.
CrossRef - Croot, P.L.; Moffett, J.W. and Brand, L. Limnol. Oceanogr. 2000, 45, 619–627.
CrossRef - Robinson, M.G. and Brown, L.N. Mar Chem. 1991, 33, 105-118.
CrossRef - Huang, T.C.; Lay, K.C. and Tong, S.R. Bot Bull Acad Sin. 1991, 32, 129-133.
- Gonzalez-Davila, M.; Santana-Casiano, J. M.; Perez-Pena, J. and Millero, F. J. In Environmental Science & Technology. 1995, 29, 289-301.
CrossRef

This work is licensed under a Creative Commons Attribution 4.0 International License.
![]()
A New Edition of Web of Science
Journal Impact Factor
2022: 0.5
Five Year: 0.8
Journal is Indexed in

Cabells Whitelist
![]()


