Studies on Precision and Accuracy in Microdetermination of Transition Metals Using Ternary Complex EAB-CTAB-Metals
Suparna Deshmukh
S.K. Gandhi College, Kada, Tal. Ashti, Dist. Beed, Maharashtra 414202, India.
Corresponding Author E-mail: suparna.deshmukh@gmail.com
DOI : http://dx.doi.org/10.13005/ojc/3404029
Article Received on : 02-06-2018
Article Accepted on : 30-06-2018
Article Published : 25 Jul 2018
Complexometric and Analytical studies have carried out by forming ternary complex between Eriochrome Azurol B, and Cetyl Trimethyl Ammonium Bromide CTAB; and some transition metal ions mainly Cu2+, Ni2+ and Cd2+. The absorption spectra of Eriochrome Azurol B ,EAB; a triphenylmethane dye, has studied in the presence as well as in the absence of surfactant, Cetyl Trimethyl Ammonium Bromide, CTAB at pH values ranging from pH 1.00 to 12.00. Hypsochromic shift is observed in the absorption spectra in the presence of surfactant pK values i.e. dissociation constant values are found to decreased, in the presence of surfactant is observed. Composition of chelates EAB:CTAB:Metal is found to be 1:1:1, and effect of foreign ions such as chlorides, nitrates; and sulphates of sodium, potassium and ammonium; has been studied in detail. Stability constants of the chelates are determined. Sensitivity and Stability of chelates formedincreases in the presence of surfactant. Various analytical parameters including range of adherence to Beers Law, Molar Extinction Constants, Sandells Sensitivity, were studied for all systems by its interaction with and without CTAB. Precision and Accuracy of the method suggested for microdetermination of metal ions is determined and found out that method is both precise as well as accurate.
KEYWORDS:Accuracy and Precision; Hypsochromic Shift; Sensitivity; Surfactant; Stability; Triphenylmethane Dye
Download this article as:| Copy the following to cite this article: Deshmukh S. Studies on Precision and Accuracy in Microdetermination of Transition Metals Using Ternary Complex EAB-CTAB-Metals. Orient J Chem 2018;34(4). |
| Copy the following to cite this URL: Deshmukh S. Studies on Precision and Accuracy in Microdetermination of Transition Metals Using Ternary Complex EAB-CTAB-Metals. Orient J Chem 2018;34(4). Available from: http://www.orientjchem.org/?p=47620 |
Introduction
The property of formation of colored complexes has successfully applied for the spectrophotometric estimation of metal ions since last few decades. The addition of long chain quaternary salts to the deeply colored solution of dyes causes a marked color change with the change in wavelength of maximum absorption. Short range electrostatic forces, on the surface of micelle double layer changes the max and hence hypsochromic shift is observed. The purpose of addition of surfactants to the dyes is to decolorize them. It is followed by Sign Rule1 which is an empirical statement. The interesting property of the aggregates formed is its ability to form colored complexes with various cations. Another advantage is that the determination of microamounts of metal ions can be done with much higher sensitivity in the presence of surfactants. Reaction of triphenylmethane dyes with 4f and 5f metal ions have been a subject matter of study by several workers.2-8
Studies were carried out on the mechanisms of interactions between dyes, surfactants and metal ions for analysis of metals in solutions.6-10 Reactions between Cu2+, Fe2+ and Al3+with Chrome Azurol S and non ionic surfactants has studiedin detail.11 Present study aims to determine metals under study with simple and sophisticated instruments like Shimadzu Spectrophotometer at micro levels if present in water as pollutants. With this aim present studies are taken to develop a sensitive process for microdetermination with higher sensitivity by interactions of Triphenylmethane dye EAB, and surfactant Cetyl Trimethyl Ammonium Bromide. Complexation of dye and metal ions under studyCu2+, Ni2+ and Cd2+ has been discussed in both absence and presence of surfactant. Composition of dye-surfactant complex is determined by adding varying concentration of surfactants to the dye solutions. Higher concentration of mineral salts12 prevents the micelle formation due to occurrence of inorganic anions which displace dye as counter ions. Hence effect of mineral salts has also been studied.
Experimental Work
Instruments
UV Shimadzu spectrophotometer UV-240 a Japanese Model was used for all absorbance measurements. Distilled water blanks were used for absorption studies and measurements were done by using Glass cuvettes of 1cm thickness supplied with the instrument. All pH measurements were done on pH meter with glass electrodes and instrument was operated on 220 volts stabilized by AC mains. Elico make, pH meter, model no LI-10 was used.
Results and Discussion
Absorption Spectra
By adjusting pH 1.0 to 12.0, absorption spectra of EAB was studied in presence as well as in absence of CTAB. The max values obtained at different pH values are as summarized below in Table 1.
Materials
The reagents used were of 99.99%purity and of BDH make with Analytical Reagent grade. For preparing surfactant solution, Cetyl Trimethyl Ammonium Bromide was dissolved in 20% aq. methanol. Eriochrome Azurol B powder was dissolved in double distilled water to make dye solution, while standard solutions of metals were prepared by dissolving metal salts in double distilled water.
Procedure
In all the experiments of systems under study, a definite sequence was maintained. Surfactant CTAB solution was added to dye solutionwhich was kept for at least 30min for complete complexation between dye and surfactant. Time necessary for complete equilibration, was 30 mins. And then the absorbance readings were recorded.
Table 1: EAB max Values at Variable pH Values From1.0 – 12.0
| pH | λmax (nm) of EAB | λmax (nm) in presence of CTAB |
| 1.0 – 2.0 | 470 | 480 |
| 3.0 | 460 | 510 |
| 4.0 | 460 | 450 |
| 5.0 | 450 | 420 |
| 6.0 -9.0 | 420 | 425 |
| 10.0- 11.0 | 425 | 610 |
| 12.0 | 595 | 610 |
Hypsochromic shift was observed at pH 5.0. Hence, pH of study for using EAB and CTAB is 5.0.
Dissociation Constant (pK values) of EAB
The EAB contains three replaceable protons in its molecule. Two -COOH groups possess two protons, while third available proton is in -OH group. The dissociation reaction which occurs in the stepwise dissociation of EAB is represented in equilibrium as follows.
The above equilibrium reaction shows three pK values of EAB. Experiments were carried out for the determination of pK values of EAB alone and in the presence of surfactant, CTAB as reported in Table 2. Several sets of solutions of suitable concentrations of dyes were prepared and pH was adjusted from 1.0 to 12.0. Spectra of these solutions were recorded from 380nm to 700nm in the entire visible region. Then a graph is plotted between absorbance and pH values at different λ max obtained from spectra. The S- shaped curves are obtained where the lower part of it represents the molecular species and the upper portion represents the ionic species. From these, pK values are calculated for dissociation of dye alone as well as for its interaction with CTAB. It has shown a decreasing trend in pK values in presence of CTAB. This has been related to an early dissociation of protons of triphenylmethane dyes in the presence of surfactants showing a decrease in the value of their constants. Formation of dye-surfactant complex is indicated by decreased values of pK.
Table 2: Dissociation Constants of EAB.
| pK values | EAB | EAB + CTAB |
| pK1 | 3.00 | 2.70 |
| pK2 | 5.69 | 5.04 |
| pK3 | 11.13 | 10.84 |
Lowering of pK values indicates the action of surfactants on EAB.
Composition Of EAB-CTAB Complex
The effect of varying concentration of CTAB on EAB absorbance was also studied at pH 5.0 and at 420nm. The absorbance of EAB decreases linearly upto a definite ratio of EAB:CTAB, as 1:1, is reached. After this point the addition of surfactant , even in excess amount does not alter the absorbance of EAB to any significant extent. Thus the complex formed is represented as [EAB(CTAB)]. Successive reaction of CTAB on EAB has been indicated by descending part of the curve. The state of maximum decolorisation is reached after which there is no change in absorbance is observed. After this point the further addition of increased concentration of CTAB to EAB, does not alter the absorbance of EAB. Hence, EAB complex can be represented as [EAB (CTAB)].
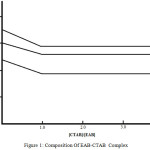 |
Figure 1: Composition of EAB-CTAB Complex Click here to View figure |
Effect of Mineral Salts
Caiwen and Quingyue13 studied the effects of inorganic salts on the color reactions of triphenylmethane dyes in the presence of surfactants, which found to exert some sensitizing effect on the color complex formation between TPM dyes and surfactants. The cations did not show any effect on the absorbance of dye-detergent solution. Nitrates has shown some effect at pH 5.0, as the absorbance goes on increasing upto certain extent after which it remains unaltered. The mineral salts selected were the chlorides ( KCl, NaCl, and NH4Cl), the nitrates (KNO3 , NaNO3 , (NH4)NO3), and sulphates K2SO4, Na2SO4, (NH4)2SO4.To study this in detail, different concentration of salt solutions were added to 1.0×10⁻³ M EAB solution containing 1.0×10⁻² M CTAB into it.
Absorption Spectra of the Complexes and Chelates
For systems of EAB, EAB+Metal ion, EAB +CTAB; EAB + Metal ion + CTAB the absorption spectra are studied at pH 5.0. The nature of complexes and chelates formed between EAB and metal ions Cu2+, Ni2+ and Cd2+, has been discussed in the presence of surfactant CTAB and are compared with those formed in absence of CTAB. Absorption Spectras obtained are same as represented in fig. 2. In alkaline range the metals under study were found to be susceptible for hydrolysis. Hence the complexation is studied in the lower range of pH 3.0 topH6.0.The bathochromic shift is observed in the absorption spectras of chelates of metals Cu2+, Ni2+ and Cd2+ in the presence of surfactant CTAB, with increase in their values of absorbance. Bathochromic shift for chelates is observed due to the dissociation of protons of the dye EAB after its interaction with surfactant CTAB, and the metals selected for study.
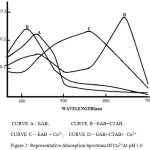 |
Figure 2: Representative Absorption Spectrum Of Cu2+At pH 5.0 Click here to View figure |
Table 3: λmax of EAB ITS Complexes At pH 5.0
| COMPLEX SYSTEM | λ max (nm) |
| EAB | 450 |
| EAB+ CTAB | 420 |
| EAB +Cu2+ | 560 |
| EAB +CTAB + Cu2+ | 640 |
| EAB +Ni2+ | 530 |
| EAB+ CTAB + Ni2+ | 630 |
| EAB + Cd2+ | 540 |
| EAB+ CTAB + Cd2+ | 640 |
ChelatesComposition
The stoichiometric ratio was determined for studying stability of complexes of metal ions under study. It is ascertained by applying Jobs Method of Continuous Variation. It is observed that the composition of the complexes of metal ions under study with EAB remains unaltered even in the presence of surfactant. Composition studies revealed that, EAB forms complexes at Metal: Ligand ratio as 1:1 with metal ions Cu2+& Ni2+and with ions Cd2+ it is obtained as 1:2 which remains unaltered even in its chelates with CTAB.
Stability Constant
The stability constants are represented by log K values of chelates. The stability constants are as shown in Table 4
Table 4: Composition and Stability Constant (LogK) of Chelates
| Chelates | λmax (nm) | Composition M:EAB:CTAB | LogK value By Job’s method |
| Cu2+– EAB | 560 | 1:1 | 3.7 |
| Cu2+-EAB-CTAB | 640 | 1:1:1 | 4.5 |
| Ni2+– EAB | 530 | 1:1 | 4.1 |
| Ni2+-EAB – CTAB | 630 | 1:1:1 | 5.1 |
| Cd2+– EAB | 540 | 1:2 | 9.7 |
| Cd2+-EAB-CTAB | 640 | 1:2:2 | 10.1 |
Results reveals that the log K values obtained for chelates of EAB are higher for its systems obtained with CTAB as compared to that obtained without surfactant.This isattributed to thereaction of surfactant with EAB which dissociates protons from phenolic group of EAB, and association of metal ions to itat the pH of study and thereby increasing the value of stability constant in its presence.
Analytical applications
Throughout the experimentations, a same sequence of addition is followed which is obtained by taking many trials on different combinations. According to selected sequence, to the TPM dye i.e EAB solution surfactant solution was added, which was then kept for half an hour for complete equilibration. On formation of dye – detergent complex metal solution was added to the complex. After stable chelate formation, color shows stability upto3 to 4 hours. It was observed that temperature variations shows very less effect from 250C to 600C on all systems under study.
pH range of Stability
For studying the effect of pH on stability of metal chelates the dye : surfactant : metal ratio was taken as 3:15:1 i.e.1:5:0.33 & from pH 3 topH 6.5the effect was studied for all EAB chelates. Total volume of the system was kept as 25ml. The stable pH range was selected at which absorbance values showed constancy. Such range was selected as pH range of stability for chelates under study.
Beer’s Law and Photometric Ranges
Beer’s Lawis studied for getting linear relationship between concentration and absorbance of the systems under study in presence as well as absence of metal ions under study. This study was carried out by taking constant concentrations of reagents and adding different concentrations of metal ions to it at pH 5.0 and at ascertained λmax of chelates. By plotting graphs on the basis of Ringbom plots log of metal ion concentration Vs.% transmittance, the effective photometric range was evaluated.
Sandell’s Sensitivity and Molar Absorptivity of the Chelates
Sensitivity of color reaction, as defined by Sandell; for chelates is given by log Io/It, is as shown in Table 5. Along with it values for pH range of stability, Beers Law Range, Photometric range of analysis are also listed below.
Table 5: pH range, Beer’s Law obeying range , Effective Photometric Range, Sensitivity, and Molar Absorptivity at pH 5.0
| Chelates | pH range | Beer’s law Range In ppm | Photometric Range | Sandell Sensitivity SX10-2 | Molar absorptivity EmX10-3 | λmax (nm |
| Cu(II)-EAB | 3.2-4.4 | 0.22-0.36 | 0.20-0.74 | 2.7 | 9.5 | 560 |
| Cu(II)EABCTAB | 3.5-5.0 | 0.69-1.98 | 0.69-1.41 | 3.8 | 13.1 | 640 |
| Ni (II) – EAB | 3.8-4.2 | 0.95-1.1 | 1.14-3.24 | 2.8 | 10.6 | 530 |
| Ni(II)EABCTAB | 4.5-5.5 | 1.04-3.52 | 1.56-3.55 | 3.9 | 14.5 | 630 |
| Cd(II) – EAB | 4.2-4.8 | 0.75-4.22 | 1.55-3.36 | 10.2 | 3.5 | 540 |
| Cd(II)EABCTAB | 5.0-6.0 | 1.12-5.99 | 2.82-4.46 | 17.9 | 5.83 | 640 |
Spectrophotometric Microdeterminations of Cu (II), Ni(II), and Cd (II), with EAB and CTAB
Concentration of metal ions under study are taken as mentioned in effective photometric range of determination and the pH of the EAB solution, pH of systems with this concentration was adjusted to pH 5.0. Dye-surfactant solution was kept for 30min for complete decolorisation and complexation. Total volume of the systems was maintained at 25ml with distilled water. Absorbances are recorded at maximum wavelength of study on Shimadzu double beam Spectrophotometer. Concentration of metal ion present in unknown solution or analyte can be obtained by comparing absorbance with standard spectras studied with same conditions.The mean absorbance, mean deviation and relative mean deviation are also found out. The value of most probable analytical errors is determined with root mean square deviation; for ten replicate determinations ranges between 0.0008 to 0.0037 at the confidence limit of t=99.5%. If the number of determinations are further increased which will subsequently decrease the value of tα. Consequently, a point would be reached when increase in precision will be too small to justify the expenditure of labour, time and reagents involved in increased number of determinations. On the basis of root mean square deviation(σ); the most probable error(ε), the difference between arithmetic mean (Ẋ); and the true or most expected value (Xt) of absorbance for the systems under study, conclusions are drawn. Precision and accuracy data calculated are given in following Table 5. The expected diminish in the probable errors would also decrease the level of confidence limit, hence ten replicate determinations have been done in present studies.
Table 5: Precision Data For Absorbance Measurement
| System | Ẋ | σ | ε | Ẋ – ε | Ẋ + ε |
| Cu(II)-EAB | 0.893 | 0.008 | 0.0094 | 0.8836 | 0.902 |
| Cu(II)EABCTAB | 0.076 | 0.002 | 0.0023 | 0.0737 | 0.078 |
| Ni (II) – EAB | 0.566 | 0.005 | 0.0058 | 0.560 | 0.572 |
| Ni(II)EABCTAB | 0.058 | 0.002 | 0.0023 | 0.0557 | 0.114 |
| Cd(II) – EAB | 0.537 | 0.006 | 0.0070 | 0.530 | 0.544 |
| Cd(II)EABCTAB | 0.064 | 0.003 | 0.0035 | 0.0605 | 0.068 |
Table 6: Accuracy Data For Absorbance Measurement Expressed as (Δ < ε)
| System | Ẋ | Xt | Δ = Xt – Ẋ | ε |
| Cu(II)-EAB | 0.893 | 0.791 | -0.102 | 0.0094 |
| Cu(II)EABCTAB | 0.076 | 0.076 | 0.000 | 0.0023 |
| Ni (II) – EAB | 0.566 | 0.470 | -0.096 | 0.0058 |
| Ni(II)EABCTAB | 0.058 | 0.055 | -0.003 | 0.0023 |
| Cd(II) – EAB | 0.537 | 0.523 | -0.014 | 0.0070 |
| Cd(II)EABCTAB | 0.064 | 0.065 | 0.001 | 0.0035 |
Conclusions
Characteristics of a best reagent is to exhibit properties like stability of the compounds formed, specificity and sensitivity of the color reactions. Triphenylmethane dye, Eriochrome Azurol B, posses all these properties of a good reagent. Stable colored complexes of the metal ions under studyi.e,Cu2+ , Ni2+ and Cd2+, formed with EAB, has found out to increase stability as well as sensitivity of their determination at micro level in the solution containing surfactant, CTAB. The addition of surfactants to TPM dye has been observed to cause hypsochromic shift due to which there is decrease in dissociation constant while that in the presence of metal ions under study with surfactant and a bathochromic shift has been observed with considerable change in λmax which causes increase in stability constants of the chelates formed. The metal ions Cu2+, Ni2+ and Cd2+, can be effectively detected spectrophotometrically, at micro levels, by using this method. The standard deviation values are also evaluated which are the results of ten replicate determinations. The precision and accuracy studies are carried out on microdeterminations and data is reported which shows that the method proposed is both precise as well as accurate.
Acknowledgement
I express my deep sense of gratitude towards Dr. Juneja H. S, Head, Dept. of Chemistry, Rashtrasant Tukdoji Maharaj Nagpur University, Nagpur; for providing all facilities in the department, necessary for carrying out this research work.
References
- Hartley, C.F; and Downay A.A; J. Phys. Chem.; 1984;85, 835.
- Jarosz M, WydawnPolitech. Warsaw : Pol; 1988; 53.
- Shtykov, S.N., Organ ReactivityV. Analize; 1979; 3, 36.
- Chernova, R. K, Kudrytseva L.M.; Belousova, V.V; Sukhova L. K.; Organ Reactivity Analize; 1979; 3, 16.
- Cerkova L; Surfactants Solution, 4 th; 1982; 2; 1217.
- West T.S., Dognali R.M, Chesterand J.E., Bailay, W.; Talanta, 1968; 51, 1359.
- Zade A.B.; Munshi K.N.; K.L. Mitttal(ed) Procel International Conference onSurfactants in Solution, Plenum Press( Part ii ), 1988, 5,713.
- VekhandeC.R,.MunshiK.N; J.Indian CHEM. Soc. 1973; 50,384.
- Mahakalkar A.S; Munshi K.N; Asian Journal of Chemistry; 1994; 6,56.
- Ringbom A;Zh.Analyt.Chem ;1939; 115, 332.
CrossRef - Svoboda, V; Chromy, V; Talanta;1965; 12, 431.
CrossRef - Caiwen, Guo and Wang Quingyne; HuaxueShiji; 1985; 6;26.
- Ocana Juan A, Callejon Manuel and Francisco Jose B, Anal.,2000; 125,1851-1854.
CrossRef - Salma M Z Al-Kindy and FakhrEldin O Suliman, Luminescence, 2007; 22(4),294-301.
- Ahmed I S, Amin A S, Issa Y M, SpectrochimicaActa Part A, 2006; 64, 246-250.
CrossRef - Keyvanfard Mohsen, PWASET 2008, 33,2070.
- Dhepe A S, Zade A.B,; E- Journal Of Chemistry, 2011; 8(3) 1264-74.
CrossRef - Upase A. B, Zade A. B, and Kalbande P. P; E-J Chem.; 2011 ; 1132-1141.
CrossRef - Dezhampanah H and Firouzi R; Int. Res. Phys. Chem; 2012; 45-48.
- Sharma Renu, Kamal Ajar and MahajanRakesh; RSC Advances, 2016.Issue 75, 6, 71692-71704.

This work is licensed under a Creative Commons Attribution 4.0 International License.
![]()
A New Edition of Web of Science
Journal Impact Factor
2022: 0.5
Five Year: 0.8
Journal is Indexed in

Cabells Whitelist
![]()


