Studies of Distorted Octahedral Complexes of Cobalt, Nickel and Copper and Their Antibacterial Properties
Vijay Kumar1 , Rajiv Kumar Singh2, Veena Kumari3, Birendra Kumar4 and Shivadhar Sharma3
1Department of Chemistry; Raj Narayan College, 844101, Hajipur.
2Department of Chemistry; Tej Narayan Banaili College, 812007, Bhagalpur.
3Department of Chemistry; M.U. 824234, Bodh-Gaya.
4Department of Chemistry, J.J. College, Gaya, 823003, (M.U).
Corresponding Author E-mail: birendra5556@gmail.com
DOI : http://dx.doi.org/10.13005/ojc/3404030
Article Received on : 05-06-2018
Article Accepted on : 25-06-2018
Article Published : 13 Jul 2018
The ligand, 3-hydroxy-4-methoxybenzaldehydethiosemicarbazone has been prepared by the condensation of 3-hydroxy-4-methoxybenzaldehyde and thiosemicarbazide. With the help of this ligand the complexes of Co(II), Ni(II) and Cu(II) have been prepared with general formula [ML2X2] where X is secondary ligand, Cl–, NO3– and CH3COO–. The composition of complexes has been established by their microanalysis, while the metal contents have been determined gravimetrically and volumetrically. On the basis of IR spectra, the coordinating mode of ligand has been determined and has been found to have coordinated through azomethine nitrogen and thione sulphur. The magnetic moment of Co(II) complexes has been found between 4.96-4.72 B. M. The value is slightly higher than the μs value corresponding to three unpaired electrons (3.872 B.M). The increase in value may be attributed to orbital contribution from 4T1g ground state cubic term. The appearance of four bands in their electronic spectra is indicative of tetragonally distorted octahedral geometry of Co(II) complexes. The magnetic moment (3.20-3.30 B. M.) and appearance of 4 bands in the electronic spectra of Ni(II) complexes confirms the distorted octahedral geometry of the complexes. The magnetic moment of Cu(II) complexes has been determined to be (1.95-2.20 B. M.) which shows that Cu(II) complexes are magnetically dilute complexes. The appearance of three bands in their electronic spectra confirms John - Tellor distortion in octahedral symmetry of Cu(II) complexes. The various crystal field parameters exhibiting tetragonal distortion in the octahedral symmetry have also been derived. The positive value of Dt predicts tetragonal elongation in Oh symmetry.
KEYWORDS:Oh Symmetry; Tetragonally Distorted; Tetragonal Elongation
Download this article as:| Copy the following to cite this article: Kumar V, Singh R. K, Kumari V, Kumar B, Sharma S. Studies of Distorted Octahedral Complexes of Cobalt, Nickel and Copper and Their Antibacterial Properties. Orient J Chem 2018;34(4). |
| Copy the following to cite this URL: Kumar V, Singh R. K, Kumari V, Kumar B, Sharma S. Studies of Distorted Octahedral Complexes of Cobalt, Nickel and Copper and Their Antibacterial Properties. Orient J Chem 2018;34(4). Available from: http://www.orientjchem.org/?p=47336 |
Introduction
The thiosemicorbazide and derivatives has broad spectrum of applications in various fields. In biological field they may be used as fungicides, insecticides, algaecides, plant growth regulators, enzymatic aldolisation catalyst, antiviral antibiotic agents etc.1-6 One of the major development in the field of bio-organic chemistry is the finding that tin compounds of thiosemicorbazides can play an important role in anticortiogenesis as Tondon et.al7 have recently screen the di-n-butyltin complexes of Schiff base derived from S-substituted dithiocarbazate and fluoroaniline for their antitumour activity in lymphocyte leukaemia tumour system. The Schiff’s base of S-methyldithiocarbazate and its transition metal complexes have been studied for their cytotoxic action on potent antifungal activities.8-9 Terepthalic acid bis (4-phenylthiosemicarbazone) has been found tetradentete chelating agent coordinating through the thiol-S and azomethine-N. Semicarbazones and thiosemicarbazones are important class of organic compounds, which have remarkable biological properties.10-12 Due to their pharmaceutical properties and chelating nature, their complexes have extensively been studied during the recent years.13-16
These significances of thiosemicarbazone complexes, have steered us to undertake the present study that involves the synthesis and characterisation of some complexes of Co(II), Ni(II) and Cu(II) with thiosemicarbazone of 3-hydroxy-4-methoxybenzaldhyde and their antibacterial evaluation.
Material and Methods
All the reagents used were of Anal. R. Grade. 3-Hydroxy-4-methoxybenzaldhyde was procured from Aldrich while thiosemicarbazide hydrochloride was procured from BDH.
A Schiff’s base ligand, 3-hydroxy-4-methoxybenzalde hydethiosemicarbazone was prepared by the condensation of 3-hydroxy-4-methoxybenzaldehyde and thiosemicarbazide and was used for complexation with Co(II), Ni(II) and Cu(II). The metal salts (MX2.6H2O, where X = Cl– , NO–3, CH3 COO–) and ligand were taken in 1 : 2 molar ratio in ethanolic medium and solution was refluxed for 3 to 4 hours. On cooling the solution, coloured precipitate was obtained, which was filtered and washed with alcohol and dried in decicator on anhydrous CaCl2. The complexes were micro analysed for C, H, N and S and their m.p. was noted down.
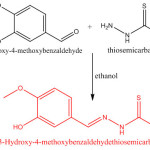 |
Scheme 1 |
The molar conductivity of complexes was determined in DMF solution of 10–3 M concentration on conductivity meter, C.G. 857 Schoolgrate GmbH having Pt-electrode. The magnetic susceptibility of complexes has been determined on Guoy balance at room temperature. The I.R. spectra of complexes were recorded Shimadzu FTIR-8400S spectrophotometer using KBr disc method. Electronic spectra of complexes were recorded on Shimadzu UV-160 spectrophotometer in DMF solution.
Table 1: Physical and Micro analytical Data of Ligand and Complexes
| Compounds | Elemental analysis (%): Calcd. (Found) | %yield | m.p. (ºC) | Molarconductivity (λ) (ohm–1 cm2mol–1) | Mag. Moment (µeff) (B.M.) | |||||
| Metal | C | H | N | S | Cl | |||||
| 1. Ligand(HMBTS):[C9H11N3O2S) | – | 48.00(48.35) | 4.89(4.70) | 18.67(18.85) | 14.23(14.18) | – | 85 | 312 | 11.50 | 4.70 |
| 2. [Co(HMBTS)2Cl2] | 10.16(09.86) | 37.25(37.78) | 03.80(03.71) | 14.48(14.42) | 10.16(09.86) | 12.24(12.11) | 78 | 314 | 15.00 | 4.69 |
| 3. [Co(HMBTS)2(NO3)2] | 09.31(09.19) | 34.13(34.35) | 03.48(03.42) | 17.70(17.61) | 10.11(10.06 | – | 83 | 315 | 12.35 | 4.72 |
| 4.[Co(HMBTS)2(CH3COO)2] | 09.40(09.32) | 42.11(42.34) | 04.47(04.35) | 13.40(13.35) | 10.21(10.11) | – | 74 | 318 | 17.00 | 3.25 |
| 5. [Ni(HMBTS)2Cl2] | 10.11(10.25) | 37.27(37.39) | 03.80(03.39) | 14.49(17.63) | 11.04(10.00) | 12.25 | 75 | 317 | 18.00 | 3.20 |
| 6. [Ni(HMBTS)2(NO3)2] | 09.26(09.14) | 34.14(34.32) | 03.48(03.39) | 17.70(17.63) | 10.12 | – | 77 | 316 | 14.00 | 3.30 |
| 7. Ni(HMBTS)2(CH3COO)2] | 09.35(09.22) | 42.13(42.36) | 04.47(04.40) | 13.40(13.34) | 10.21(10.12) | – | 81 | 330 | 15.32 | 1.95 |
| 8. [Cu(HMBTS)2Cl2] | 10.86(10.77) | 36.95(37.24) | 03.76(03.71) | 14.37(14.30) | 10.95(10.88) | 12.15(12.08) | 86 | 329 | 15.50 | 2.04 |
| 9. [Cu(HMBTS)2(NO3)2] | 09.96(09.87) | 33.90(34.12) | 03.45(03.33) | 17.56(17.48) | 10.13(09.92) | – | 83 | 332 | 15.48 | 2.00 |
| 10. [Cu(HMBTS)2(CH3COO)2] | 10.06(09.96) | 41.80(41.92) | 04.43(04.36) | 13.30(13.18) | 10.13(10.02) | – | 85 | 312 | 11.50 | 4.70 |
Result and Discussion
The percentage composition of the ligand and complexes has been given in table 1. On the basis of their molar conductivity and percentage composition the general formula of (ML2X2) has been assigned for the complexes.
Where, L = 3-Hydroxy-4-methoxybenzaldehydethiosemicarbazone and X = Cl– , NO–3, and CH3 COO–
The low value of molar conductivity of the complexes shows their non-electrolytic nature.
IR. Spectra
The sharp bond appearing at 3520 cm–1 is assigned vO-H to phenolic group17-21 in the spectra of free ligand. This bond does not undergo any change in the complexes, which shows its non-participation in coordination. The sharp band appearing at 1640 cm–1 in the spectra of the free ligand and is assigned to vCH=N, which undergoes red shift and appears at 1615-1610 cm–1 in the I.R. spectra of complexes, which is indicative of co-ordination through azomethine nitrogen of the ligand.22-23 A doublet observed at 1270 cm–1 and 1260 cm–1 is farely assigned to vCH3O group of the ligand.24,25 These bands remain intact in I.R. spectra of complexes. A sharp band appearing at 1200 cm–1 in the I.R. spectra of free ligand is assigned to vC=S. This band gets shifted to 1170-1160 cm–1 in the I.R. spectra of complexes confirming the coordination through thione sulphur of the ligand. The band appearing at 3470, 3290 and 1360 Cm–1 due to vNH2 (assy.), vNH2 (Symm.) and vNH31–34 respectively in the I.R. spectra of the free ligand do not show appreciable change in their frequency in complexes. Thus it is obvious that these groups are not envolved in coordination. The appearance of new bands at 1460–1445 cm–1, 1320–1310 cm–1 and 1000–900 cm–1 in the I. R. spectra of complexes number 3, 6 and 9 show the presence of monodentately coordinated in these complexes.35-38 The new bands appearing at 1630–1620 cm–1 in the spectra of complexes numbers 4, 7 and 10 clearly indicates the monodentately coordination of CH3COO– ion to the metal ions in these complexes39–41. The bands appearing in the far infrared region at 500–490, 420–400 and 370–365 cm–1 are assigned to vM-N, vM-S, and vM-Cl stratching vibrations respectively. Thus the ligand behaves as neutral bidentate coordinating through thione sulphur and azomethine nitrogen forming a very stable five membered ring.
Magnetic Moment and Electronic Spectra
The magnetic moment of Co(II) complexes has been found to be 4.69 – 4.72 B.M., which is greater than µS corresponding to three unpaired electrons
![]()
in high spin octahedral complexes of Co(II). This may be attributed to the lowering of symmetry from cubic one due to presence of different axial ligands. Thus µeff. values predict distorted octahedral symmetry around Co(II) in these complexes. In perfect octahedral symmetry of Co(II) complexes three bands are expected to appear in their electronic spectra due to three allowed transitions i.e., 4T1g → 4T2g , 4T1g → 4T2g and 4T1g → 4T2g (P). But here in the present case complexes display four bands which show the further splitting of 4T1g (F), 4T2g and 4T1g(P).46 The band have been given in table-2.
Table 2 (cm–1)
| Complexes | Band-1 | Band-2 | Band-3 | Band-4 |
| [Co(HMBTS)2Cl2] | 7,840 | 10,200 | 19,980 | 20,800 |
| [Co(HMBTS)2(NO3)2] | 8,200 | 8,560 | 16,280 | 20,500 |
| [Co(HMBTS)2(CH3COO)2] | 7,280 | 10,230 | 19,490 | 21,000 |
The first three bands assigned to the transitions as v2 = 4A2g →4Eg (b), v3 = 4A2g →4B2g and v4 = 4A2g →4B1g. The fourth band is broad and is not well resolved, hence it is assumed to consist of two transitions i.e., 4A2g →4Eg (c) and 4A2g →4A2g (c). The bands corresponding to v1 = 4A2g →4E2g (a) is not observed in the spectra.
On the basis of energy levels of different crystal field terms the various crystal field parameters and ν1 have been derived and the values have been displayed in table-3.
Table 3 (cm–1)
| Complexes | Dq(xy) | Dq(z) | Ds | Dt | ν1 |
| 1. [Co(HMBTS)2Cl2] | 978 | 1278.30 | –2,335.4 | –171.60 | 3,368 |
| 2. [Co(HMBTS)2(NO3)2] | 770 | 818.00 | –2,110.0 | –27.60 | 1,974 |
| 3. [Co(HMBTS)2(CH3COO)2] | 826 | 1201.50 | –2,289 | –214.60 | 2,297 |
The values are in good agreement with that of tetragonally distorted octahedral complexes of Co(II).47,48
The magnetic moment of Ni(II) complexes has been found 3.20–3.30 B.M., which are in good agreement with the values reported for six coordinated Ni(II) complexes.49,50 The electronic spectra of Ni(II) complexes display four bands which have been given in table-4.
Table 4: (cm–1)
| Complexes | ν1 | ν2 | ν3 | ν4 |
| 1. [Ni(HMBTS)2Cl2] | 8,600 | 17,750 | 15,200 | 19,400 |
| 2. [Ni(HMBTS)2(NO3)2] | 8,500 | 14,200 | 15,800 | 19,600 |
| 3. [Ni(HMBTS)2(CH3COO)2] | 8,750 | 14,600 | 15,400 | 19,350 |
The assignment of these bands with their energy are given below :-
ν2 is free from Dt and Ds and thus it is a measure of 10Dq in plane, i.e., 10Dqxy. The various crystal field parameters have been derived from the energy associated with different transitions and the values have been displayed in table-5.
Table 5: (cm-1)
| Complexes | Dq(xy) | Dq(z) | Ds | Dt |
| 1. [Ni(HMBTS)2Cl2] | 1475.00 | 245.00 | 846.40 | 702.80 |
| 2. [Ni(HMBTS)2(NO3)2] | 1420.00 | 280.00 | 769.00 | 651.40 |
| 3. [Ni(HMBTS)2(CH3COO)2] | 1460.00 | 290.00 | 797.60 | 668.57 |
The values support a tetragonal distortion in the octahedral symmetry of Ni(II) complexes. From the value of Dt and Ds, it is clear that the distortion capacity is maximum for Cl– and minimum for NO–3 ligand.
Cu(II) complexes have shown magnetic moment 1.95–2.04 B.M., which corresponds the presence of one unpaired electron indicating mononuclear nature of complexes with dilute para magnetism.53-56
These complexes display three bands in their electronic spectra, which has been given in table-6
Table 6: (cm–1)
| Complexes | ν1 | ν2 | ν3 |
| 1. [Cu(HMBTS)2Cl2] | 12,100 | 14,100 | 17,100 |
| 2. [Cu(HMBTS)2(NO3)2] | 9,250 | 11,250 | 13,250 |
| 3. [Cu(HMBTS)2(CH3COO)2] | 11,000 | 13,400 | 15,900 |
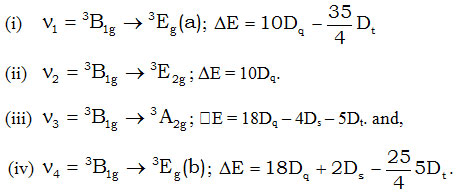
These bands has been assigned to the following spin allowed transition with their energy.57
v1 = 2B1g →2A1g = –6Dq + 2Ds + 6Dt + 2Ds–Dt = 4Ds + 5Dt
v2 = 2B1g →2B2g = 4Dq – 2Ds + Pt + 6Dq + 2Ds–Dt = 10Dq.
and
v3 = 2B1g →2Eg = 4Dq + Ds – 4Dt + 6Dq – 2Ds – Dt = 10Dq + 3Ds– 5Dt.
The values of different parameter have been derived using above equations and shown in table-7.
Table 7: (Cm–1)
| Complexes | Dq(xy) | Dq(z) | Ds | Dt |
| 1. [Cu(HMBTS)2Cl2] | 1410 | 1503 | 3775 | 1665 |
| 2. [Cu(HMBTS)2(NO3)2] | 1125 | 1128 | 2812.5 | 1287.5 |
| 3. [Cu(HMBTS)2(CH3COO)2] | 1340 | 1328.75 | 3375 | 1525.00 |
The values are in good agreement with those reported for tetragonally distorted Cu(II) complexes.58-61
Bioactivity Measurements
The ligands as well as all the complexes were screened for the invitro antibacterial activities against Escheraichia Coli, citrobactor gillenii using the agar disk diffusion method.62 The antibiotic, Chloramphenicol has been taken as standard for comparison. Autoclave Nutrient agar medium was poured into sterine peri-dish after dipping the test compound in DMSO solution. The width of the growth inhibition zone around the disc was measured after 24 hours incubation at 35°C temperature. Since DSMO was used as solvent, it was also screened against whole organisms and no activity was found. The antibacterial data have been given in table-8.
Table 8: Antibactarial activity data of ligand and complexes Inhibition Zone in mm.
|
E-coli |
Citrobactor gillenii | ||||||
| Concentration |
Concentration |
||||||
| S.No. | Compounds | 500 µg/mL | 250 µg/mL | 100 µg/ mL | 500 µg/ mL | 250 µg/ mL | 100 µg/ mL |
| 1 | 3-hydroxy-4-methoxybenzaldehyde thiosemicarbazone(HMBTS) | 7 | 6 | 4 | 8 | 8 | 7 |
| 2 | [Co(HMBTS)2Cl2] | 14 | 14 | 8 | 13 | 12 | 8 |
| 3 | [Co(HMBTS)2(NO3)2] | 15 | 14 | 9 | 14 | 12 | 8 |
| 4 | [Co(HMBTS)2(CH3COO)2] | 13 | 12 | 8 | 14 | 13 | 9 |
| 5 | [Ni(HMBTS)2Cl2] | 15 | 13 | 10 | 14 | 11 | 8 |
| 6 | [Ni(HMBTS)2(NO3)2] | 14 | 13 | 9 | 15 | 13 | 9 |
| 7 | Ni(HMBTS)2(CH3COO)2 | 13 | 13 | 10 | 13 | 13 | 9 |
| 8 | [Cu(HMBTS)2Cl2] | 18 | 17 | 11 | 16 | 15 | 10 |
| 9 | [Cu(HMBTS)2(NO3)2] | 19 | 17 | 10 | 17 | 15 | 10 |
| 10 | [Cu(HMBTS)2(CH3COO)2] | 16 | 15 | 10 | 16 | 14 | 9 |
| 11 | Standard (Chloramphenicol) |
40 | 39 | 33 | 35 | 34 | 30 |
It is obvious from the data that all the complexes exhibit enhanced biological activity than the ligand, but lesser activity than the standard at whole the concentration. It is also clear that at 100 µg/ml concentration the inhibition is very low compare to higher concentration. The complex of Cu(II) are found more active than other complexes at all the concentration. This may be due to stronger biological activity of Cu (II) than Co(II) and Ni(II). The enhancement of biological activity of the ligand after complexation may be attributed by chelate formation which fascinates the complex across the cell memebrance.63-65
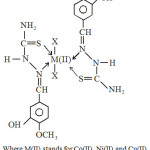 |
Scheme 3 |
Conclusion
The ligand 3-Hydroxy-4-methoxybenzaldehyde thiosemicarbazone acts as neutral bidentate ligand coordinating through thione sulphur and azomethine nitrogen forming five membered ring with the metal ions. Due to the presence of different axial ligands all these complexes are appreciably tetragonally distorted. It is also revealed that the distortion capacity of chloride is maximum while that of nitrate is minimum, which may be attribute to the greater coordinating capacity of NO-in respect of Cl– and CH3COO–. Cl– having weakest coordinating capability remain at lower distance from metal ions along z-axis and hence their is greater tetragonal distortion in octahedral symmetry of complexes. The tentative structure may be given as below.
Bioactivity measurement reveals that all the complexes are biologically more active against both E- coli and c-gillenii than the free ligand but less active than standard Chloramphenicol.
Acknowledgement
The authors are thankful to the Dr Sunil Kumar Singh, Professor and Head, P.G. Department of Zoology, M.U. Bodh Gaya for providing lab. Facility to carry out the biological evaluation of ligand and newly synthesized coordination compounds.
References
- Esso Research and Engg. Co. Brit. 893, 977; Chem. Abstr.. 1962, 51,14068.
- Raghavan,M. Curr. Sci. 1952, 21, 10.; Chem.. Abstr. 1953.47,4302.
- Hodnot,E. M.; Dunn. W. J. J. Med. Chem.. 1972,15,339,; Chem. Abstr..1972, 76, 149141.
- Gavallini,G.; Massasani, E.; Naradi, D.; Tenconi,F.; Mawli, Fermaco (Paviva) Ed. Sci., 19(9), 751.
- Swami, T.; Umezawa, S. Bull. Chem. Soc. Japan. 1956, 29,975.
- Theiss, H.; Choemerger, H.; Borah, K. Arch. Pharm.1966, 299,1031.
CrossRef - Saxena, A. K.; Tondon, J. P. Cancer letters. 1983, 19(1), 73.
CrossRef - Das, M.; Livingstone, S. E. Brit. J. Cancer. 1978, 37, 466.
CrossRef - Kocher, J. K.; Tondon, J. P.; Mehrotra, R. C. Int. J. Microbial, 1983, 1 (1), 55.
- Wang, M.; Wang, L. F. Trans Met. Chem. 2000, 25, 133.
CrossRef - Graminha, A. E.; Rodrigues, C.; Teixeiva, Fagunds, A. A. B.; E. S.; Beraldo, H. Spectrochim. Acta. Part A, 2008, 69, 1073.
CrossRef - Khan, S. A.; Yusuf, N. Eur. J. Med. Chem, 2009, 44, 2270.
CrossRef - Singh, N. K.; Strivatva, A. Trans. Met. Chem. 2000, 25, 133.
CrossRef - Singh, P.B.; Fahmi, M.; Biyala, M.K. J. Eran. Chem. Soc. 2005, 2,40.
- Kumar, D. K. A.; Sangamesh, A. P.; Prema, S. B. Int. J. Electrochem. Sci. 2009, 4, 717.
- Shckhawat, B. S.; Varshney, S.; Varshney, A. K. J. Int. Chem. Soc. 2017, 94, 21.
- Rahman, F.; Hiranath, B.; Vasavarajaiah, S.M.; Joy Kumarswamy, B.H.M.; Uusthyunjayaswami, B.H.M. J. Indian, Chem. Soc. 2008, 85, 381-386.
- Singh, N. K.; Singh, S. B. Indian J. Chem. Sect.A. 1993, 40, 1070.
- Chaudhary, C. K.; Chaudhary, R. K.; Mishra, L. K. J. Indian Chem. Soc. 2003, 80, 693.
- Mishra, L. K.; Keshari, B. K. Indian J. Chem., 1981,28A, 833.
- Malik, S.; Kumari, M.; Sharma, D. K. J. Indian Chem. Soc. 2010, 87, 539.
- Joseph, A.; Joseph, B.; Narayan, B. J. Indian Chem. Soc. 2008, 85, 479-484.
- Rastogi, A.; Anurag ; Nayan, R. J. Indian Chem. Soc, 2009, 86, 483.
- Mohod, R. B.; Wasne, R. V.; Anwar, A. S. J. Indian Chem. Soc. 2001, 78, 34.
- Krishnamkutty, K.; Umamathur ,M.B.; Ummer, P. J. Indian Chem. Soc. 2010,87,667
- Bekheiti, M. M.; . Mostafa,S. I. Chem. Pharm. Bull. Japan. 2000, 48, 266.
- Beraldo, H.; Boyd, L. P.; West, D. X. Trans, Met. Chem. 1998, 23, 67.
CrossRef - Kumar, B.; Sangal, S. K.; Kumar, A. J. Indian Chem. Soc. 2009, 86, 1038.
- Dutt, M. K.; Chakradhar, M. C. J. Inorg. Nvil. Chem. Soc. 1970,32, 3203.
- Krishna, A. K.; Reddy, K. H.; Reddy, D. V. Inorg. Chem. Acta. 1990, 173, 15.
CrossRef - Emeleus,H. J.; Hass, A.; Shappand, N. J. Chem. Soc. 1963, , 3168.
CrossRef - Gaur, N. K.; Sharma, R.; Sindhe, R. S. J. Indian Chem. Soc. 2001, 78, 26-27.
- Singh, R. V.; Dwivedi R.; Sharma, S. J. Indian Chem. Soc. 2004, 81, 454-456.
- Zong Pei-zhi and Wujun, J. Indian Chem. Soc. 2004, 81, 554-556.
- Kalsi, P. S. ‘Spectroscopy of Organic Compounds’ 4th ed. New age International (P) Ltd., New Delhi, India, 1999.
- Nakamoto, K. Infraed specta of inorganic and co-ordination copounds, Wiely Interscuence, N.Y. 1970.
- Chandra, S.; Jain, D.; Sankar A.; Anupma, J. Indian Chem. Soc. 2009, 86, 222-224.
- Sheela, A.; Gladis, M. S. P.; Nair,M. L. H. K. J. Indian Chem. Soc., 2007, 84, 329.
- Kutly, K.K.; Basheer, M.; Mathur U.; Saydevi, P. J. Indian Chem. Soc. 2009, 86, 325-330.
- Deacon, G. B.; Philips, R. J. Coord. Chem. Rev. 1980, 33, 227.
CrossRef - Dev, A. K.; Deb,D.; Nathbhaumik, R.; Dutta Purkuystha, R. N. J. Indian Chem. Soc. 2009, 86, 76-82.
- Ali, M.; Nizammuddin, M.; Franksmith, E.; Hynes, C. Polyhedron. 1996, 15, 973.
CrossRef - Raman, N.; Knlundaisamy.A.; Shunmugasunderem A.; Jeyasubramanian, K. Trans. Met. Chem. 2001, 26, 131.
CrossRef - Singh,V. P.; Madnawat, S. P.; . Kumar, D.; Neelam, J. Indian Chem. Soc. 2011, 88, 943-946.
- Figgis, B. N. Introduction to ligand field Wiely Eastern Ltd., New Delhi, 1964.
- Lever, A. B. P. Inorganic Electronic Spectroscopy, Elsevier, Amesterdam, Oxford, New York, Tokyo, 2nd Ed. 1984, P-485.
- Figgis, B. N.; Lewis, J. Prog. Inorg. Chem. 1964, 6, 37.
- Sharma, R. C.; Giri, P.A.; Kumar, D. J. Indian Chem. Soc. 2011, 88, 421.
- Singh, D. P.; Singh, S.; Ranna, V. B. J Indian Chem. Soc. 2002, 79, 889.
- Chittilappilly, P. S.; Joseff , K. K. M. Indian J. Chem. 2008, 47(A), 848.
- Wentworth, R. A. D.; Piper, T. S. Inorg. Chem. 1965, 4, 709, 1524.
- Cotton, F. A.; Wilkinson, G.; Murillo, C. A.; Blechmann, Advanced Inorganic Chemistry, 6th Edition, Jhon wiely and sons, Inc, New York. 2003, P-867.
- Kumar, D.; Syamal, A.; Singh, A. K. J. Indian Chem. Soc. 2004, 81, 911.
- Calataynd, D. G.; Lpoez-Torres, E.; Mendiola, M. A. Inorg. Chem. 2007, 46, 10434.
CrossRef - Lobana, T. S.; Bava G.; Buteha, R. J. Inorg. Chem. 2008, 47, 1488.
CrossRef - Dubey, D. K.; Mishra, C. K.; Devedi, S. K.; Tripathy, U. N. J. Indian Chem. Soc. 2011, 88, 1605.
- Lever, A. B. P. Inorganic Electronic Spectroscopy, 2nd Edition Elsevier, Amesterdom, New York. 1984, P-26.
- Figgis, B. N.; Hitchman, M. A. Ligand field theory and its applications. P-148.
- Bersuker, I. B. The John-Teller effect and vibronic interaction in modern chemisty, Phelnum press, New York. 1984.
- Reinen, D.; Atanasam,M. Mag. Reson. Rev. 1991,5167.
- Deeth, R. J.; Hiechman, M. A. Inorg. Chem. 1986, 25, 1225.
CrossRef - Liu, D.; Kwasniewska, K. Bull. Environ. Contan. Toxicol. 1981, 27, 289.
CrossRef - Tweedy, B.G. Phytopathology. 1964, 55, 910.
- Patel, R.N.; Singh, A.; Shukla, K.K.; Patel, D.K.; Sondhiya, V.P. Trans.Mat.Chem. 2010, 35, 577.
- Patel, R.N.; Singh, A.; Shukla, K.K.; Patel, D.K.; Sondhiya, V.P. J. Co-ord. Chem. 2011, 64, 912.

This work is licensed under a Creative Commons Attribution 4.0 International License.
![]()
A New Edition of Web of Science
Journal Impact Factor
2022: 0.5
Five Year: 0.8
Journal is Indexed in

Cabells Whitelist
![]()


