Structural and Magnetic Investigations of Silica Coated Cobalt- Ferrite Nanocomposites
Meenakshi Bansal, Praveen Aghamkar and Dharamvir Singh Ahlawat
Department of Physics, Chaudhary Devi Lal University, Sirsa -125055 (Hry), India.
Corresponding Author E-mail: dahlawat66@gmail.com
DOI : http://dx.doi.org/10.13005/ojc/3404045
Article Received on : 25-04-2018
Article Accepted on : 03-06-2018
Article Published : 01 Aug 2018
Silica coated cobalt ferrite (CoFe2O4:SiO2) nanocomposites were synthesized by co-precipitation technique using metal nitrates as precursors. The as-prepared sample has been further heat treated at 250°C, 500°C,750°C and 1000°C. Their structure and morphology related properties were desirably investigated by XRD, FTIR, TEM characterization techniques. Further, with the help of vibrating sample magnetometer (VSM) the magnetic properties have been successfully analysed. Furthermore, the structure and magnetism related properties of these nanocomposites are also understood with heating effects. With increasing calcinations temperature, crystallite size of CoFe2O4:SiO2 nanocomposites was also found to increase. The room temperature magnetic measurements have shown a strong relation of saturation magnetization, retentivity and coercivity with annealing temperature.
KEYWORDS:Annealing Temperature; CoFe2O4:SiO2 Nanocomposites; Co-Precipitation; Magnetic; Structural
Download this article as:| Copy the following to cite this article: Bansal M, Aghamkar P, Ahlawat D. S. Structural and Magnetic Investigations of Silica Coated Cobalt- Ferrite Nanocomposites. Orient J Chem 2018;34(4). |
| Copy the following to cite this URL: Bansal M, Aghamkar P, Ahlawat D. S. Structural and Magnetic Investigations of Silica Coated Cobalt- Ferrite Nanocomposites. Orient J Chem 2018;34(4). Available from: http://www.orientjchem.org/?p=47939 |
Introduction
Nanostructure materials because of their small size, high surface to volume ratio and quantum confinement have attracted considerable attention as compared to their bulk materials.1,2 The synthesis of new nanostructure materials are of great interest to scientist and technologist. Among ferrites, the spinel ferrites are highly attractive magnetic nanoparticles because of their many uses in various fields together with permanent magnets, ferro-fluid technology, medical diagnostics ,magnetic type drug delivery, microwave frequency devices, catalysis and high density information data storage.3-9 In these spinel ferrites, the cobalt ferrite (CoFe2O4) has been of great importance in fundamental science and technology due to their exceptional magnetic properties like large value of coercivity (Hc), moderate type saturation magnetization (Ms), high magnitude of mechanical hardness and good chemical- stability.10 As, cobalt ferrite shows inverse spinel behaviour represented by (Co1-x Fex) A (Cox Fe2-x) BO4 ,here x indicates degree of inversion ,while A and B denote tetragonal and octahedral sites respectively. However, cobalt ferrites are having very strong affinity to agglomerate, consequently it is very difficult to expose their distinctive physical behaviour needed for some important applications. To conquer this difficulty, nanoparticles are very well embedded in an insulating type silica matrix which allows stabilization of the nanoparticles.11-12 Thus, synthesis of nanoparticles is an exciting and challenging area of research for their technological and biomedical applications. In this direction, many synthetic strategies have been developed for the preparation of nanosized spinel ferrites like ball milling, sono-chemical, sol-gel, chemical co-precipitation, hydrothermal etc.13-19 This paper reports about the structural and magnetic properties of nanocomposites of cobalt ferrite (CoFe2O4) dispersed in silica matrix fabricated by co-precipitation technique. Moreover, temperature dependent investigations of their properties have also been carried out.
Materials and Methods
Sample Preparation
Various nanocomposites samples of cobalt ferrites in silica (CoFe2O4:SiO2) were prepared and synthesized with the help of co-precipitation technique as described below:
Preparation of CoFe2O4 was carried out by using high purity precursors of nitrates: cobalt nitrate hexahydrate (Co(NO3)2 .6H2O) ,ferric nitrate nonahydrate (Fe(NO3)3.9H2O), ammonia hydroxide (NH4OH). In this method Co(NO3)2.6H2O and Fe(NO3)3.9H2O were taken in the form of molar ratio 1:2 of [Co2+]/ [Fe3+] and then were dissolved in double distilled water with stirred briskly at 70°C. In this work, double distilled water was used as a solvent in order to avoid impurities. A brown coloured clear solution was obtained. Ammonia hydroxide was used as a base to get the precipitates of CoFe2O4 solution. Afterwards resultant solution was filtered with double distilled water by many times to remove impurities . Dark brown precipitates of CoFe2O4 in the form of suspension solution were obtained.
Next step was synthesis of SiO2 solution. For that a typical molar ratio of TEOS: C2H5OH: HNO3: H2O: NH4OH precursors was taken as 1: 3: 0.01:1: 0.016 respectively. After that NH4OH has been added drop wise in the solution mixture of TEOS, C2H5OH and HNO3. NH4OH turned the solution mixture of TEOS, C2H5OH and HNO3 from transparent to milky. Further, this suspension- solution was very well stirred continuously for 2h at 60°C.
In the third and final step, synthesis of CoFe2O4: SiO2 nanocomposites was carried out by mixing suspension solution obtained in the first and second steps. The mixed suspension solution was stirred for 6h. This resulted in the formation of precipitates of CoFe2O4: SiO2. Precipitates so obtained were filtered, washed and dried carefully at 80°C in a vacuum- oven overnight. These dried precipitates were grinded into a very fine- powder. Finally, this fine- powder was further heat treated at 250°C, 500°C,750°C and 1000°C in vacuum using a programmable vacuum muffle furnace.
Instrumentation
XRD: Measurements of XRD data was carried out by an X-ray diffractometer (Philips PW/1710) using mono- chromatic CuKα type radiation of wavelength1.548Å (50KV, 40 mA). XRD pattern provides information regarding crystallite size, strain and lattice parameter.
FTIR: The FTIR spectra were recorded by using FTIR spectrometer (Perkin-Elmer 1600) to study information like phase transformation and bonding of constituents in the frequency range 7800–350cm-1.
TEM: Surface morphology and microstructure of nanocrystallites was analysed by transmission electron microscopy (TEM- TECNAI 200kV) in vacuum with a maximum applied voltage 200kv.
VSM: Measurements of magnetic properties of our prepared ferrites samples were performed at room temperature with the help of a vibrating sample magnetometer (VSM) Model ADE-EV9 under highest magnetic field of 2.2 Tesla.
Results and Discussion
XRD Analysis
Recorded XRD pattern for CoFe2O4: SiO2 of various samples, as-prepared along with heat treated type at temperatures 250°C, 500°C and 750°C are shown in fig.1. A broad hump at 2ϴ around ~ 18-23° in all these XRD traces attribute to amorphous like nature of SiO2 material. The XRD results of as-prepared sample shows weak nature of peaks indicating poor crystallinity. For the purpose of investigation about the effect of heat treatment on precursors, the as-prepared sample was calcined at low temperature around at 250°C for 2h. Results of XRD for the sample calcined at 250°C also showing weak type peaks pointing for poor crystallinity. Further, the as-prepared sample was heat treated at higher temperatures 500°C (2h) and 750°C (2h). Analysis of the fig.1 indicates that the rise in temperature leads to better crystallinity of the sample calcined at 500°C. In the diffraction patterns of sample, heat treated from 250°C- 500°C the peak at 2Ө ̴ 33° could be assigned as characteristic peak of α- Fe2O320 while peak centred at 2Ө ̴ 35° could be assigned as characteristic peak for synthesized material CoFe2O4:SiO2 (JCPDS PDF card no. 22- 1086). From the fig.1, the intensity of α-Fe2O3 peakis found higher than that at 2Ө ̴ 35°. It indicates that ferrite phase is leading the CoFe2O4 phase in this temperature range. Related literature reveals that ferrite silica composite has mostly been calcined in the temperature range 300- 700°C.21 For our interest to study the effect of recrystallization temperature on ferrite: silica composite, we calcined the as prepared sample at 750°C for 2h. The XRD pattern of this sample is showing sharp and intense peaks at 2Ө ̴ 30.10, 33.20(*), 35.57, 43.16, 54.10, 57.08, 62.65 which have also been indexed by comparing with (JCPDS PDF card no. 22-1086) to the cubic-spinel structure (Fd3M) of CoFe2O4. However, it is highly interesting to note that intensity of peak centred at 2ϴ ~ 35.57° has increased while that of centred at 2ϴ ~ 33. 20° is reduced for the sample at 750°C. This increase of sharp intensity peak centred at 2Ө value near about 35.57o reveals that CoFe2O4 particles have nucleated in the silica matrix.
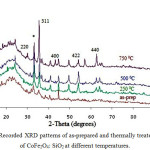 |
Figure 1: Recorded XRD patterns of as-prepared and thermally treated samples of CoFe2O4: SiO2 at different temperatures. |
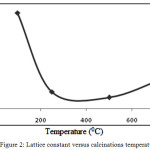 |
Figure 2: Lattice constant versus calcinations temperature.
|
The change in lattice parameters different temperatures is also reported in the fig.2. The lattice parameter of the sample shows a polynomial dependence on calcinations temperature. This variation in lattice parameters are mainly due to: (i) simple thermal changes, and (ii) the changes in cation distribution. The results of present investigation concludes that lattice constant decreases with increasing temperature up to 250°C and however, a sudden change in lattice constant with temperature is also observed which may be due to ordering-disordering transformation in the spinel. The grain size (DD-S) of nanocomposites was also estimated by Debye-Scherrer equation (1)22 and the size-strain plot have been shown in the fig. 3.3.
β = kλ / DD –S cosθ (1)
The mean crystallite size of CoFe2O4: SiO2 was estimated corresponding to the strongest reflection near about 35.57°C. It is a well known fact that the grain size and micro-strain produces peak broadening. This could be due to the stresses and faults inside the prepared spinel nanoparticles. The effects of grain size and strain have to be distinguished. Although, these both type effects are independent and may be understood with the help of size-strain plot. This plot for size-strain may also be known as Williamson-Hall plot. On the other hand, the particle size (DW-H)was also calculated by considering the stress broadening with the use of Williamson- Hall method.
β = kλ / DW-H cosθ + 4ɛ Sinθ (2)
where ɛ is stress coefficient.
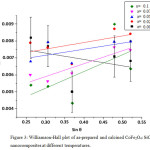 |
Figure 3: Williamson-Hall plot of as-prepared and calcined CoFe2O4: SiO2 nanocomposites at different temperatures. |
Micro-strain values have been obtained from slope of these fitted lines. The value of standard deviation estimated to be is 0.00121. The increase in particle size has been noticed from the W-H plot as compared to Debye- Scherrer equation. This increase in size by W-H plot method is due to the consideration of stress effects. By fitting the data, the average grain size (DW-H) and micro-strain (ε) are estimated and given in the table 1.The interplaner spacing (d) and lattice parameter (a) are determined to be 2.52536 Å and 8.376 nm respectively corresponding to the most prominent- peak (311) by using Bragg’s equation.
![]()
These values have been found in good agreement with the already reported results by other researchers[20]. Activation energy of nanoparticles is calculated from the Scott’s equation.
D= C exp (-E/RT) (4)
From the fig 4, an almost linear relationship between crystallite sizes and calcined- temperature indicates that crystallite grows primarily by means of an interfacial reaction in CoFe2O4: SiO2 and was easily affected by the calcinations conditions. The obtained value of activation energy,
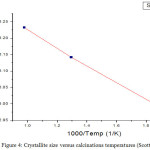 |
Figure 4: Crystallite size versus calcinations temperatures (Scott equation).
|
The X-ray density is estimated by using the formula,
ρx= 8M/N a3 (5)
whereas a ,N and M are lattice constant, Avogadro’s number and molecular weight respectively.
From the table 1, it could be seen that around the re-crystallization temperature dislocations (micro grains) creates strain and thus main lattice defect occurs, which decreases with further increase in temperature as written in the table 1.
Table 1 : Structural-parameters of CoFe2O4: SiO2 nanocomposites at different temperatures.
| Calcinations Temp.& Time | Crystallitesize DD-S(nm) | Average Crystallitesize DW-H(nm) | Strain(ε) | Lattice constant(Å) | X-ray density(g/cm3) |
| 250°C (2h) | 19.8 | 20.26 | 1.01 x10⁻² | 8.032 | 6.72 |
| 500°C (2h) | 27.15 | 28.95 | 2.72 x10⁻³ | 8.062 | 6.75 |
| 750°C (2h) | 35.34 | 38.76 | 3.75 x10⁻³ | 8.069 | 6.66 |
FTIR Study
The FTIR- spectra of different samples like (a) as-prepared and those calcined at (b) 250°C (c) 500°C and (d) 750°C for 2h in wave number 4000-400 cm-1 range is shown in the fig.5. Spectra related to as-prepared sample of CoFe2O4: SiO2 shows bands at 3398.5 cm-1 and 3404cm-1 which have been assigned to the stretching-vibration ( H-O-H) and surface silanol- group (Si-OH) respectively. From this spectrum, broadening of the band has been confirmed as a result of the water band overlaps with surface hydroxyl group vibrations. Further, the presence of strong absorptions at 1095.57, 798.53 and 464.84 cm-1 indicate about the formation of silica network.23 In our samples, the appearance of Si–O–Fe band at 956.69 cm-1 25 along with Si–O–H and Co–O bonds indicates about the chemical nature of transition metals. According to this, the transition metal ions do not involve directly in the sol–gel chemical process even though they were added into our starting solutions.24 In the sample’s spectra calcined at 250°C, band at 1650 cm-1 could be understood due to the deformation process of water molecules. For the samples thermally treated at 500°C, absorption band of SiO4 tetrahedron at 1095.57 cm-1 for Si–O–S vibration has further broadened more. However, O–Si–O symmetric bond stretching vibrations at 464.84cm-1and vibrational mode of Si-O-Si bond present at 800 cm-1 have become more weaker. This may be understood as rearrangement process in silica network.25 However, band centred around 956 cm -1 show an increase in the intensity that may be believed due to the absorption by Fe–O stretching in Fe–O–Si bonds. All these facts lead to the formation of CoFe2O4 clusters accompanied with the rearrangement of silica network. These nanocrystallies formation is believed to be possible with the enhancement of the Si–O–Fe bond between the CoFe2O4 clusters and surrounding silica network. Furthermore, for the samples heat treated at 750°C, the absorption at 1095 cm-1 for Si–O–Si of the SiO4 tetrahedron grows narrower and stronger, while the band at 956 cm-1 was disappeared.23 Poor quality development of ferrite-structure in our as-prepared sample is supported by the weakening of characteristic-band of ferrite (590 cm-1). In fact, this is in good agreement with our XRD results that have shown poor crystallinity in our as-prepared samples. Moreover, at high temperature absence of water molecules and Si-OH volatiles from our sample leads to densification of CoFe2O4:SiO2 justifying for the formation of nanocomposites which is confirmed by XRD results.
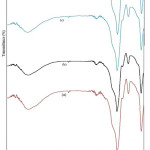 |
Figure 5: FTIR spectra of CoFe2O4:SiO2 nanocomposites calcined at different temperatures: (a) as-prepared (b) 250°C (c) 500°C and (d) 750°C. |
TEM Analysis
The morphology of the samples of CoFe2O4: SiO2 nanocomposites annealed at (a) 750°C and (b) 1000°C for 2 h has been analysed by TEM measurements as exhibited in the fig. 6. Average particle-size of nanocomposites annealed at (a) 750°C and (b) 1000°C is found approximately 35 nm and 38 nm respectively which are in good agreement with the value obtained by XRD data, 38.76 nm at 750x°C. It may be mentioned from resemblance of TEM results with XRD for particle size and then sharpness of XRD peaks that recorded micrographs indicate good quality samples and appearing approximate spherical shape CoFe2O4 nanoparticles with silica.26 As the existence of nanocomposites of CoFe2O4 embedded in silica network is supported by FTIR analysis. Histograms of CoFe2O4:SiO2 nanocomposites shown in the fig.7 annealed at (a) 750°C and (b) 1000°C reveal an important information that nearly 75% of crystallites are having their size range of 30-42nm representing a wide grain size distribution of crystallites.
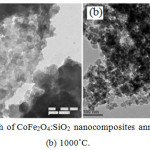 |
Figure 6: TEM micrograph of CoFe2O4:SiO2 nanocomposites annealed at (a) 750°C and (b) 1000°C. |
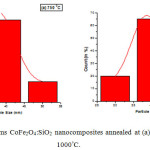 |
Figure 7: Histograms CoFe2O4:SiO2 nanocomposites annealed at (a) 750°C and (b) 1000°C. |
VSM Study
The M-H curves of samples observed at three different values of temperatures are shown in the fig8. Important magnetic parameters like saturation magnetisation (Ms), residual magnetization (Mr) and coercivity (Hc) have been listed in the table2. These results indicate that above mentioned all these magnetic properties of CoFe2O4:SiO2 nanocomposites show highly dependence behaviour upon the calcinations temperature. The value of Ms enhances from 53.6 ±0.1emu/g to 55.3±0.1 emu/g and from 55.3±0.1emu/g to 63.7±0.1emu /g with the increase of temperature from 250°C and 500°C and from 500°C to 1000°C respectively.However, these values of saturation magnetization of silica coated cobalt-ferrite nanocrystallites were found smaller as compared to their bulk size value of 80.8emu/g.27 This could be explained with the help of core- shell model, it states about the finite size effects of nanoparticles that lead to spin non-colinearity at surface, and consequently magnetization reduces.20 A similar kind evolution process may also be found for Mr, from 15.48 emu g−1 at 250°C to 21.48 emu g−1 at 500°C. But when samples are heat treated at 1000°C a decrease in Mr is observed leading to surface canting effects as seen from the table 2. It can be deduced from the evolution behaviours of Ms and Mr that are highly dependent upon the growth of CoFe2O4:SiO2 nanosize crystallites. As the calcinations temperature is raised from 250°C to 500°C an increase in the values of Mr, Ms and average crystallite-size has been observed, given in the table1. Thus, modification in magnetic properties of cobalt-ferrite has been attributed to variation of particle size as a function of temperature. From the data of table 2,it may be noticed from variation of Hc value that its behaviour is different as compared to Ms and Mr values which indicates that nanocrystallites is not the only factor in deciding Hc values. It has been concluded by many other researchers that value of Hc is highly related with many factors like microstructure, particle/grain size and residual strain.28-29 The coercivity (Hc) varied from 2363Oe to 2181 Oe with temperature from 250°C to 1000°C.The coercivity for pure CoFe2O4 nanoparticles is reported to be lower (980 Oe) as compared to CoFe2O4 / SiO2 nanoparticles.30 This large difference may be understood by the coating of SiO2 on CoFe2O4, that causes from surface effects.
Table 2: Magnetic parameters of CoFe2O4:SiO2 nanocomposites.
| Calcinations Temperature (oC) | Ms(emu/g) | Mr(emu/g) | Hc(Oe) | R= Mr/ Ms | |
| 250 | 53.6±0.1 | 15.48 | 2363 | 0.29 | |
| 500 | 55.3±0.1 | 21.48 | 2363 | 0.39 | |
| 1000 | 63.7±0.1 | 19.79 | 2181 | 0.31 | |
From the table 2, values of remnant ratio R=Mr/Ms indicate that direction of magnetization easily reorients to its nearest axis direction after removal of magnetic field.
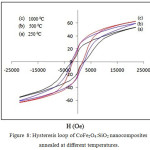 |
Figure 8: Hysteresis loop of CoFe2O4:SiO2 nanocomposites annealed at different temperatures.
|
Conclusions
Desirable samples of silica coated cobalt-ferrite nanocomposites have been successfully prepared with the help of co-precipitation method and then were further heat treated at different temperatures of 250°C, 500°C, 750°C and 1000°C. With the help of XRD data, the lattice constant has been found to increase from 8.032 Å to 8.069 Å by increasing the calcinations temperature from 250°C to 750°C respectively. Nearly about 75% of crystallites are having the size range 30-42nm from TEM investigations , indicates a wide grain size distribution of crystallites. Results of our research concluded that there is an increase in particle size, crystallinity, surface morphology and microstructure of nanocomposites with increasing calcinations temperature. Further , the value of saturation magnetization (Ms) is reported 53.6±0.1 emu/g and 63.7±0.1 emu/g corresponding to the calcinations temperature 250°C and 1000°C respectively. On the basis of VSM results at room temperature, it can be concluded that magnetic properties such as retentivity,saturation magnetization and coercivity revealed a strong dependence on the crystallite size and calcinations temperature. Furthermore, non-uniform behaviour of residual magnetization may be related to surface canting or spin’s non-colinearity in our synthesized nanocomposites.
Acknowledgements
The University of Delhi, New Delhi and IIT, Roorkee are gratefully acknowledged for providing characterization facilities.
References
- Mnyusiwalla, A.; Daar, A.S.; Singer, P.A. Mind the gap: science and ethics in nanotechnology, Nanotechnology, 2003, 14, R9.
CrossRef - Buot, F.A. Mesoscopic physics and nanoelectronics: nanoscience and nanotechnology, Physics Reports, 1993,234, 73-174.
CrossRef - Pardavi-Horvath, M. J. of Magn and Magn Mater., 2000, 215, 171-183.
CrossRef - Huang, X.H.; Chen, Z.H. Solid State Commun., 2004, 132, 845–850.
CrossRef - Jung, J.S.; Lim, J.H.; Choi, K.H.; Oh, S.L.; Kim, Y.R.; Lee, S.H.; Smith, D.A.; Stokes, K.L.; Maljinski, L.; Oconnor, C.J. J. Appl. Phys. 2005, 97, 10F306.
- Virden, A.E.; Ogrady, K. J. Appl. Phys. 2006, 99, 08S106.
- Ramankutty, C.G.; Sugunan, S. Appl. Catal. A: Gen. 2001,218.
- Harris, V.G.; Chen, Z.H.; Chen, Y.J.; Yoon, S.; Sakai, T.; Gieler, A.; Yang, A.; He, Y.X.; Ziemer, K.S.; Sun, N.X.; Vittoria, C. J. Appl. Phys, 2006, 99, 08M911.
- Jyotsnendu, G.; Theerdhala, S.; Saket, A.; Tumkur, G.R.; Arun, K.N.; Dhirendra, K.B. J. Magn. Magn. Mater., 2005, 293, 55.
CrossRef - Cullity, B.D. Elements of X-ray Diffraction, Addison-Wesley Reading MA, 1959.
- Huang, X.; Chen, Z. J. Magn Magn Mater, 2004, 280, 37–43.
CrossRef - Chien, C.L.; Annu.Rev. Mater. Sci, 1995, 25,129.
CrossRef - Sutka, A.; Mezinskis, G.Frontiers of Materials Science, 2012, 6, 128-141.
CrossRef - Mathew, D.S.; Juang, R.S. Chemical Engineering Journal, 2007, 129, 51-65.
CrossRef - Liu, C.; Zou, B.; Rondinone, A.J.; Zhang, Z.J. J. Am. Chem. Soc. 2000, 122 , 62-63.
- Pillai, V.; Shah, D.O. J. Magn. Magn. Mater. 1996, 163, 243.
CrossRef - Lee, J.G.; Park, J.Y. ; Kim, C.S. J. Mater. Sci. 1998, 33, 396.
- Yeong, K.I.; Don, K.; Choong, L.S. Physica B, 2003, 337, 42.
CrossRef - Morais, P.C.; Garg, V.K.; Oliveira, A.C. ; Silva, L.P.; Azevedo, R.B.; Silva, A.M.L.; Lima, E.C.D. J. Magn. Magn. Mater., 2001, 225, 37.
CrossRef - Xavier, S.; Thankachan, S.; Jacob, B. P.; Mohammed, E.M. Nanosystems: Phys.Chem.Math., 2013, 4, 430-437.
- Duhan, S.; Aghamkar, P.; Kishore , N.; Lal, B. Materials Chemistry and Physics, 2009, 114 103-106.
CrossRef - Shinde, T.J.; Gadkari, A.B.; Vasambekar, P.N. J. Mater. Sci. Mater. Electron. 2010, 21, 120-124.
CrossRef - Rohilla, S.; Kumar, S.; Aghamkar, P.; Sunder , S.; Agarwal, A. J. Magn.Magn. Mater. 2011, 323, 897–902.
CrossRef - Garcia Cerda, L.A.; Montemayor, S.M. J. Magn.Magn. Mater. 2005, 294, e43–e46.
CrossRef - Coey, J.M.D. Phys. Rev. Lett., 1971, 27, 1140–1142.
CrossRef - Xianghui, H.; Zhenhua;C. Chinese Sci Bull. 2006, 51, 2529-2534.
- Xiao, S.H.; Xu, H.J.; Hu, J.; Li, L.Y.; Li, X.J.Physica E, 2008, 40, 3064– 3067.
CrossRef - Liu, B.H.; Ding, J. Appl. Phys. Lett., 2006, 88, 042506-1.
CrossRef - Wang, Y.C.; Ding, J.; Yi, J.B.; Liu, B.H.; Yu, T.; Shen, Z.X. Appl. Phys. Lett., 2004, 84, 2596-2598.
CrossRef - Xiao, S. H.; Jiang, W. F.; Lia, L. Y.; Li, X. J. Mater. Chem. Phys, 2007, 106,82–87.
CrossRef

This work is licensed under a Creative Commons Attribution 4.0 International License.
![]()
A New Edition of Web of Science
Journal Impact Factor
2022: 0.5
Five Year: 0.8
Journal is Indexed in

Cabells Whitelist
![]()


