Removal of Malachite Green from Single and Multi-Dye Aqueous Solutions by Acid-Treated Sawdust
Abdur-Rahim Adebisi1, Giwa Khadijat Ayanpeju2*, Abdulsalam Francois Wewers1 and Mary Adelaide Oladipo3
1Department of Chemistry, Cape Peninsula University of Technology, Bellville, South Africa.
2Department of Basic Sciences, Adeleke University, Ede, Osun State, Nigeria.
3Department of Pure and Applied Chemistry, Ladoke Akintola University of Technology,Ogbomoso, Nigeria.
Corresponding Author E-mail: khadijatpeju@yahoo.com
DOI : http://dx.doi.org/10.13005/ojc/350419
Article Received on : 31-01-2018
Article Accepted on : 01-08-2019
Article Published : 24 Aug 2019
The study investigates the effectiveness and mechanism of the adsorption of malachite green from single and mixed dyes aqueous solutions by an adsorbent prepared from acid-treated Parkia biglobosa sawdust. The adsorbent was characterized using different techniques, and the adsorption was conducted in single, binary, ternary and quaternary dye systems under different experimental conditions. Experimental results were subjected to different isotherm and kinetics models. The adsorption process was endothermic and thermodynamically feasible with the removal efficiency increasing with increase in adsorbent dosage, solution working pH, initial dye concentration and contact time. The rate of sorption of the dye was fast; it attained equilibrium within 180 minutes in both the single and mixed solute systems. Pseudo-second order model gives the best kinetics fit (R2 = 0.998). The adsorption isotherm in all solute systems have best fits for the Temkin model (R2 > 0.96).
KEYWORDS:Adsorption; Dye Mixture; Malachite Green; Multi-Dyes Solution; Sawdust
Download this article as:| Copy the following to cite this article: Adebisi A. R, Ayanpeju G. K, Wewers A. F, Oladipo M. A. Removal Of Malachite Green From Single And Multi-Dye Aqueous Solutions By Acid-Treated Sawdust. Orient J Chem 2019;35(4). |
| Copy the following to cite this URL: Adebisi A. R, Ayanpeju G. K, Wewers A. F, Oladipo M. A. Removal Of Malachite Green From Single And Multi-Dye Aqueous Solutions By Acid-Treated Sawdust. Orient J Chem 2019;35(4). Available from: http://www.orientjchem.org/?p=59240 |
Introduction
Industrial processes generate wastewaters that may have a large amount of different types of dyes which are potentially toxic and even carcinogenic when discharged into the environment without any prior treatment. They are also aesthetically displeasing and are therefore harmful to plants and animals, including human beings.1 Hence, the need to remove organic dyestuff from effluents becomes environmentally important. 2
Among the numerous options for wastewater treatment, adsorption (coagulation and flocculation, membrane filtration, biological treatments, adsorption, advanced oxidation processes) is considered a promising technology.3 Though, adsorption in multi-adsorbate systems have been investigated,4 there have not been reports on adsorption of a dye from quaternary mixture of basic dyes, especially using acid-treated sawdust of locust bean tree (Parkia biglobosa). However, studies on the sorption of a basic dye and acid blue 161 respectively, from ternary dye mixture by this sawdust (in its raw, chemically untreated form) have been reported.5, 6
Methodology
Collection of Sawdust, Preparation and Characterization of Adsorbent
Sawdust of Parkia biglobosa, a common agro-forestry by-product in wood industries, is the precursor of the adsorbent used in this research. It was collected from a plank industry and market in Ogbomoso, Nigeria. The raw sawdust was sieved with 10-20 mesh and treated with concentrated H2SO4 acid in ratio 1:1 (W/V). It was then activated in an electric oven at 160 oC for 15 hours. Excess acid on the adsorbent was washed off with NaHCO3 solution (5% W/V), then with distilled water until a constant pH was obtained. It was then stored in an air tight container as acid-modified sawdust (AMS) adsorbent. Infrared Spectroscopy, Elemental Diffraction X-ray Spectroscopic method (EDS) and Scanning Electron Microscopy were employed to characterize the adsorbent.
Preparation of Wastewater
Wastewater used in this study was an aqueous solution of a mixture of four basic dyes (methylene blue, crystal violet, rhodamine B and malachite green). Malachite green (MG), with the wavelength of maximum absorbance (λmax) of 616 nm, was the analyte. A 1000 mg/L stock solution of each dye was prepared; working solutions of different concentrations were subsequently prepared from the stock.
Adsorption Processes
Experiments to determine the adsorption capacities of the adsorbent were all carried out in batch mode at different experimental conditions. The effect of pH was analyzed by manipulating the pH between 2 and 10. Effects of some other parameters [adsorbent dosage (0.1 g -1 g), time (5 – 300 min), temperature (30 – 60 oC) and initial dye concentration (10 mg/L – 100 mg/L)] were also investigated. A 30 ml volume of the dye mixture solution in a glass bottle was shaken with a known mass of AMS in a mechanical shaker for a predetermined length of time. The adsorbent-dye suspension was then filtered and the absorbance of the filtrate was taken at the wavelength of malachite green for residual dye content. The amount of dye removed is calculated in percentage as Removal efficiency (% R):
Co is the initial concentration of dye (before adsorption)and
Ce is the concentration at equilibrium (after adsorption) (mg/L); m is the mass of AMS (g); V is the volume of dye solution (L).
Adsorption Isotherms
The results of equilibrium experiments were subjected to six isotherm models to determine which of them would give the best fit.
Langmuir Isotherm
The linear equation of Langmuir isotherm model used is
Ce/qe = Ce/ qo + 1/ qob (3)
Where Ce is the equilibrium concentration of adsorbate (mg/L), qe is the amount of adsorbate absorbed per unit mass of adsorbent (mg/g), qo and b are Langmuir constants related to monolayer adsorption capacity and affinity of adsorbent towards adsorbate, respectively 7, 8
The dimensionless equilibrium parameters ‘r’ is given as

Freundlich Isotherm
The linear form of Freunlich isotherm is
Kf is a constant that rough indicates the adsorption capacity related to the bond energy, and points to the adsorption intensity 9, 10. If is lesser than 1, the adsorption is favourable but if it is greater than 1, the adsorption is unfavourable.11
Temkin Isotherm
The Temkin isotherm is as follows:12

qe is the amount of adsorbate removed at equilibrium (mg/g); Ce is the concentration of adsorbate at equilibrium; T is temperature (Kelvin); AT and bT are constants, and R is universal gas constant.
Harkin-Jura Isotherm
The Harkin-Jura model is expressed as

qe is the quantity adsorbed at equilibrium (mg/g), Ce is the residual concentration of adsorbate at equilibrium, A and B are Harkin-Jura constants.
Harkin-Jura equation considers multilayer adsorption in term of heterogeneity in the distribution of pores.13, 14
Dubinin- Radushkevich model
The linear equation of the isotherm is written as
In qe = In Xm – KE2 (8)
Where, K is the activity coefficient (mol2/ J2), is Polanyi potential, and qm is the maximum sorption capacity (mg/g). is given by
ε = RT In(1 +q–e-1) (9)
Sorption energy, E, can be evaluated from K thus
E= (2 K)– 1/2 (10)
qm may also represent the total specific micropore volume of the sorbent or the theoretical adsorption capacity.15
The term E is the free energy change associated with the movement of 1 mole of dye from infinity in solution to the adsorbent surface.
Adsorption Kinetics
The kinetics of the adsorption process was studied by applying the equations of Elovich, Intra-particle diffusion, Pseudo-first order and Pseudo-second order to the experimental data
The pseudo-first order equation is written as16
In (qe -qt) = In (qe)- k1t (11)
The Pseudo-second order adsorption kinetics model is given as16


Where h is the initial sorption rate.
The Elovich Kinetics model is simplified as17

Where α is the initial adsorption rate (mg/g. min), and b is the de-sorption constant (g/mg). The value of 1/β indicates the number of available sorption sites, while 1/βIn(αβ)
points to the amount adsorbed when ln t is zero.
The Intra-particle diffusion rate model (Weber-Morris equation) 18 is given as follows
qe = kdt1/2 + C (13)
Where, qe is the mass of adsorbate removeded (mg/g), kd is the intra-particle diffusion rate constant and t is the agitation time in minutes. C is the boundary layer thickness.
Error Functions
In addition to the usual way of validating kinetics models using the linear regression method, the sum-of-square error (SSE), is also employed in this study to determine the best fitting kinetics.19
The error function is given by

Where is the sorption capacity obtained experimentally; is the sorption capacity eva.uated from the model, and N is the number of data points.
The best goodness-of-fit is given by a model with the highest value of R2 and the lowest value of SSE.19
Adsorption Thermodynamics
The adsorption characteristics of AMS were evaluated in terms of three thermodynamics parameters [free energy (DG), enthalpy (DH), and entropy (DS) changes]. They are calculated using the following equations
ΔG = – RTIn k0 (15)
Where

and,
ΔG = ΔH – TΔS (17)
Where DG (KJmol-1) is the free energy change, K0 is adsorption equilibrium constant, R is the universal gas constant, qe is the amount of adsorbed and T is the absolute temperature (K),
Results And Discussion
Characterization of Acid-Modified Sawdust
SEM image showing the morphology of AMS surface is presented (Fig. 1). It reveals several pores on the surface of the adsorbent. Absorption peaks that are attributable to OH, COOH, C = O, C = S, and C = C functional groups, which are potential sites for the attachment of adsorbates, were also recorded in the infrared spectrum of AMS (Fig. 2). This clearly shows, as with most biomasses, the complexity of the composition of the adsorbent. The elemental analysis of sawdust, as presented in Fig. 3, shows a high % of carbon (66.77 %) which makes it a potentially good adsorbent, and a low level of sulfur which must have been introduced from the modifying agent, concentrated sulphuric acid.
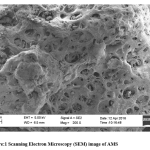 |
Figure 1: Scanning Electron Microscopy (SEM) image of AMS. |
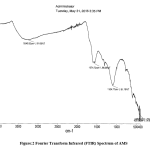 |
Figure 2: Fourier Transform Infrared (FTIR) Spectrum of AMS. |
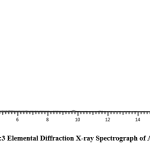 |
Figure 3: Elemental Diffraction X-ray Spectrograph of AMS. |
Effects of AMS Dose
The effect of AMS dose on the sequestration of malachite green from single, binary, ternary and quaternary solutions was studied by applying the dose in the range of 0.1 g – 1.0 g in 30 mL of 50 mg/L solution, at constant pH, contact time, concentration, and temperature) constant. As depicted in Figure 4, the percentage removal of malachite green increases with increasing dose of the adsorbent. The increase was more rapid in the adsorbent dose range of 0.1 – 0.6 g, beyond which the rate of increase in the removal reduces. This is more pronounced in the single and binary systems; the least being in the quaternary system. An increase in the sorption with AMS dose may be due to increased surface area and more available adsorption sites. Similar trend in the relationship between adsorbent dose and adsorption of pollutants from wastewater had been reported.20, 21
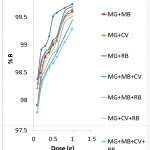 |
Figure 4: Effects of AMS dose on the removal of Malachite green from aqueous solutions of dyes. |
In adsorption systems, pH is an important factor as it affects the nature and characteristics of both the adsorbent and the species of the dye present, which eventually affect the uptake of dye.22,23, 24
The effect of pH on the adsorption of malachite green by AMS was investigated at different pHs of the artificial wastewater. The desired pH was obtained by introducing HCl or NaOH solution to the system in various amounts, while other parameters were kept constant at 0.1 g adsorbent dose, 30 mL of 50 mg/L solution at 30 OC. Figure 5 shows increased adsorption of malachite green with increasing pH until a maximum is reached. For example, an increase in pH from 4 to 6 brought a tremendous increase in the MG adsorption by AMS, but generally, the adsorption is higher in alkaline medium than in acidic environment. It has been reported in the literature that alkalinity enhances the adsorption of electropositive species like methylene blue and malachite green [25]. At low pH, excessive amount of H+ in the solution impart positive charges on AMS surface which then repel the cationic dye species electrostatically. This is in line with the reports on the adsorption of methylene blue, methyl red and malachite green which are all cationic dyes [26]. In alkaline medium, there is a decrease in the number of positively charged active sites on AMS due to a decrease in the concentration of H+, coupled with increasing amount of hydroxyl ions in the solution. The AMS surface then becomes effectively negatively charged. There is therefore an electrostatic attraction between the oppositely charged dye species and AMS surface, leading to an enhanced dye uptake. There is also a reduced repulsion between the adsorbent surface and the dye.25
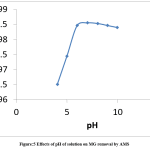 |
Figure 5: Effects of pH of solution on MG removal by AMS. |
Effects of Temperature
The percentage of malachite green removed from the wastewater in all the solute systems (single, binary, ternary and quaternary) increased slightly with increasing in temperature. This may be due to an increment in the dye molecules mobility of the as the energy of the system increased with increase in temperature. The increased uptake may also be due to the swelling of adsorbent pores which allows the penetration of more dye molecules at increased temperature.27
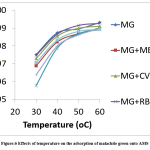 |
Figure 6: Effects of temperature on the adsorption of malachite green onto AMS. |
Effects of Contact Time
An increase in contact time brought about an increased MG dye adsorption of for all the dye systems studied. The rate of removal of the dye improved as contact time increased up to certain extent. As contact time is further increased, uptake of dye no longer increase, probably due to complete occupation of the adsorption sites on the adsorbent [28]. At this point, the rates of adsorption and desorption of the dye are equal, and a sort of dynamic equilibrium has been attained. Malachite green was rapidly adsorbed in single, binary, ternary and quaternary solutions within the first 150 minutes and then gradually until it reached equilibrium at 180 minutes (Fig. 7).
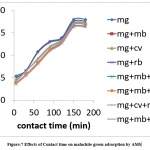 |
Figure 7: Effects of Contact time on malachite green adsorption by AMS. |
Effects of Initial Dye Concentration
There was a general initial increment in the adsorption of malachite green dye onto AMS with increments in the initial concentration up to 60 mg/L with the maximum removal of 98.54 %. The curves then formed plateaus after which the adsorption dropped slightly (Figure 8). At low initial dye concentrations the ratio of available binding cites to the amount of dye present in the solution is high. This, therefore, gives room for the dye molecules to be adsorbed easily. But, at higher initial dye concentrations, there was a decrease in the percentage removal when the number of binding sites got reduced, and dye the rate of dye sorption slowed down as a result of competition between dyes molecules for the decreasing available actives sites.29, 30
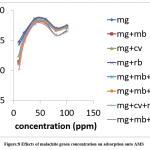 |
Figure 8: Effects of malachite green concentration on adsorption onto AMS. |
Adsorption Kinetics
The kinetics experimental data were fitted to the pseudo-first order, pseudo-second order, Elovich and Weber-Morris models. Rate constants and other kinetics parameters, together with their respective R2 values are given in Table 1. It is observed that the values for the four models are very high. The values are of 0.973 – 0.990 for pseudo-first-order, 0.998 for pseudo-second order, and 0.815 – 0.845 for Elovich models. Comparing the theoretical and experimentally qe, however, revealed that there is a wide gap between the qe values obtained from the pseudo-first-order model (1.0 – 1.11 mg/g) and experimental qe values (7.22 – 7.35 mg/g) for the eight different adsorbate composition studied (Table 1). For pseudo-second-order model, the calculated qe values (7.35 – 7.47 mg/g) were in close agreement to the experimental values (Table 1). This, in addition to the high R2 and low SSE values obtained for this equation, signifies its applicability to the interpretation of the adsorption of malachite green onto AMS being investigated. It, therefore, suggests that that the adsorption of the dye from single, binary, ternary and quaternary dye solutions by AMS takes place through chemisorption. This was also explained in some earlier reports.31, 32
To further study the mechanism of the adsorption process, the intra-particle diffusion equation of Weber-Morris was plotted. The values, intra-particle diffusion constant (Kd) and boundary layer thickness (C) from this kinetics equation were calculated and listed in Table 1. For all the dye systems investigated, the plots give straight lines (R2: 0.092 – 0.095) which, however, do not pass through the origin. This is an indication of the involvement of intra-particle diffusion, but other factors such as boundary layer resistance might have contributed to the sorption rate.32 -34
Adsorption Isotherm
The constants obtained from the five isotherm models considered are presented in Table 2. Temkin isotherm has the highest R2 values (0.967 – 0.980) for all the eight dye systems studied. This implies that, there is a linear relationship between the heat of adsorption and temperature [35]. Furthermore, Temkin model assumes that the decrease in the heat of adsorption (Hads) of all molecules in a layer with respect to increasing coverage is linear.
The maximum monolayer adsorption capacity ranges between 20.00 and 26.32 mg/g. These values are higher than the values gotten by Makeswari and Santhi [35] for adsorption of malachite green from binary systems (11.76 – 20.41). The value of r (a dimensionless constant which indicates the type of isotherm) for the systems studied ranges between 0.024 and 0.053. This means that the adsorption is favourable as values greater than one would have implied an unfavourable adsorption, and r equals to zero indicates an irreversible process.37 -38
The favourability of the sorption processes was also confirmed by the Freundlich constant, , which is less than one (0.50 -0.64) for all of them (Table 2). A value greater than 1 would have meant the adsorption is unfavourable [26]. The value of E (Energy of sorption) in Dubinin- Radushkevich isotherm is low (0.79 – 1.19), implying that the sorption processes may not involve an ion exchange mechanism as opposed to a higher value of E (> k Jmol-1) which would have pointed to involvement of ion-exchange.39
Table 1: Kinetic parameters for the adsorption of Malachite Green.
| Pseudo first order | Pseudo second order | Elovich |
Weber-Moris |
|||||||||||||
|
Dye system |
qe exp | R2 | K1 | qe cal | SSE | R2 | K2 | H | qe | SSE | R2 | µ | b | R2 | Kd |
C |
|
MG |
7.35 | 0.973 | 0.010 | 1.048 | 2.82 | 0.998 | 0.034 | 1.90 | 7.465 | 0.042 | 0.823 | 5.06×10⁸ | 3.68 | 0.952 | 0.092 |
6.104 |
|
MG+MB |
7.26 | 0.981 | 0.010 | 1.113 | 2.75 | 0.998 | 0.033 | 1.812 | 7.407 | 0.057 | 0.815 | 2.04×10⁸ | 3.60 | 0.955 | 0.095 |
5.974 |
|
MG+CV |
7.29 | 0.988 | 0.011 | 1.080 | 2.78 | 0.998 | 0.031 | 1.709 | 7.407 | 0.045 | 0.829 | 3.39×10⁸ | 3.65 | 0.961 | 0.093 |
6.036 |
|
MG+RB |
7.31 | 0.979 | 0.011 | 1.043 | 2.80 | 0.998 | 0.036 | 1.949 | 7.407 | 0.038 | 0.845 | 4.26×10⁸ | 3.66 | 0.962 | 0.092 |
6.085 |
|
MG+MB+MG |
7.23 | 0.980 | 0.011 | 1.102 | 2.74 | 0.998 | 0.032 | 1.745 | 7.353 | 0.045 | 0.820 | 2.45×10⁸ | 3.64 | 0.958 | 0.094 |
5.965 |
|
MG+MB+RB |
7.26 | 0.981 | 0.010 | 1.113 | 2.75 | 0.998 | 0.031 | 1.715 | 7.407 | 0.057 | 0.815 | 2.04×10⁸ | 3.60 | 0.955 | 0.095 |
5.974 |
|
MG+CV+RB |
7.28 | 0.990 | 0.010 | 1.075 | 2.77 | 0.998 | 0.033 | 1.812 | 7.407 | 0.049 | 0.835 | 3.20×10⁸ | 3.65 | 0.964 | 0.093 |
6.022 |
|
MG+MB+CV+RB |
7.22 | 0.980 | 0.011 | 1.087 | 2.74 | 0.998 | 0.032 | 1.749 | 7.353 | 0.049 | 0.816 | 3.31×10⁸ | 3.69 | 0.956 | 0.092 |
5.963 |
Table 2: Isotherm Parameters For The Adsorption Of Malachite Green.
| ISOTHERM | LANGMUIR | FREUNDLICH | TEMKIN | HARKIN-JURA | DUBININ-RADUSHKEVICH | ||||||||||||
| ISOTHERM PARAMETERS | R2 | qo | B | R | R2 | 1/n | Kf | R2 | AT | bT | R2 | A | B | R2 | qm | K | E (KJmol-1) |
| DYE SYSTEM | |||||||||||||||||
| MG | 0.898 | 20.41 | 0.75 | 0.026 | 0.922 | 0.52 | 8.32 | 0.968 | 2.12 | 319.98 | 0.846 | 32.26 | 0.55 | 0.924 | 21.31 | 4×10⁻⁷ | 1.19 |
| MG + MB | 0.826 | 24.39 | 0.43 | 0.044 | 0.916 | 0.61 | 7.21 | 0.979 | 1.35 | 249.17 | 0.828 | 27.03 | 0.57 | 0.842 | 27.94 | 7×10⁻⁷ | 0.85 |
| MG + CV | 0.871 | 22.73 | 0.54 | 0.036 | 0.929 | 0.57 | 7.35 | 0.979 | 1.57 | 269.37 | 0.854 | 29.41 | 0.56 | 0.886 | 26.66 | 6×10⁻⁷ | 0.91 |
| MG + RB | 0.906 | 20.00 | 0.82 | 0.024 | 0.922 | 0.50 | 8.51 | 0.967 | 1.89 | 292.75 | 0.846 | 33.33 | 0.53 | 0.845 | 22.42 | 4×10⁻⁷ | 1.12 |
| MG + MB + CV | 0.859 | 20.83 | 0.50 | 0.038 | 0.893 | 0.54 | 6.87 | 0.968 | 1.33 | 288.36 | 0.809 | 30.30 | 0.67 | 0.875 | 25.15 | 7×10⁻⁷ | 0.85 |
| MG + MB + RB | 0.802 | 26.32 | 0.36 | 0.053 | 0.923 | 0.64 | 6.92 | 0.980 | 1.30 | 246.01 | 0.836 | 26.30 | 0.58 | 0.870 | 28.33 | 8×10⁻⁷ | 0.79 |
| MG + CV + RB | 0.848 | 23.81 | 0.47 | 0.041 | 0.918 | 0.59 | 7.41 | 0.980 | 1.51 | 267.62 | 0.829 | 28.57 | 0.57 | 0.880 | 26.60 | 6×10⁻⁷ | 0.91 |
| MG + MB + CV +RB | 0.880 | 22.22 | 0.41 | 0.047 | 0.941 | 0.57 | 6.49 | 0.975 | 1.22 | 278.97 | 0.882 | 28.57 | 0.024 | 0.902 | 24.63 | 8×10⁻⁷ | 0.79 |
Adsorption Thermodynamics
The parameters of thermodynamics for the adsorption processes are given in Table 3. Within the range of temperatures investigated (303 – 333 K), the values of ∆G for all the processes are negative (-2.93 to -8.76 kJmol-1), while those of ∆H are positive (29.10 – 42.00 kJmol-1). These imply that all the adsorption processes are thermodynamically feasible and are endothermic. There is also increased entropy as values of ∆S are positive (118.20 – 148.62 Jmol-1K-1). Similar results of adsorption thermodynamics have been reported5, 40
Table 3: Thermodynamics of Malachite Green Adsorption onto AMS
| Temperatures (K) | ||||||||
| Component | Parameters* | 303 | 313 | 323 | 333 | |||
| MG | DG | -4.67 | -5.96 | -7.25 | -8.54 | |||
| DH | 3.45 x10⁴ | |||||||
| DS | 129.26 | |||||||
| MG+MB | DG | -4.01 | -5.20 | -6.38 | -7.56 | |||
| DH | 3.18 x10⁴ | |||||||
| DS | 118.20 | |||||||
| MG+CV | DG | -4.43 | -5.63 | -6.82 | -8.02 | |||
| DH | 3.18 x10⁴ | |||||||
| DS | 119.58 | |||||||
| MG+RB | DG | -4.73 | -6.07 | -7.41 | -8.76 | |||
| DH | 3.59 x10⁴ | |||||||
| DS | 134.10 | |||||||
| MG+MB+CV | DG | -4.20 | -5.30 | -6.40 | -7.50 | |||
| DH | 3.94 x10⁴ | |||||||
| DS | 141.01 | |||||||
| MG+MB+RB | DG | -3.57 | -4.87 | -6.17 | -7.47 | |||
| DH | 3.58 x10⁴ | |||||||
| DS | 129.95 | |||||||
| MG+CV+RB | DG | -4.20 | -5.30 | -6.40 | -7.50 | |||
| DH | 2.91 x10⁴ | |||||||
| DS | 109.90 | |||||||
| MG+MB+CV+RB | DG | -2.92 | -4.41 | -5.90 | -7.40 | |||
| DH | 4.2 x10⁴ | |||||||
| DS | 148.62 | |||||||
*DG is in kJmol-1, DS is in Jmol-1K-1, DH is in kJ mol-1
Conclusion
The adsorbent has been shown to be highly porous, with high carbon content (66.77 %), and various functional groups including hydroxyl, carbonyl and carboxyl which make it a potentially good adsorbent. The adsorption of malachite green increased with increasein the initial pH and temperature of the solution. The isotherms in both the single and mixed dye systems studied are best described by Temkin model with regression coefficient ranging between 0.967 and 0.980. The adsorption of MG onto AMS was defined to be chemisorption by kinetics obeying the pseudo-second-order model and as physiosorption by the value of E (Energy of sorption) of Dubinin-Radushkevich isotherm model, hence it is a co-adsorption. The adsorption processes are thermodynamically feasible, endothermic, and is suspected have occurred by chemisorption mechanism. The adsorbent, therefore, exhibited a promising potential for the treatment of wastewaters containing mixture of dyes.
Acknowledgements
Authors acknowledge the financial assistance rendered by Cape Peninsula University of Technology towards publishing this research.
Conflict of Interest
There is no conflict interest.
References
- Ashrafi, S. D.; Rezaei, S.; Forootanfar, H.; Mahvi, A. H.; Faramarzi, M. A. Int Biodeter Biodegr. 2013, 85,173-181.
- Hameed, B. H. J Haz Mat. 2009, 161,753-759.
- Attia, A. A.; Rashwan, W. E.; Khedr, S. A. Dyes pig. 2006, 69, 128-136.
- Gupta, V. K.; Suhas, T. L. J Environ Manag. 2009, 90, 2313-2342.
- Giwa, A. A., Oladipo, M. A.; Abdulsalam, K. A. J. of Chem and Pharm Res. 2015, 7(2), 454-475.
- Giwa, A. A.; Abdulsalam, K. A.; Wewers, F.; Oladipo, M. A. Journal of chem. 2016, 6436039, 1-31.
- Langmuir, I. The adsorption of gases on plane surfaces of glass, mica and platinum. J. Am. Chem. Soc. 1918, 40, 1361-1403.
- Ho, Y. S.; Huang, C. T.; Huang, H. W. Proc. Biochem. 2002, 37, 1421-1430.
- Freundlich, H. M. F. Zeitschrift für Physikalische Chemie 1906, 57A, 385–470.
- Naveen, P.; Viswanathan, S.; Remuka, D.; Johanna, R.; Parthasarathy American-Eurasian J. of Scientific Res. 2008, 3(2), 123-127.
- Juang, L. C.; Wang, C. C.; Chung-Kung, L.; Ting-Chu, H. J. Environ. Engr. Manage. 2007, 17(1), 29-38.
- Pandey, K.; Sharma, S. K.; Sambi, S. S. Int. J. Environ. Sci. Tech., 2010, 7 (2), 395-404.
- Basar, C. A. J Hazard Mater B 2006, 135, 232-241.
- Oladoja, N. A.; Asia, I. O.; Aboluwoye, C. O.; Oladimeji, B.; Ashogbon, A. O. Turkish J Engr Environ Sci. 2008, 32, 143-152.
- Erdem, E.; Karapinar, N.; Donat, R. J colloid and interface sci. 2004, 280, 309-314.
- Ho, Y.S. J. Hazard Mater. 2006, 136 (3), 681-689.
- Ahmad, M. A.; Ahmad, N.; Bello, O. S. Water Air Soil Pollut. 2014, 225, 2057.
- Giwa, A. A.; Bello, I. A.; Olajire, A. A. Chem Proc Eng Res. 2013, 13, 51-68.
- Arsanoglu, F. N.; Kar, F.; Arsan, N. Journal of Food Eng. 2005, 68, 409-417.
- Azhar, S.; Liew, A. G.; Suhardy, D.; Hafiz, K. F.; Hatim, M. D. I. Am J Appl Sci. 2005, 2 (II), 1499-1503.
- Esmaili, A.; Ghasemi, S.; Rustaiyan, A. American-Eurasian J Agric & Environ Sci. 2008, 3(6), 810-813.
- Zawani, Z.; Luqman; Chuah, A.; Thomas, S.; Choong, Y. Euro J Sci Res. 2009, 37(1), 67-76.
- Nagarethinam, K.; Soundrapandian, M. EJEAFChe. 2007 6(3), 1860-1868.
- Yasin, M. H.; Faujan, H. A. The Malaysian J Anal Sci. 2007, 11(11), 400-406.
- Hussein, M.; Amer, A. A.; El-Maghraby, A; Taha, N. A. J Appl Sci Res. 2007, 3 (11), 1352-1358.
- Santhi, T.; Manonnxni, S.; Smitha, T. Intl J Engr Sci and Technol. 2010, 2(3), 287-295.
- Verma, V. K.; Mishra, A. K. Global Nest Journ. 2010, 12(2), 190–196.
- Ansari, R.; Mosayebzadeh, Z. J Iran Chem Soc. 2010 7(2), 339-350.
- Mishra, S.; Prakash, D. J.; Ramakrishna, G. Elect Journ of Environ Agric and Food Chem. 2009, 8, 425-436.
- Gupta, S.; Kumar, D.; Gaur, J. P. Chem Eng Journ. 2008, 148, 226-233.
- Gucek, A.; Sener, S.; Bilgen, S.; Mazmanci, A. J. Colloid Interf. Sci. 2005, 286, 53- 60.
- Weber, Jr.; Morris, J. C. J of the Sanitary Eng Div-ASCE. 1963, 89, 31-59.
- Poots, V. J. P.; Mckay, G.; Healy, J. J. Wat. Res. 1976, 10, 1067-1070.
- Alzaydien, S. A. Jordanian tripoli, Am. J. Environ Sci. 2009, 5(3), 197-208.
- Makeswari, M.; Santhi, T. J of Wat Res and Prot. 2013, 5, 222-238.
- Bello, O. S.; Adeogun, A. I.; Ajaelu, J. C.; Fehintola, E. O. Chem and Eco. 2008, 4(24), 285-295.
- Chiu, H.; Wang, J. JEPS, 2009, 3, 102-106.
- Ho, Y. S. Water Res. 2003, 37, 2323–2330.
- Islam, M.; Patel, R. K. J Haz Mat. 2007, 143, 303-310.
- Inbaraj, B. S.; Sulochana, N. Ind J Chem Technol. 2006, 13, 17-23.

This work is licensed under a Creative Commons Attribution 4.0 International License.


