Relationship between MODIS-based Aerosol Optical Depth and PM10 over Sumatra to Overcome the Limitations of Air Quality Monitoring Data Availability
Syafrijon1,2, Marzuki3 , Emriadi1 and Ridho Pratama2
1Department of Chemistry, Faculty of Mathematics and Natural Science, Andalas University Limau Manis Campus, Pauh, Padang – 25163, Indonesia.
2National Institute of Aeronautics and Space, Agam, Indonesia.
3Department of Physics, Faculty of Mathematics and Natural Science, Andalas University Limau Manis Campus, Pauh, Padang – 25163.
Corresponding Author E-mail: marzuki@sci.unand.ac.id
DOI : http://dx.doi.org/10.13005/ojc/3404058
Article Received on : 21-02-2018
Article Accepted on : 06-04-2018
Article Published : 26 Jul 2018
The present study uses the aerosol optical depth (AOD) obtained from the Moderate Resolution Imaging Spectroradiometer (MODIS) satellite as a proxy to estimate the surface particulate matter (PM) concentrations over Sumatra. The daily average PM10 data collected during 2015 from three air quality stations across Sumatra, i.e., Kototabang, Jambi and Pekanbaru, were analyzed. The 2015 Indonesian forest fire significantly increased the PM10 concentrations and MODIS AOD values. The ratios of the mean PM10 concentrations and AOD values during the peak forest fire period to those during the period of normal conditions varied from 6 to 9. MODIS AOD may be a good indicator of the near-surface PM10 concentrations over Sumatra, as the correlation coefficients of the linear regressions were 0.86 (Kototabang), 0.80 (Jambi), and 0.81 (Pekanbaru). The linear regression functions of PM10 and satellite-observed AOD can be used to estimate the surface PM10 concentrations, and the correlation coefficient is 0.84.
KEYWORDS:Aerosol Optical Depth; MODIS; PM10; Sumatra
Download this article as:| Copy the following to cite this article: Syafrijon S, Marzuki M, Emriadi E, Pratama R. Relationship between MODIS-based Aerosol Optical Depth and PM10 over Sumatra to Overcome the Limitations of Air Quality Monitoring Data Availability. Orient J Chem 2018;34(4). |
| Copy the following to cite this URL: Syafrijon S, Marzuki M, Emriadi E, Pratama R. Relationship between MODIS-based Aerosol Optical Depth and PM10 over Sumatra to Overcome the Limitations of Air Quality Monitoring Data Availability. Orient J Chem 2018;34(4). Available from: http://www.orientjchem.org/?p=47682 |
Introduction
Particulate matter (PM) is currently a major air quality issue that substantially influences the climate,1 the environment2 and human health.3,4 In situ observations of PM concentrations are therefore necessary to link air pollutants with the studied issues. Some observations have been conducted in various climatic regimes by investigators.5, 6 However, the observations are often sparse around the world, particularly in the equatorial region due to the difficulties in the sampling techniques that are expensive. To overcome these limitations, many studies have attempted to use satellite data, especially aerosol optical depth (AOD), to estimate the surface concentrations of both PM2.5 and PM10.5,7-11 Satellite observations have large-scale spatial coverages; thus, they can indicate the spatial distribution of PM concentrations. However, the relationship of AOD and PM varies from place to place with a wide range of correlations. Therefore, it is worthwhile to study this relationship in many different climatic regions.
Sumatra Island is a zone in Indonesian where the variability of air quality is significantly influenced by fire activity due to human intervention. Fire activity has become an annual phenomenon that dramatically increases anthropogenic and biomass burning emissions.12 Fire is widely used for land preparation and forest clearance by plantation developers, shifting cultivators and small-holder farmers, and these fires often escape and develop into uncontrollably burning wild-fires.13 The majority of fires occur between June and November, which is coincident with drier weather conditions. For example, the 2015 Indonesian forest fire, which had a dramatic impact on the amount of landscape that burned across large parts of Indonesia, was driven by a strong El Niño event. Fires of extreme magnitude occurred during September and October 2015. The largest number of fires was observed in six provinces in Indonesia namely, Riau, Jambi, South Sumatra, Central Kalimantan and South Kalimantan. Thus, the majority of the regions that are most affected by fire are located in areas dominated by peatlands.14
Although Indonesia, and Sumatra in particular, has serious environmental problems due to annual forest fire activity, a reasonable and high-resolution dataset of biomass burning emissions such as PM concentration over this region is limited.15-16 Therefore, satellite data will be used to overcome this problem. However, the regression functions between the MODIS-based AOD and PM10 vary among different regions, so the functions for other regions may not be suitable for Sumatra. Hence, a concrete analysis of the relationship between PM concentration and AOD over this region is essential. In this study, we selected three stations on Sumatra Island to analyze the characteristics of PM10 concentrations. The three stations are located in Kototabang, Pekanbaru and Jambi. Furthermore, we analyzed the correlation between PM10 concentration and moderate-resolution imaging spectroradiometer (MODIS) AOD during 2015.
Data and Methodology
Surface PM10 Mass Concentration
Hourly surface PM10 mass concentration data were obtained from the Indonesian Agency for Meteorological, Climatological and Geophysics (IAMCG). The PM10 aerosol concentrations were measured using a portable TSI Dust Trak II.17 The TSI Dust Trak II is a real-time laser photometric instrument that is capable of measuring aerosol mass concentrations. The instruments are installed at three locations in Sumatra (Fig. 1), i.e., Kototabang (0.20°S, 100.32°E, 885 m above mean sea level (AMSL)), Jambi (1.63°S, 103.59°E, 30 m AMSL) and Pekanbaru (0.49°N, 101.42°E, 10 m AMSL).
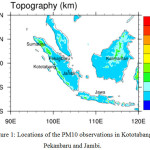 |
Figure 1: Locations of the PM10 observations in Kototabang, Pekanbaru and Jambi.
|
This study analyzed the data from 2015. The availability of the data for each location during this period differed. The number of PM10 observation days at Jambi is 195 from February to October 2015. At Kototabang, PM10 measurements are available over ten consecutive months from January-October (294 days). Finally, measurements from at Pekanbaru are also available over approximately ten consecutive months (January-October; 284 days). Thus, at each location, PM10 measurements were unavailable during November and December. Nevertheless, measurements were available during September-October when the peak of the 2015 Indonesian forest fire occurred.
MODIS AOD Dataset
The present study uses aerosol optical depth (AOD) data (at 550 nm) from MODIS Terra (MOD08_D3) Level-3 Collection 6 (C006). The time series data of the daily mean AOD (hereinafter called AOD) within a 1 x 1 degree pixel for each PM measurement location were generated from the MOD08_D3_6_Aerosol_ Optical_Depth_Land_ Ocean_ Mean file using Giovanni software (http://giovanni.sci.gsfc.nasa.gov). The MODIS/Terra Level-3 daily gridded atmospheric data had previously been used to study the variation in the relationship between PM10 concentration and MODIS AOD over China.21
The MODIS provides regular observations of AOD that have enhanced our understanding of the effects of anthropogenic aerosols at both local and global scales.18,19 MODIS has 36 spectral channels, a temporal resolution of 1 to 2 days and moderate spatial resolutions that vary from 0.25 to 1 km. While it is not a major overhaul from the previous Collection 5 (C5) version, the MODIS Collection 6 dataset is an improvement over earlier collections.20 These improvements include several updates such as assumptions for central wavelengths, Rayleigh optical depths and gas absorption corrections, and poleward coverage increases. Furthermore, the cloud mask has been updated to allow heavy smoke retrievals. The C6 algorithm has also been expanded to retrieve over-vegetated sites.
While the number of PM10 observation days at the three locations is sufficient, the amounts of collected PM10 and MODIS data are relatively small for Jambi and Pekanbaru. The numbers of observation days for Kototabang, Jambi and Pekanbaru are 137, 28 and 35, respectively.
Results and Discussion
Time Series of AOD and PM10
Fig. 2 shows the time series of the AOD and PM10 concentration for each location. For the whole dataset over the entire observation period, the average PM10 concentration at Kototabang along with its standard deviation was 50.4 ± 68.14 mg/m3. Furthermore, the average concentrations for Jambi and Pekanbaru were 104.7±185.08 mg/m3 and 99.2±112.19 mg/m3, respectively. These values are higher than the concentration limits of the annual mean of PM10 concentration from the Indonesian ambient air quality standards (70 mg/m3). The PM10 concentrations were larger in Jambi and Pekanbaru than in Kototabang, indicating that Jambi and Pekanbaru suffered from more serious particle pollution than Kototabang. This result is consistent with the average AOD, and the values for Kototabang, Jambi and Pekanbaru were 0.48 ± 0.67, 0.93 ± 1.04 and 0.83 ± 0.95, respectively. Kototabang is located in a tropical forest that is far from residential and industrial areas, so the PM10 concentrations at this location are smaller than those at the other two locations.
When there were no forest fires (January-June), the PM10 concentrations were lower than the concentration limits of the daily mean PM10 concentrations from the Indonesian ambient air quality standards (150 mg/m3). The mean PM10 concentrations during January-June at Kototabang, Jambi and Pekanbaru are 21.7 ± 8.36 mg/m3, 22.5 ± 9.39 mg/m3, and 45.4 ± 22.35 mg/m3, respectively. Furthermore, the mean AOD values for each location during the same period are 0.22 ± 0.13, 0.39 ± 0.16, and 0.40 ± 0.17. The mean PM10 concentration at Pekanbaru in normal conditions (during the period without forest fires) is two times higher than the values for Jambi and Kototabang. Thus, the Pekanbaru area is more polluted than the other two regions because Pekanbaru is an industrial area.16
The 2015 Indonesian forest fire increased the concentration of PM10 and the AOD value significantly. The mean PM10 concentrations for Kototabang, Jambi and Pekanbaru during September-October (peak of forest fire) are 182.66 ± 96.92 mg/m3, 305.88 ± 245.2 mg/m3 and 284.73 ± 153.95 mg/m3, respectively. Moreover, the corresponding average AOD values for each location are 1.94 ± 0.96, 2.79 ± 0.98 and 2.91± 0.65. The maximum AOD values at Kototabang, Jambi and Pekanbaru are 3.77, 4.64 and 3.93, respectively. These values are consistent with the maximum daily mean PM10 concentrations in Kototabang, Jambi and Pekanbaru, which are 446.0, 869.1 and 580.3 mg/m3, respectively. It can be clearly seen that the PM10 concentrations and the AOD during September and October are much higher in Jambi and Pekanbaru than in Kototabang, indicating that these regions suffered from more serious particle pollution due to the 2015 Indonesian forest fire.This pattern is consistent with the number of fire alerts from MODIS satellite data. The numbers of fire alerts during September and October in west Sumatra, Riau, and Jambi were 275, 2954, and 5794, respectively.22
The influence of forest fires on the particulate matter increases can also be observed from the ratio of the mean PM10 concentration and AOD during September-October to those during January-June. The ratios of the mean PM10 concentrations for Kototabang, Jambi and Pekanbaru are approximately 8.42, 13.61, and 6.28, respectively. Furthermore, the corresponding ratios for the average AOD are 8.81, 7.07, and 7.31. The PM10 concentration at Pekanbaru was already high during normal conditions, so the ratio of the mean PM10 concentration during the forest fire period to that during normal conditions was slightly lower than the ratios of the other two regions. It can be seen that the ratios of the mean PM10 concentration and mean AOD during the forest fire period to those during the normal conditions are almost the same, except Jambi. The ratio of the mean PM10 concentration for Jambi is much higher than that for the other two sites, which is not observed in the ratio of AOD.
Relationship of AOD and PM10 Concentration
The correlation between AOD and PM10 concentration can be initially observed from Fig. 2. The increase in PM10 concentration is always followed by an increase in the AOD value, which is clearly observed during forest fires, namely, from July to October 2015. To quantitatively retrieve the relationship between AOD and the PM10 concentration, we estimated the correlation between the daily mean PM concentration and MODIS AOD using the linear regression given by PM10 = a + bAOD, where a is the intercept, which represents the PM10 concentration when the satellite-derived AOD is zero, and b is the slope, which represents the PM10 concentration per unit AOD. Simple linear regression models have been widely used to relate PM concentrations to MODIS AOD.10, 23, 24
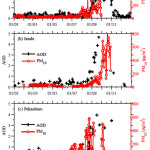 |
Figure 2: Time series of the daily mean PM10 concentrations and MODIS AOD values for Kototabang (a), Jambi (b) and Pekanbaru (c) during 2015. |
Fig.3 shows the scatter plot between the MODIS AOD and PM10 concentrations during 2015 in Kototabang, Jambi and Pekanbaru. The correlation coefficients (r) from the linear regression analyses at these sites are 0.86, 0.80, and 0.81, respectively, which are similar to the results of previous studies that linked the MODIS AOD and surface PM10 concentrations in Romania7 and Beijing9. The linear regression functions for Kototabang, Jambi and Pekanbaru are y = 103x + 3.82, y = 35x + 7.42 and y = 96x + 24.92, respectively. The slopes of the linear regression functions at the three locations vary from 35 to 103, and the intercept values vary from 3.82 to 24.92. These values are consistent with those obtained in previous studies that linked MODIS AOD and surface PM10 mass concentrations.7-9,23,24 The slope of the observations in Kototabang is similar to that in Pekanbaru. On the other hand, the slope of the observations in Jambi is much smaller than those in Pekanbaru and Jambi. It is noted that the number of samples used for the linear regression (N) in Jambi are small compared to the numbers used for the other locations. There are a significant number of missing values in the MODIS AOD data, especially from September to October when the PM10 mass concentrations are relatively high compared to the other months (Fig. 2). The linear regression function using all data is y = 60x + 18.06, and the correlation coefficient of 0.71. Furthermore, if only data at Kototabang and Pekanbaru are considered, the function is y = 103x + 7.32, and the correlation coefficient is 0.85 (Fig. 3d).
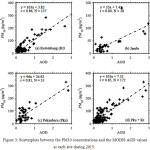 |
Figure 3: Scatterplots between the PM10 concentrations and the MODIS AOD values at each site during 2015. |
The correlation coefficient of the linear regression (r) and the number of PM10 and AOD samples (N) for the linear relationship analysis are also described.
To evaluate the accuracy of the aforementioned linear regression function in the PM10 estimation, we compared the “measured” PM10 concentrations (directly measured by the TSI Dust Trak II) with the PM10 concentrations estimated by MODIS AOD values as in a previous study.25 The accuracy of the function y = 103x + 7.32 is given in Fig. 4. The accuracies of the functions for Pekanbaru and Kototabang are sufficient with regression coefficients larger than 0.85, while the accuracy of the function for Jambi is low with a regression coefficient of 0.49.
Significant improvement of the root-mean-square error (RMSE) was achieved by increasing the number of data. By combining the data from Pekanbaru and Kototabang (Fig. 4d), the RMSE significantly improved from 206 and 245, respectively, to 23.8 mg/m3. The relation in the present study was governed by the short data period, so we will revisit the issue once long-term data are available in the future. Furthermore, we are also collecting surface PM10 concentration data from other locations in Indonesia because the region has significant spatial and temporal variations of meteorological parameters.26, 27 Thus, the regional variations in the function that links the MODIS AOD and surface PM10 mass concentrations will also be significant. The accuracy of the model may also be influenced by the season.9,10, 21 The seasonal variations in the function that links the MODIS AOD and surface PM10 mass concentrations can be revisited once long-term data are available. Furthermore, the performance of the regression function can be improved by correcting the MODIS AOD before it is applied to estimate the surface PM10 concentration. The AOD data can be corrected using the height of the plenary boundary layer, surface relative humidity, visibility, surface temperature, surface wind speed, wind direction, water vapor and surface pressure. Once such meteorological data are available, a nonlinear model can be used to improve the estimation of ground-level PM10 concentrations by adding the meteorological variables into the model.8,11
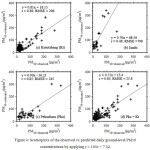 |
Figure 4: Scatterplots of the observed vs predicted daily ground-level PM10 concentrations by applying y = 103 x + 7.32. |
The number of data used for testing the relationship is the same as in fig 3.
Conclusions
The present study showed that the 2015 Indonesian forest fire significantly increased the PM10 concentrations and MODIS AOD values. The forest fire increased the PM10 concentrations and AOD values by approximately 6 to 9 times compared to the normal conditions, except in Jambi where the ratio was approximately 13. MODIS AOD may be a good indicator of the near-surface PM10 concentrations over Sumatra. The PM10 and MODIS AOD data are strongly related to each other, and the correlation coefficient of the linear regression is greater than 0.80. The linear regression method can be applied with good results to predict surface PM10 concentrations from MODIS AOD data, and the correlation coefficient is larger than 0.85 in all regions except Jambi. The current results may be influenced by other factors, such as uncorrected MODIS AOD data and natural variabilities of meteorological parameters such as diurnal, intraseasonal and seasonal variations. Therefore, when we have enough observation data, such factors should also be studied in the future. It is also worthwhile to use MODIS AOD data at higher resolutions, such as Level-2 or Level-1, which can provide more samples for the regression analysis. Furthermore, the use of the AOD retrieved from other satellites would also be useful to validate the results based on the MODIS AOD data.
Acknowledgements
We are grateful to Prof. Admin Alif for his constructive suggestions and comments. The PM10 data were provided by the Indonesian Agency for Meteorological, Climatological and Geophysics (IAMCG). The MODIS data were obtained from the Atmosphere Archive and Distribution System (LAADS) at the Goddard Space Flight Center (GSFC).
References
- Nazarenko, L.; Rind, D.; Tsigaridis, K.; Del Genio, A. D.; Kelley, M.; Tausnev, N. J. Geophys. Res. Atmos., 2017, 122, 3457-3480.
CrossRef - Cao, J.-j.; Wang, Q.-y.; Chow, J. C.; Watson, J.G.; Tie, X.-x.; Shen, Z.-x.; Wang, P.; An, Z.-s. Atmos. Environ., 2012, 59, 559-566.
CrossRef - Pope, C. A.; Dockery, D. W. J. Air Waste Manage. Assoc., 2006, 56, 709-742.
CrossRef - Thakur, A. India. Orient J Chem., 2017,33(2), 1051-1056.
CrossRef - Yahi, H.; Marticorena, B.; Thiria, S.; Chatenet, B.; Schmechtig, C.; Rajot, J. L.; Crepon, M.; J. Geophys. Res. Atmos., 2013, 118, 13265-13281.
CrossRef - Bray, C. D.; Battye, W.; Uttamang, P.; Pillai,P.; Aneja, V. P. Atmosphere, 2017, 8, 186.
CrossRef - Barladeanu, R.; Stefan, S.; Radulescu, R. Romanian Reports in Physics, 2012, 64, 1085–1096
- Grguric, S.; Krizan, J.; Gasparae, G.; Antonic, O.; Spiric, Z.; Mamouri, E.R.; Christodoulou, A.; Nisantzi, A.; Agapiou, A.; Themistocleous, K.; Fedra, K.; Panaylotou, C.; Hadjilmitsis, D.; Central European Journal of Geosciences, 2013, 6, 2-16.
- Kong, L.; Xin, J.; Zhang, W.; Wang, Y.; Environ Pollut., 2016, 350-360.
CrossRef - Ma, X.; Wang, J.; Yu, F.; Jia, H.; Hu, Y.; Atmos. Res., 2016, 181, 250-256.
CrossRef - You, W.; Zhang, Z.; Zhang, L.; Zhang, M.; Pan, X.; Li, Y.; Atmos. Res., 2016, 168, 169-179.
CrossRef - Field, R. D.; van der Werf, G. R.; Shen, S. S. P. Natl. Geosci., 2009, 2, 185-188.
CrossRef - Miettinen, J.; Liew, S. C. Int. J. Remote Sens., 2005, 26, 1109-1126.
CrossRef - Parker, R. J.; Boesch, H.; Wooster, M. J.; Moore, D. P.; Webb, A. J.; Gaveau, D.; Murdiyarso, D.; Atmos. Chem. Phys., 2016, 16, 10111-10131.
CrossRef - Maenhaut, W.; De Ridder, D. J. A.; Fernández-Jiménez, M.-T.; Hooper, M. A.; Hooper, B.; Nurhayati, M.; Nucl. Instrum. Methods Phys. Res., Sect. B, 2002, 189, 259–265.
CrossRef - Anwar, A.; Juneng, L.; Othman, M. R.; Latif, M. T. Sains Malaysiana, 2010, 39, 169-174.
- Chan, L. Y.; Lau, W. L. ; Lee, S. C.; Chan, C. Y. Atmos. Environ., 2002, 36, 3363-3373.
CrossRef - Christopher, S. A.; Zhang, J.; Kaufman, Y. J.; Remer, L. A. Geophys. Res. Lett., 2006, 33. L15816.
CrossRef - Kaufman, Y. J.; Boucher, O.; Tanré, D.; Chin, M.; Remer, L. A.; Takemura, T. Geophys. Res. Lett., 2005, 32, L17804.
CrossRef - Levy, R. C.; Mattoo, S.; Munchak, L. A.; Remer, L. A.; Sayer, A. M.; Patadia, F.; Hsu, N.C.; Atmos. Meas. Tech., 2013, 6, 2989-3034.
CrossRef - Song, C. -K.; Ho, C. -H.; Park, R. J.; Choi, Y. -S.; Kim, J.; Gong, D. Y.; Lee, Y. B. Asia-Pacific Journal of Atmospheric Sciences, 2009, 45, 33-43.
- MODIS Collection 6 NRT – MODIS Collection 6 NRT Hotspot / Active Fire Detections MCD14DL. Available on-line <https://earthdata.nasa.gov/firms>. DOI: 5067/FIRMS/MODIS/MCD14DL.NRT.006
- Engel-Cox, J.A.; Hoff, R. M.; Haymet, A.D.J. J. Air Waste Manage. Assoc, 2004, 54, 1360-1371.
CrossRef - Wang, J.; Christopher, S.A., Geophys. Res. Lett., 2003, 30, 2095.
CrossRef - Hadjimitsis, D.G.; Mamouri, R.E.; Nisantzi, A.; et al., Hadjimitsis, D. G. Ed., InTech, Rijeka, Croatia, 2013, 97–130.
- Marzuki; Hashiguchi, H.; Yamamoto, M.K.; Mori, S.; Yamanaka, M.D. Ann. Geophys., 2013, 31, 1941–1948.
CrossRef - Marzuki, Hashiguchi, H.; Kozu, T.; Shimomai, T.; Shibagaki, Y.; Takahashi, Y. Atmos. Res., 2016, 168, 121-138.
CrossRef

This work is licensed under a Creative Commons Attribution 4.0 International License.
![]()
A New Edition of Web of Science
Journal Impact Factor
2022: 0.5
Five Year: 0.8
Journal is Indexed in

Cabells Whitelist
![]()


