Hydrothermal Preparation of Silver Doping Zinc Oxide Nanoparticles: Study the Characterization and Photocatalytic Activity
 and Batool S. Hussein
Department of Chemistry, College of Education, University of Al-Qadisiyah, Post Box 88, Diwaniya, Iraq.
Corresponding Author E-mail: hasanchem70@gmail.com
DOI : http://dx.doi.org/10.13005/ojc/3404025
Download this article as:
![]()
In this study , we report the prepared of ZnO nanoparticles and Ag doped ZnO nanostructure via a hydrothermal process. The obtained nanostructures were characterized using different characterization techniques such as X-ray diffraction (XRD), transmission electron microscopy (TEM), scanning electron microscopy (SEM), energy dispersive spectroscopy (EDS) , atomic force microscopy (AFM) ,Fourier transform infrared spectrometry (FTIR)and UV/Visible spectrophotometer.The XRD results showed the wurtzite hexagonal structure of the ZnO Nanoparticles. Furthermore, the morphology of ZnO and Ag-ZnO nanostructures was obtained from SEM and AFM. The photocatalytic degradation of Cibacron Brilliant Yellow 3G-P (CB) dye was studied in presence of visible light using Ag-ZnO nanostructures as a photocatalyst. There are numerous factors which has an effect on the efficiency color removal of this process. Hence a study was conducted on the effect of several parameters on Ag-ZnO like amount of catalyst, CB dye concentration and pH of solution. Results showed Ag doping ZnO with 3% loading shows photocatalytic removal about 65% after 120 min which influenced superior photocatalytic activity than pure ZnO.
KEYWORDS:Characterization Photocatalytic; Hydrothermal Preparation; Oxide Nanoparticles
Introduction
Recently, Metal oxide nanoparticles have been involved consideration in various fields of scientific and technological applications because of unique electrical, mechanical, chemical and optical properties from their particle sizes in nanoscale.1-2 ZnO is one of the most significant nanomaterial that have been widely studied for many decades, which have a wide band gap (3.37eV) that’s make semiconductor transparent in visible light and works in the UV region to blue wavelengths also the higher exciton binding energy(60meV) at room temperature improves its luminescence efficiency of light discharge, In materials science ZnO is identify as one of the well-known n-type metal oxide semiconductor.3-5 Decrease in size of bulk to nano scale introduced novel properties to ZnO nanomaterial because of the surface area and quantum effect lead to provide ZnO some advantages as very important material in the different treatment of gas sensors, field transistors, light emitting devices and solar cells.6-8 Zinc oxide exhibits high efficiency than TiO2in presence UV light due to ZnO can absorb UV light at wavelength ≥ 385 nm, Though, for higher photocatalytic effectiveness and numerous practical applications, it is require that photocatalyst for example ZnO should absorb UV in addition to absorb visible light due to the fact that UV light less than 10% of energy in the solar radiation while visible light record for 45% in solar radiation. When ZnO absorb the visible light lead to make band gap of zinc oxide be narrowed and split into many act gaps, which can be attained by doping nitrogen or incorporated with transition metal ions.9-11 Silver nanoparticles have been unique physicochemical such as structural, optical and electrical properties ,Also silver doped ZnO nano crystallites could improve the photocatalytic activity of ZnO in some cases.12 Degradation of dyes is a method in which the bulky molecules of dye are destroyed into smaller molecules such as water, CO2 and mineral by products. In photocatalysis, when ZnO absorbs photons of energy equal or above its bandgap, electron-hole pairs are generated that induce redox reactions at its surface by react with O2 and H2O molecules to form superoxides anions and •OH radical .Many metal oxides such as ZnO, TiO2,Fe2O3 and WO3, etc. have been used as photocatalyst to removal different organic dyes.13-14 Diverse methods used for synthesis of ZnO nanostructures ,such as hydrothermal synthesis,15-16 chemical or physical vapor deposition,17 precipitation in water solution,18 the sol-gel process.19 However, Variation of morphology of zinc oxide nanoparticles with particles makes it probable to differing in shape, size and spatial structure.20 The hydrothermal synthesis is becoming one of the most significant tools for nanomaterial’s processing, usually conducted in steel pressure vessels named autoclaves using with or without Teflon liners in presence high pressure and controlled temperature, the reaction in aqueous solution of solvents or mineralizers. The temperature can be higher above the boiling point of water, attainment the pressure of vapour saturation , usually carried out below 300°C.21-22 In this work, the simple hydrothermal method was used to obtain the Ag doped and undoped ZnO nanostructure. Photocatalytic activityof ZnOand Ag-ZnO nanostructure which studied using Cibacron Brilliant Yellow 3G-P (CB) dye in presence visible light, the effect of diverse parameters on Ag-ZnO nanostructure such as amount of Ag-ZnO catalyst, concentration of CB dye and pH of solution also studied, Also The photo degraded samples were analyzed by chemical oxygen demand (COD) analysis.
Experimental
Materials
The chemicals used are zinc nitrate hexahydrate([Zn(NO3)2·6H2O], 99.9%) from Scharlau , silver nitrate (AgNO3, 99.8 % ) was obtained from Sigma-Aldrich). Cibacron Brilliant Yellow 3G-P dye(99%), F.wt = 872.97 from (Sigma-Aldrich)λmax = 404 nm, The structure formula of dye was shown in Fig.1. Absolute ethanol (C2H6O, 99.9%), hydrochloric acid (HCl,37%) and sodium hydroxide (NaOH,99%)were obtained from BDH. All chemicals were used in their original form without further purification.
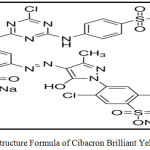 |
Figure 1: Structure Formula of Cibacron Brilliant Yellow 3G-P. |
Preparation of Zinc oxide Nanoparticle
The hydrothermal method was used to prepared the ZnO nanoparticles. In this method, 1.785gm of zinc nitrate hexahydrate dissolving in 20ml of deionized water solutions were slowly dripped into NaOH(0.01 M) solution and the mixture was stirred continuously for 2 h at pH=8.5, A white precipitate was formed. The precipitate resulting from the reaction between the two solutions was allowed to settle down for 24 h, the solution was put in a stainless steel autoclave for carrying out the hydrothermal treatment at 180˚C for 4 h. The stainless steel autoclave was then opened at room temperature and the precipitate was separated and washed repeatedly by deionized water until the pH=7 and sonicated for 10 min to get uniformly ZnO nanoparticles suspension. This suspension was centrifuged and dried at 80°C for 3 hours and then ground to get a fine powder, finally calcinated for 4 h at 350oC.23
Preparation of Ag doped ZnO Nanostructure
Ag-ZnO nanostructure with different molar ratios (0.03:0.97, Ag/Zn%) was prepared by using a hydrothermal method. Typically, Ag-ZnO composites was synthesized as follows: 4.412 gm of [Zn(NO3)2.6H2O] and 0.047 gm of AgNO3 were dissolved in deionized water 20 mL , then dropped of NaOH(0.01 M) aqueous solution was slowly added with magnetic stirring at 60°C for 2 hours at pH=8.5. The precipitate formed was allowed to settle down for 24 hours, the solution was put in a stainless steel autoclave for carrying out the hydrothermal treatment at 180°C for 4 hours. The stainless steel autoclave was then opened at room temperature and the precipitate was separated and washed repeatedly by deionized water until the pH = 7 and sonicated for 10 min to get uniformly suspended nanostructures suspension. This suspension was centrifuged at 3000 rpm for 10 min and dried at 80°C for 3 hours and then ground to get a fine Ag-ZnO powder .The calcination at 350°C for 4h in programmable furnace to get the Ag-ZnO nanostructure.24
Photocatalytic Study
The photocatalytic activity of ZnO and Ag-ZnO nanostructure were achieved by degradation of CB dye solution. All the tests were approved under visible light from 400 mW.cm-2 Xenon lamp . 100mg of ZnO or Ag-ZnO nanostructure was added to (50 ppm/100 ml) CB dye solution then taken and stirred in dark for 120 min to let the physical adsorption of dye molecules on the surface of catalyst. Also, This experimental setup was then putted in presence of visible light with stirring for 120min. The effect of different parameters on ZnO and Ag-ZnO nanostructure were studied such as amount of catalyst, CB dye concentration and pH solutions on degradation efficiency, the pH of the CB dye solution was methodically adjusted by adding 0.1 M NaOH or HCl. The pH meter used for measured pH value of the solutions at room temperature. 5 mL of the samples were taken and centrifuged for 5 minutes at the rate of 3500 rpm to remove catalyst nanostructure. The CB dye concentration was determined by UV–Visible spectrophotometer from the absorption spectra of all the CB dye degradation samples at λmax = 404 nm, (Fig. 2.) Calibration curve of CB dye. The percentage of CB dye degradation was calculated by equation:
% Degradation = (Ao – At )/Aox 100 …………..(1)
where, Ao is the initial CB dye absorbance; At is the absorbance of CB dye at time (t). Samples of CB dye were tested with thermo low-range (0-150)ppm COD test reagent in an TR 300 COD Thermoreactor.
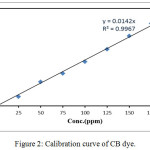 |
Figure 2: Calibration curve of CB dye. |
Characterization of ZnO and Ag-ZnO Nanostructure
The crystalline phase of all nanostructures were characterized by XRD using (XRD-6000, Shimadzu-Japan) with CuKα radiation (0.154056 nm), the XRD pattern was performed from (20-80)°. Scanning electron microscope (SEM) analysis was performed on nanostructures by Tescan, Vega 3 (Czech) electron microscope with accelerating voltage of 25kV. The roughness of surface was recorded using angstrom AFM (SPM-AA3000, USA). The functional groups of nanostructures were determine by using FTIR(Shimadzu FTIR 8400s, Japan) analysis in the range 400-4000 cm-1using KBr disc. UV-Vis spectrophotometer (UV-1650, Shimadzu, Japan) was used to recording the spectra of prepared nanoparticles in range 200-800 nm. The optical band gap Eg was projected from the UV-Vis-NIR diffuse reflectance spectroscopic (UV-Vis-NIR DRS) determined in a wavelength range from (300-1100) nm with JASCO V-570 spectrophotometer.
Results and Discussion
XRD Analysis
The crystal structure of the ZnO and Ag-ZnO nanostructures were investigated by analyzing the XRD data . X-ray diffraction patterns were shown in Fig.3. The diffraction peaks were obtained for Ag-ZnO was similar to pure ZnO with low intensity peaks due to silver. In pure ZnO pattern there are no other summit indicate the presence of the impurity, this is evidence that these particles dual Zinc oxide nanoparticles possess phase one. The average grain size of as prepared ZnO nanoparticles are found to be 50 nm. Nine peaks appeared at 2θ = 31.76o, 36.25o, 34.42o, 47.53o, 62.86o, 56.50o, 66.37o, 67.96o,and 69.09o, which correspond to (100), (101),(002), (102),(103),(110), (200), (112) and (201), reflection planes, respectively. All the diffraction peaks can also be well indicate to the hexagonal wurtzite structure of ZnO (JCPDS no: 36-1451) and pure phase with highly crystalline produced due to very sharp and intense peaks.25 In the diffraction patterns of Ag/ZnO nanostructures, we noticed the major plane (111), (200) and (220) refers to metallic Ag contend its presence on the ZnO surface, when 3% Ag nanoparticles was added.The average crystallite sizes were calculated using Scherrer’s equation:
D= 0.9λ / βcosθ …………………(2)
where, D = average crystallite size, λ = wavelength of X-ray beam (1.54056Å), θ = scattering angle in degree, and β = FWHM in radians.26
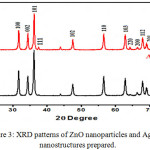 |
Figure 3: XRD patterns of ZnO nanoparticles and Ag–ZnO nanostructures prepared. |
FT-IR analysis
The FT-IR measurements have been carried out using KBr pellets method in the range 4000-400 cm-1 to approveand identify the formation of ZnO and Ag-ZnO nanostructures as shown in Fig. 4.The absorption band present at 3420 cm-1 correspond to the surface-adsorbed the hydroxyl groups (O–H) and water. The absorption band present at 1442 cm−1 and 940 cm−1 correspond to C=O and C=C bonds respectively.27 The absorbance peak noticed in the spectra around 470.03 cm−1 and 465.06 cm−1 clearly shows the presence of Zn–O and Ag-O stretching bond. A last note on FT-IR spectra is the presence of C=O=C peak around 2352 cm−1 which is a common impurity in IR spectra.28
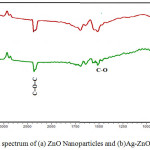 |
Figure 4: FTIR spectrum of (a) ZnO Nanoparticles and (b)Ag-ZnO Nanotructure. |
Atomic Force Microscopy analysis
The surface morphology of ZnO nanoparticles prepared also observed by AFM. Fig.5. shows three dimensional (3D) AFM images and particles size distribution of the ZnO and Ag-ZnO nanostructure scanned over a surface area of 1×1 μm2 using tapping mode. The AFM image of ZnO in Fig.5(a1) shows high uniform distribution of nanoparticles, the statistical roughness analysis (CSPM) shows that the obtained roughness average is 0.363nm, root mean square roughness is 0.448nm, surface skewness is – 0.308, and the surface kurtosis is equal to 2.59. Also the results show that the surface of ZnO nanoparticles is bumpy and the valleys are more than the peaks of surface. In Fig.5(b1) the AFM image of Ag-ZnO shows that the got roughness average is 1.08 nm, the root mean square roughness is 1.26 nm, the surface skewness is – 0.222 and the surface kurtosis is equal to 4.93, the results indicating the surface contain different phase of materials and the Ag was incorporated in ZnO crystal lattice.29
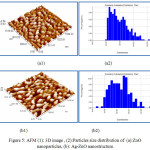 |
Figure 5: AFM (1): 3D image , (2):Particles size distribution of (a): ZnO nanoparticles, (b): Ag-ZnO nanostructure. |
SEM Analysis
The morphologies of ZnO and Ag-ZnO nanostructure prepared from SEM and the SEM images of the obtained Ag-ZnO nanostructure in 500 nm was shown in Fig.6 . The Ag nanoparticles exhibit cubic to be attached with ZnO wurtize like structure which morphology in the scale of 23.89 nm.30 The SEM images present the particles of ZnO nanoparticles with a very wide particle size distribution ,Also EDS spectrum of ZnO nanoparticles shown in the (Fig.6(B)) indicated the composition of different elements which presence of Zn , Ag and O their high purity.
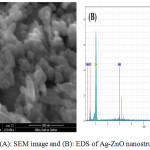 |
Figure 6: (A): SEM image and (B): EDS of Ag-ZnO nanostructure powder. |
TEM Analysis
The crystalline, distribution and the particles size of Ag-ZnO nanostructure were shown in Fig.7. The TEM image shows the hexagonal wurtize of ZnO and cubic structure for Ag nanoparticales with different particle size. The particle size is approximately equal to 20± 60 nm. The fewer aggregation was shown in TEM image that owing to occur the sintering of silver and zinc oxide crystals which is formed through the calcination stage.
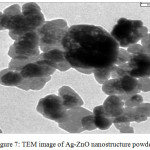 |
Figure 7: TEM image of Ag-ZnO nanostructure powder. |
UV-VisDRS Analysis
Fig.8. shows the spectrum UV-visible particles of ZnO nanoparticles within the range of wavelengths (300-1100nm). The quantity of the energy band gap of ZnO and Ag-ZnO nanostructures prepared has been determine by studied of the optical properties of these particles using spectroscopy UV-Visible. The band gap energy of all nanostructures were calculated depended on the absorption spectrum of the sample according to the following equation:
Ebg = 1240/λg…………………(3)
where, Ebg is the band gap energy of the photocatalyst, λg is the wavelength in nm used as the absorption edge. the band gap energy decreases from 3.35eV at 370 nm for pure ZnO to 3.29 eV at 376nm for Ag-ZnO , when Ag doped with ZnO nanoparticales.The decrease in band gap indicate that the role of Ag dispersed into ZnO nanoparticles and recreation on the surface of ZnO nanocomposite increase the surface area more and this shows that the Ag-ZnO has a suitable band gap can used for photocatalytic degradation of dyes.31-32 Also the band gap energy was determined using Tauc’s formula which shows the relationship among absorption coefficient as follows:
(αhv)1/n = C(hv – Eg) …………….(4)
Where α is the absorption coefficient, ν is frequency (ν= c/λ, h is Planck’s constant, λ is the wavelength, c light speed,). n= ½, and 2 for indirect and direct optical band gab, respectively. C is proportionality constant, and Eg is band gab.32
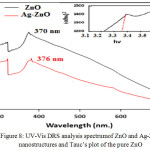 |
Figure 8: UV-Vis DRS analysis spectrumof ZnO and Ag-ZnO nanostructures and Tauc’s plot of the pure ZnO |
Photocatalytic Activity
In order to investigate the effectiveness of prepared ZnO and Ag-ZnO nanostructures on degradation of CB dye under visible light.ZnO, having a high band gap energy which enhanced by added Ag nanoparticles.Xenon lamp which emit a continuous spectrum of light inbetween 300–800 nm was used as a visible light source. In general, the photodegradation of CB dye catalyzed by the semiconductors follows pseudo-first-order rate law.33 Fig.9. shows the UV-vis spectrum of CB dye in presence of catalyst with different time often follows pseudo-first-order kinetics shown in Fig.10. can be represented as follows:
-dC/dt =kt……………..(5)
The integrated can be as : ln (C0/Ct) = kt …………….(6)
where is C0 the initial concentration, Ct concentration CB dye solution at different time and k is the rate constant. The kinetic parameters obtained using the pseudo first order kinetic model , corresponding to Fig. 10. The rate constants for CB dye using Ag-ZnO as photocatalyst ; 11.46 x 10⁻³ min -1.
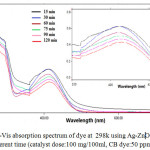 |
Figure 9: UV-Vis absorption spectrum of dye at 298k using Ag-ZnO Nanoparticle within different time (catalyst dose:100 mg/100ml, CB dye:50 ppm, pH=5.1). |
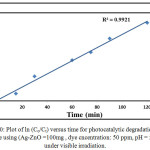 |
Figure 10: Plot of ln (Co/Ct) versus time for photocatalytic degradation of CB dye using (Ag-ZnO =100mg , dye cncentration: 50 ppm, pH = 5.1) under visible irradiation. |
The color removal efficiency of CB dye using ZnO as photocatalyst was 43 % at 120 min , the photocatalytic degradation using Ag-ZnO nanoparticle as photocatalyst in presence of visible light irradiation was as high as 65 % at 120 min because of the efficiency of charge carrier separation ( electrons and holes ) in the excited states that avoids recombination of charge pairs for a extensive time in presence of visible radiation.
Effect of Ag-ZnO loading
The experiments were performed by taking different amounts in a range 50-150mg of Ag-ZnO with 50 ppm of CB dye concentration constant as shown in Fig.10. The results found the color removals of the CB dye solution were 65% as 100 mg of Ag-ZnO for 100 ml of the CB dye solution, which it shows a radical reduction. As the Ag-ZnO amount increase 150mg the color removal became 53% .At 25mg of Ag-ZnO amount the color removal became 40 % , Therefore when the active sites on the e Ag-ZnO catalyst surface increases for the reaction, that lead to increases the rate formation of radical. In the photocatalytic oxidation process, the photo excited Ag-ZnO and an electron–hole pair is shaped by follows:
ZnO/Ag + hυ(visble) → ZnO/Ag* (e–)……………. (7)
ZnO/Ag* (e–) → ZnO(e–CB) + Ag………………….(8)
e–CB + O2 → O•2– ………………….(9)
h+vb+OH → •OH ………………..(10)
O•2– + •OH + Dye → Degradation product………………..(11)
Where, e–CB is the electron at the conduction band and h+VB is the hole at the valence band. Ag-ZnO(e–CB and h+VB) is photo excited with the formation of electron and hole then dye was damaged through direct oxidation by formed the hydroxyl radicals and O•2– radicals as shown in eq. (9,10).19 The hydroxyl radicals are produced by these radicals reacted with dye eq.(11). These radicals can react with a superior oxidization with dye (mostly –N=N– bond) to produce final products .The decrease in the rate constant after the Ag-ZnO catalyst amount increased as 150 ppm/50 ml because the light was scattering and occur reduction in light diffusion through the solution. Through a very high catalyst dose the deactivation of all initiated molecules by crash with molecules in ground state controls the reaction, therefore reducing the rate of reaction.32-34
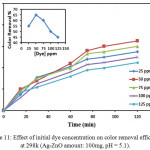 |
Figure 11: Effect of Ag-ZnO amount on color removal efficiency at 298k (dye cncentration: 50 ppm, pH = 5.1). Click here to View figure |
Effect of Initial Dye Concentration
The effect of initial CB dye concentration was studied under visible light by variable the concentration from 25-125 ppm in presence of (100 mg/100 ml) Ag-ZnO as constant on the degradation efficiency of catalyst. The maximum degradation efficiency of CB was recorded at 50 ppm of dye, but decrease for more highly concentrated of dye at 125 ppm as shown in Fig.11.The solutions have been concentrated of dye as 125 ppm or less concentration were nearly completely degraded at this Ag-ZnO amount , at this Ag-ZnO amount, the dyes with higher concentrations such as 100 or 125 ppm were not fully degraded For example, the 50 ppm the solution was degraded at 65 % after 120 min; while the 125 mg solution was degraded only 45 % after the similar reaction time, on the catalyst the active surface available for reaction is very important for the degradation to have effect, but active sites decrease as the dye concentration was increased for the reaction because of the solution of dye developed more intense colored , so the path length of photons entering the solution decreased therefore only less photons can reach to the catalyst surface and the production of hydroxyl radicals is not enough when the surface of Ag-ZnO is more completely covered with dye molecules.35
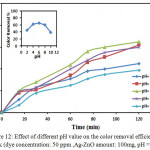 |
Figure 12: Effect of initial dye concentration on color removal efficiency at 298k (Ag-ZnO amount: 100mg, pH = 5.1). Click here to View figure |
Effect of pH
The pH factor was most important affecting in this study was carried out by varying pH=2,4,6,8 and 10 using HCL or NaOH for adjusted the pH of solutions .The result is shown in Fig.12. shown the effect of pH values (pH 2–10) on the color removal efficiency with time, The minimum removal efficiency was recorded in very alkaline at pH=10 and in very acidic at pH=2 .The maximum value obtained in pH=5.5 , the effect of pH occur not only on the surface properties of Ag-ZnO nanostructure but similarly occur when separation of dye molecules and hydroxyl radicals formation. In alkaline condition, the Ag-ZnO surface becomes negatively charged , producing an electrostatic repulsion between the negatively charged of dye and the catalyst .In the acidic condition,Ag-ZnO is exhibits an amphoteric oxide, which can be dissolved in very high acidic aqueous solution to form Zn+.36-37
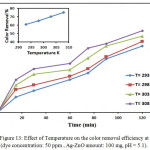 |
Figure 13: Effect of different pH value on the color removal efficiencyat 298k (dye concentration: 50 ppm ,Ag-ZnO amount: 100mg, pH = 5.1). Click here to View figure |
Effect of Temperature
Temperature has been an important role in the photocatalytic process, which directly effects on the degradation of CB dye process. Fig.13. shows that when the solution temperature increases, the color removal efficiency of CB dye increase when the other experiment conditions stable (50 ppm dye concentration and 100 mg Ag-ZnO in 100ml of dye solution , pH=5.1), Where the dissociation of the dye was studied at three different temperature levels of 293k, 298k, 303k and 308k was found at 308 k temperature. The CB dye has the largest degradation.32 Arrhenius equation was used to clarify the relationship between rate consistency and its temperature:
ln k = ln A – Ea/RT ………………(12)
where, k: is rate constant, A: frequency factor, R: gas constant, T: temperature. Fig. 14.shows this effect.
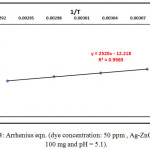 |
Figure 14: Effect of Temperature on the color removal efficiency at (dye concentration: 50 ppm , Ag-ZnO amount: 100 mg, pH = 5.1). Click here to View figure |
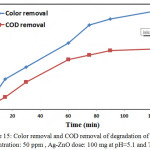 |
Figure 15: Arrhenius eqn. (dye concentration: 50 ppm , Ag-ZnOamount:100 mg and pH = 5.1). Click here to View figure |
COD Analysis
The mineralization of CB dye is improved by measuring the COD values at different times of irradiation under enhanced conditions. The percentage of COD removal is 40 % after 120 min , The results indicates that the almost complete mineralization of CB dye molecules compare with color removal under visible light is observed was 65 % after 120 min as shown in Fig.15.
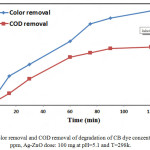 |
Figure 16: Color removal and COD removal of degradation of CB dye concentration: 50 ppm, Ag-ZnO dose: 100 mg at pH=5.1 and T=298k. |
Conclusions
ZnO and Ag doped ZnO nanostructures were successfully prepared by hydrothermal method . The structural properties and particle size of ZnO and Ag-ZnO nanostructure was studied using XRD ,SEM,TEM ,FT-IR and UV-vis spectroscopy. The pure hexagonal wurtzite structure of ZnO and cubic shape for Ag were confirmed from XRD studies. In addition, the TEM results showed that the average particle size20±60 nm of Ag-ZnO nanostructure. The formation of hexagonal wurtize nanoparticles shape for ZnO and cubic shape for Ag were observed from SEM studies. The FT-IR showed a broad absorption band related to Ag-O vibration band. The band gap of the ZnO nanoparticles was valued from the UV-vis absorption. The photocatalytic removal efficiency under visible light 65% which show higher removal efficiency than COD analysis.
References
- Salahuddin N A, El-Kemary M, Ibrahim E M,Nanosci. and Nanotech., 2015, 5, 82-88.
- Pareek S S, Pareek K ,IOSR. JAP,2013, 3, 16-24.
- Ahmad M, Ahmed E , Hong Z , Ahmed W, Elhissi A, Khalid N ,Ultrasonicssonochemistry, 2014, 21, 761-773.
CrossRef - Nirmala M, Nair M G, Rekha K, Anukaliani A, Samdarshi S, Nair R G, Afr. J. Basic Appl. Sci, 2010, 2, 161-166.
- Elamin N, Elsanousi A, J. Appl. and Ind. Sci., 2013, 1, 32-35.
- Rout C S, Krishna S H, Vivekchand S, Govindaraj A, Rao C, Chem. Phys. Lett., 2006, 418,586-590.
CrossRef - Hwang D K, Oh M S, Lim J H, Choi Y S, Park S J, Appl. Phys. Lett., 2007, 91, 121113.
CrossRef - Jiang C, Sun X, Lo G , Kwong D, Wang J, Appl. Phys. Lett., 2007, 90, 263501.
CrossRef - Al-Taweel S S, Saud H R., J. Chem. and Pharm. Res., 2016, 8, 620-626.
- Soltaninezhad M, Aminifar A, International J. Nano Dimension, 2011, 2, 137-145.
- Ramasubbu A, Karunakaran K, Vasanthkumar S, Int. J. Nano Dimension, 2012, 2, 171-176.
- Shah A, Manikandan E, Ahmed M B,Irdosh M, Chauhan A, Murli C, Gadkari S, In Nano Ag-doped ZnO particles magnetic, optical and structural studies, AIP Conference Proceedings, 2013, 430-431.
CrossRef - Labiadh H, Chaabane T B, Balan L, Becheik N, Corbel S, Medjahdi G, Schneider R, Appl. Catalysis B: Environ., 2014, 144, 29-35.
CrossRef - Alkaim A F,Dillert R ,Bahnemann D W, Environ. Tech., 2015,36 , 2190–2197.
CrossRef - Ibupoto Z H, Khun K, Eriksson M, AlSalhi M, Atif M, Ansari A, Willander M, Mater., 2013, 6, 3584-3597.
CrossRef - Alkaim A F, Kandiel T A, Dillert R, Bahnemann D W, Environ. Tech. (United Kingdom), 2016, 37, 2687-2693.
- Kang D S, Lee H S, Han S K, Srivastava V, Babu E S, Hong S K, Kim M J, Song J H, Song J H, Kim H, Kim D, J. Alloys and Compounds, 2011, 509, 5137-5141.
CrossRef - Ghorbani H R, Mehr F P, Pazoki H, Rahmani B M, Orient. J. Chem. ,2015, 31,1219-1221.
CrossRef - Yue S, Yan Z, SHi Y, Ran G, Mater. Lett., 2013, 98, 246-249.
CrossRef - Nejati K, Rezvani Z, Pakizevand R, Inter. Nano Lett., 2011, 1, 75.
- Byrappa K, Adschiri T, Progress in Crystal Growth and Characterization of Materials , 2007, 53, 117-166.
CrossRef - Hiromichi H, Yukiya H, Review, Mater., 2010, 3, 3794-3817.
- Baruah S, Dutta J, Sci. and Technol. Adv. Mater., 2009, 10, 013001.
CrossRef - Jia Z G, Peng K K, Li Y H, Zhu R S, Transactions of Nonferrous Metals Society of China, 2012, 22, 873-878.
CrossRef - Bandekar G, Rajurkar N S, Mulla I S, Mulik U P, Amalnerkar D P, Adhyapak P V, Appl. Nanosci., 2013, 4, 199-208.
CrossRef - Jasso-Salcedo A B, Palestino G, Escobar-Barrios V A, J. Catalysis, 2014, 318, 170-178.
CrossRef - Saoud K, Alsoubaihi R, Bensalah N, Bora T, Bertin M, Dutta J, Mater. Res. Bulletin, 2015, 63, 134-140.
CrossRef - Ramimoghadam D, Hussein M Z B, Taufiq-Yap Y H, Chemistry Central J.,2013, 7, 71.
CrossRef - Dehimi M, Touam T, Chelouche A, Boudjouan F, Bouasla A, Djouadi D, Fischer A, Boudrioua A, Doghmane A, Inter. J. Natural Sci. Res., 2016, 4, 15-28.
- Nghia N V, Trung T N, Truong N N K, Thuy D M, Open J. Synthesis Theory and Applications,2012, 01, 18-22.
CrossRef - Fageria P, Gangopadhyay S, Pande S, RSC Adv., 2014, 4, 24962.
- Kuriakose S, Choudhary V, Satpati B, Mohapatra S, Beilstein J. J. nanotech., 2014, 5, 639-50.
- Al-Hayder L S J, Al-Hussainawy M K, Int. J. Chem. Tech. Res., 2016, 9, 337-344.
- Nagaraja R, Kottam N, Girija C R, Nagabhushana B M, Powder Tech., 2012, 215-216, 91-97.
CrossRef - Vijay A, Nihalani S, Tripathi N, Bhardwaj S, Int. J. Chem. Sci., 2013, 11, (2).
- Jia Z, Miao J, Lu H B, Habibi D, Zhang W C, Zhang L C, J. the Taiwan Institute of Chemical Engineers ,2016, 60, 267-274.
CrossRef - Al-Hayder L S J, AL-Juboory M H J,J. Chem. and Pharm. Res., 2015, 7, 1138-1144.
Accepted on: 27-06-2018


![]()


