Facile Method to Synthesize of N-Graphene Nano Sheets
Rikson Siburian1,4 , Dewiratih2, Andiayani1, Sabarmin Perangin-Angin1, Helmina Sembiring1, Herlince Sihotang1, Saur Lumban Raja1, Minto Supeno1, Nurhaida Pasaribu1, Cristina Simanjuntak2 and Sri Pratiwi3
1Department of Chemistry, Universitas Sumatera Utara-Medan, Indonesia.
2School-Department of Chemistry, Universitas Sumatera Utara-Medan, Indonesia.
3Agriculture Department, Universitas Mentodist Indonesia-Medan, Indonesia.
4Nanomedicine Center, Universitas Sumatera Utara-Medan, Indonesia.
Corresponding Author E-mail: riksonsiburian2000@yahoo.com
DOI : http://dx.doi.org/10.13005/ojc/3404035
Article Received on : 06-06-2018
Article Accepted on : 11-07-2018
Article Published : 07 Aug 2018
In this paper, we reported about the facile method to generate N-Graphene Nano Sheets (N-GNS) on room temperature. The purposes of this research are to synthesize and characterize N-GNS. This research used the modified Hummers’s method to generate GNS and doping nitrogen to N-GNS used ammonia 10 M at T = 30oC. The N-GNS was characterized by using XRD, FTIR and SEM-EDX. The XRD data show that N atoms was well be deposited on GNS to form N-GNS, it was indicated by the broad and weak peak was appear at 2θ = 26.3oC. This data is consistent with SEM-EDX, where the N atoms content on N-GNS is 2.72 %. FTIR dataalso defenitely confirm that there is interaction between C and N, indicating by the peak is appear at 1396 cm-1. All of data show that the N is exist on GNS, it probes N-GNS may synthesized by facile method on room temperature.
KEYWORDS:Amonia; Graphene Nano Sheets; N-Graphene Nano Sheets; Room Temperature
Download this article as:| Copy the following to cite this article: Siburian R, Dewiratih D, Andiayani A, Perangin-Angin S, Sembiring H, Sihotang H, Raja S. L, Supeno M, Pasaribu N, Simanjuntak C, Pratiwi S. Facile Method to Synthesize of N-Graphene Nano Sheets. Orient J Chem 2018;34(4). |
| Copy the following to cite this URL: Siburian R, Dewiratih D, Andiayani A, Perangin-Angin S, Sembiring H, Sihotang H, Raja S. L, Supeno M, Pasaribu N, Simanjuntak C, Pratiwi S. Facile Method to Synthesize of N-Graphene Nano Sheets. Orient J Chem 2018;34(4). Available from: http://www.orientjchem.org/?p=48131 |
Introduction
Recently, graphene has been a widely material to develope andfascinate to research by various fields of science namelyphysics, chemistry, biology and material engineering. Basically, graphene is a carbon allotropy that becomes the basic structure in the formation of carbon-based materials such as graphite, carbon nano tube and fullerene.1 Graphene is a carbon 2D that it may consist of one, several (2 – 9 layers) or multiple layers (≥ 10 layers).2 The graphene has the extraordinary properties which we never find them on the others carbon material, those are large surfaces area,3,4 high electron mobility,5,6 Young’s modulus ~1.0TPa,7 mechanical resistance,8 high thermal properties,9 large surface area (2630 m2g-1),10 high conductivity (5000 Wm-1K-1),11 the world’s strongest material,12,13 and low production cost.14
One of the most interesting properties of graphene is the arrangement of very regular and almost perfect carbon atoms. Each carbon atom of graphene layer has a π-orbital and σ-bonding.15 Based on its unique nature, graphene has been widely used in various applications such as supercapacitors,16 nanoelectronics, nanocomposites, batteries, hydrogen storing,17,18 sensors,19 solar pannel,20 and adsorbents.21 However, graphene has weaknesses such as having strange ribbon structure, valence band (π) and conduction (π*) are not separated (linear) so that graphene has no energy gap (zero gap) and graphene without metal shows low activity. Therefore, the graphene need be modified so that its activity can be increased by means of deflecting the graphene structure (defect of graphene), defects in the graphene structure is an attempt to change the electronic structure and increase the activity of graphene, especially the transfer of electrons to and from grafena.22 Graphene defects can be performed using dopants such as nitrogen, sulfur, boron and hydrogen. Dopants with nitrogen (N-Graphene) cause the N atoms incorporation to carbon atoms and donate the electrons to π-graphene system, consequently the N atoms can change the local density state around the Fermi energy level of N-Graphene.23 Thus, the electronic performance and activity can be improved with N-Graphene.24,25 N-doping carbon exhibits increasing capacitance performance of the capacitors as well as improving electronic conductivity due to there are formation of variations of the N-doping structure.26 Modification of carbon materials especially with the use of nitrogen (N-carbon dopant) has been proposed as a metal-free electrode material.27
N-graphene can be synthesized via direct incorporation of N-C with combustion techniques at high temperatures,28 solvotermal chemistry (T = 230 – 300oC),29 laser ablation method30 and chemical vapor deposition (CVD).31,32 Graphene serves as a precursor for N-graphene. The C source can be produced from methane, ethylene, benzene and acetylene33 while the N source can be produced from imidazole, dimethyl formamide, ethylene diamin, and benzylamine Fe-phthalocyanine.34 N-C can also be obtained via a method after dopant treatment35 ie oxidizing C with ammonia which was efficiently used as a catalyst for fuel cells.36 N-graphene is more easily produced because N can open the graphene structure.37 The extraordinary properties of N-graphene are similar with graphene, ie, high conductivity and large surface area38 and catalyst activity is more stable than Pt/C.39 Therefore, we fascinate to produce N-graphene on room temperature by grafting the graphene with ammonia solution to produce N-graphene. The obtaining N-graphene was characterized using XRD, FTIR, and SEM-EDX. We expect incorporation C-N will occur on N-graphene which is expected to increase the activity of grafena.40 In this paper, we succeed to synthesize N-GNS at room temperature, without ammonia gas and it was done with facile way.
Materials and Methods
Sample Preparation
Graphite powder (carbon 98 %, ash 15 %), H2SO4 (95–97 %) and NaNO3 were obtained from Merck KGaA. KMnO4, H2O2 (30 %) and NH3 (25%) were purchased from Sigma-Aldrich.
Synthesis of Graphene Nano Sheets
2 g of graphite was added with 2 g NaNO3 and 150 ml H2SO4(l), respectively. After that, its solution was stirred for 4 hours in ice bath condition. The end of 4 hours, 10 grams of KMnO4 were added gradually into solution and stirred for 4 hours. We choosed 4 hours base on the real experiment condition where all of graphite powder and NaNO3 have been well dispersed on H2SO4 98 %. Then it was added 200 mL of H2SO4 5 % and 10 mL H2O2 30%, stirred for 4 hours, respectively.41 Subsequently, solution was centrifuged at 72,000 rpm for 10 minutes and ultrasonication for 6 hours, producing a solution of graphene oxide. The resulting graphene oxide solution was divided into two parts, the first solution was dried with oven at 80oC to obtain the graphene oxide powder. The other solution was added with a 50 mL of NH3 10 M and stirred for 72 hours, filtered and dried at 80ºC to generate graphene nanosheets powder.
Synthesis of N-Graphene Nano Sheets
Briefly, N-Graphene Nano Sheets (N-GNS) was synthesized follow as: GNS powder was added 10 mL NH3 10 M and stirred for 4 hours. Then, the solution was filtered and dried at 80ºC resulting N-GNS.
Characterization
All of samples (graphite, graphene oxide, GNS, cathode primary battery (commercial) and N-GNS) were characterized by using XRD, FTIR and SEM – EDX, respectively. X-ray diffraction (XRD) analysis used X-Ray Rigaku Smartlab 3 kW. Cu-Kα radiation (1.540598 Å) was used to observe samples from 5 to 80°C of 2θ (degree), scanning speed 2oC/min, 44 kV, and 40 mA current. Fourier Transform Infra Red (FTIR) spectra were recorded on Shimadzu IR Prestige-21. All of FTIR spectra were recorded in the transmittance mode in the range of 4000 – 500 cm-1. SEM – EDX analysis used type of EM 30 COXEM with a voltage of 20,000 kV with enlargement 100 – 4000 times.
Results and Discussion
XRD Analysis
X-ray diffraction (XRD) patterns of graphite, graphene oxide, GNS, cathode primary battery (commercial) and N-GNS were shown in Fig. 1. Cathode primary batttery was used as a reference in this study. It shows a sharp peak (C (002)) at 26.58ᵒC (d = 3.34 Ǻ), indicating graphite.42 Base on that data, cathode primary battery is containing graphite as a support material. N-GNS was synthesized with steps: i) Graphite was oxidized with hard acid and oxidation agent to form graphite oxide. It was followed with ultrasonication in order to stabilization the colloid into water, producing graphene oxide. The formation of graphene oxide is probed by the appearance of a broad and sharp peak at 9.35ᵒC, indicating graphite was oxidized43,44 (Figure 1); ii) Reducing of graphene oxide by using NH3, generating GNS. It is confirmed by the broad and weak peak at 26.71ºC (d = 3.34 Å) (Figure 1). We can see that the spacing of d-spacing is changed; meaning the reduction process of oxide has been well proceed. The 2θ of graphene oxide shifts much more to right side when it was reduced with NH3 to form GNS. That is due to functional groups containing graphene oxide was well be reduced and the rearrangement of GNS45; and iii) Dopant NH3 into graphene structure. The XRD pattern of N-GNS has diffraction a weak peak at 2θ (26.24ºC). Its peak is broader and weaker than GNS and grahene oxide.46 Interestingly, 2θ of N-GNS is shifter to right side than GNS, indicating probably incorporation N-C occurs. Generally, the doping of hetero atoms (N) in graphene induces defective sites and destruction in the carbon lattice, resulting in N-graphene having a low crystallinity and causing a small change in the 2θ value.47
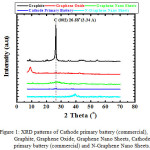 |
Figure 1: XRD patterns of Cathode primary battery (commercial), Graphite, Graphene Oxide, Graphene Nano Sheets, Cathode primary battery (commercial) and N-Graphene Nano Sheets. |
Figure 1 shows that the N-GNS have a peak at 2θ = 26.16ºC (d = 3.39 Å). It is very different compare to GNS, appearing a peak at 2θ = 26.64ºC. Base on XRD data, it is clearly may be seen that N-GNS was formed.
FTIR Analysis
In order to know the functional group containing on graphene oxide and each of interaction C – C, C = C, C – N, C = O, and C = C aromatic of graphite, GNS and N-GNS, we used FTIR data. The FTIR spectra of battery primary’s cathodes and commercial graphite show characteristic peaks at 1573 and 2337 cm-1, indicating vibration strain of C = C aromatic. A wide peak at a wavelength of 3000 – 3700 cm-1 and a sharp peak at 1635 cm-1 appear on graphene oxide (Figure 2), corresponding to the vibration of stretching and bending of the water molecule’s O-H bond.48 The vibration peak around 1700 cm-1 corresponds to the C = O bond of carboxyl group located on the edge of the GO layer. The strong intensity peak of about 1600 cm-1 shows vibration of strain C = C on benzene ring or vibration deformation in O-H band of intercalated water molecule.49 The oxidation of graphite, resulting graphene oxide may be indicated by appearing the peak at 1325 cm-1 (C-OH bonding). In addition, peaks of 1203 and 1050 cm-1 show the deformations of epoxy vibration, and alcoxy, respectively.50
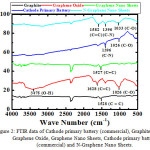 |
Figure 2: FTIR data of Cathode primary battery (commercial), Graphite, Graphene Oxide, Graphene Nano Sheets, Cathode primary battery (commercial) and N-Graphene Nano Sheets. |
At GNS, it appears that there is an O-H bond due to residual water content and C = C aromatic which is the main bond in the structure of GNS. The extending time of ultrasonication, it may cause C = C aromatic bond becomes stronger, while the bonds C = O (carbonyl), C-OH (phenol) and C-O (alcoxy/ ether) will decrease. This indicates that the reduction of graphene oxide to be GNS is well formed. However, there is a peak at 2300 cm-1 in GNS due to the presence of the O = C = O bond. This functional group is not a component of GNS, it is probably CO2 gas of air which is attached to the GNS surface.
Interestingly, there are peaks at 1396 and 1573 cm-1, corresponding to the strong and sharp C-N and C = C bonds respectively. It means nitrogen atoms may incorporate with carbon atoms at N-GNS. Therefore, N-GNS may be produced.51
SEM-EDX Analysis
The surfaces and composition of GNS may be supported by using SEM-EDX. The SEM images of GNS are shown in Figure 3. It is provided with three magnifications. GNS has random surfaces (Figure 3A), small pores and wrinkle surfaces (Figure 3B). Based on the results of SEM data, GNS has not been a single layers, it can be seen at Figure 3C), indicating its surfaces are still more smooth coalesce, some of them are thin and uniform surfaces.
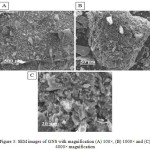 |
Figure 3: SEM images of GNS with magnification (A) 100×, (B) 1000× and (C) 4000× magnification. |
The composition chemical of GNS was characterized by using Energy Dispersive X-Ray (EDX). The EDX data is shown in Table 1.
Table 1: The results of EDX analyses for GNS.
| Number Element | Element Symbol |
Element Name |
Element Weight (%) |
| 6 | C | Carbon | 53.14 |
| 8 | O | Oxygen | 36.88 |
| Sum | 100.00 | ||
Table 1 show that GNS has C atom as a dominant element, meaning GNS structure consists of carbon atomic bonds. However, GNS still contains oxygen (O).
N-GNS shows a uniform surface with a thinner layer than GNS (Figure 4A) and it has a small pore size and wrinkled surface (Figure 4B and C). It means the morphology of N-GNS is totally different with GNS.
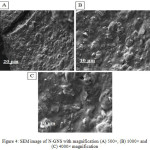 |
Figure 4: SEM image of N-GNS with magnification (A) 500×, (B) 1000× and (C) 4000× magnification. |
Interestingly, EDX data shows that N atoms exist into N-GNS, it means there is incorporation between C and N on N-GNS as well as N-dopant effect (Table 2).
Table 2: The results of EDX analyses for N-GNS.
| Number Element | Element Symbol |
Element Name |
Element Weight (%) |
| 6 | C | Carbon | 61.07 |
| 8 | O | Oxygen | 36.21 |
| 7 | N | Nitrogen | 2.72 |
| Sum | 100.00 | ||
Table 2 shows there are 2.72 % N atoms in N-GNS. That is caused N atoms incorporate with carbon atoms. It is possible because N may donate its electrons to the π-graphene system.52
Conclusion
N-GNS may be produced base on graphite as a raw material under conditions room temperature and usage ammonia solution. It may role both as a reducing agent and may be nitrogen atoms source.
Acknowledgement
We would like to thankful for “Direktorat Jenderal Penguatan Riset dan Pengembangan”, Ministry of Research, Technology and Higher Education, Republic of Indonesia, No. SP DIPA – 042.06.1.401516/2018, 5 December 2017 who funding supported on our research. We also would like to thankful for Labsystematic – Jakarta, Indonesia who supported us for SEM – EDX analysis.
References
- Basu, S.; Bhattacharyya, P. Chemical. 2012, 173, 1 – 21.
- Ambrosi, A.; Chua, C. K.; Bonanni, A.; Martin, P. Chemical Reviews. 2014, 114, 7150 – 7188.
CrossRef - Choi, J. Y.; Higgins, D.; Chen, Z. Journal of the Electrochemical Society. 2012, 159, B86 – B89.
CrossRef - Luo, C.; Xie, H.; Wang, Q.; Luo, G.; Liu, C. Journal of Nanomaterials. 2015, 1 – 10.
- Novoselov, K. S.; Geim, A. K.; Geim, S. V.; Morozov, D.; Jiang, Y.; Zhang, S. V.; Dubonos, I. A.; Grigorieva, A. F. Science. 2004, 306, 666 – 669.
CrossRef - Novoselov, K. S.; Geim, A. K. Science. 2007, 6, 183 – 188.
- Lee, C.; Wei, X.; Kysar, J. W.; Hone, J. Science. 2008, 321, 386 – 388.
- Lee, C.; Wei, X.; Kysar, J. W.; Hone, J. Science. 2008, 321, 385 – 388.
CrossRef - Balandin, A. A.; Ghosh, S.; Bao, W.; Calizo, I.; Teweldebrhan, D.; Miao, F.; Lau, C. N. Nano Lett. 2008, 8, 902 – 907.
CrossRef - Stoller, M. D.; Park, S. Y.; Zhu, J.; Ruoff, R. S. Nano Lett. 2008, 8, 3498 – 3502.
CrossRef - Baladin. Nano Letters. 2008, 8, 902 – 907.
- Zhang, Y.; Tan, Y. W.; Stormer, H. L.; Kim, P. Nature. 2005, 438, 201 – 204.
CrossRef - Zhang, Y.; Small, J. P.; Amori, M. E. S, Kim P. Phys. Rev. Lett. 2005, 94, 776 – 803.
- Samulskiet. Chem. Mater. 2008, 20, 6792 – 6797.
- Terrones A. R.; Botello-Mendez, A. R.; Campos-Delgado, J.; Lopez-Urias, F.; Vega-Cantu, Y. I, Rodriguez-Macias, F. J.; Elias, A. L.; Munoz-Sandoval, E.; Cano-Marquez, A. G.; Charlier, J.; Terrones, H. Nano Today. 2010, 5, 351 – 372.
CrossRef - Stoller, M. D.; Park, S. Y.; Zhu, J.; Ruoff, R. S. Nano Lett. 2008, 8, 3498 – 3502.
CrossRef - Geim, A. K.; Novoselov, K. S. Nature Materials. 2007, 6, 183 – 191.
CrossRef - Wu, J.; Pisula, W.; Müllen, K. Chem. Rev. 2007, 107, 718.
CrossRef - Ang, P. K.; Chen, W.; Wee, A. T.; Loh, K. P. J. Am. Chem. Soc. 2008, 130, 14392 – 14393.
CrossRef - Wang, X.; Zhi, L.; Mullen, K. Nano Lett. 2008, 8, 323 – 327.
CrossRef - Xu, J.; Wang, L.; Zhu, Y. Langmuir. 2012, 28, 8418 – 8425.
CrossRef - Tan, C.; Rodríguez-Lopez, J.; Parks, J. J.; Ritzert, N. L.; Ralph, D. C.; Abruna, H. D. ACS Nano. 2012, 6, 3070.
CrossRef - Wang, L.; Li, H. IEEE Trans. Ind. Appl. 2010, 46, 1011.
CrossRef - Bostwick, A.; Speck, F.; Seyller, T.; Horn, K.; Polini, M.; Asgari, R.; MacDonald, A.H.; Rotenberg, E. Science. 2010, 328, 999–1002.
CrossRef - Wei, Q.; Tong, X.; Zhang, G.; Qiao, J.; Gong, Q.; Sun, S. Catalysts. 2015, 5, 1574 – 1602.
CrossRef - Seger, B.; Kamat, V. P. J. Phys. Chem. C. 2009, 19, 7990 – 7995.
CrossRef - Stankovich, S.; Dikin, D. A.; Piner, R. D.; Kohlhaas, K. A.; Kleinhammes, A.; Jia, Y.; Wu, Y.; Nguyen, S. T.; Ruoff, R. S. Carbon. 2007, 1558 – 1565.
CrossRef - Sun, M.; Liu, H.; Liu, Y.; Qu, J.,; Li, J. Nanoscale. 2015, 7, 1250 – 1269.
CrossRef - Chen, L.; Xia, K.; Huang, L.; Li, L.; Pei, L.; Fei, S. Int. J. Hydrogen Energy. 2013,38, 3297 – 3303.
CrossRef - Du, Z.; Wang, S.; Kong, C.; Deng, Q.; Wang, G.; Liang, C.; Tang, H. J. Solid State Electrochem. 2015, 19, 1541 – 1549.
CrossRef - Guo, Q.; Zhao, D.; Liu, S.; Chen, S.; Hanif, M.; Hou, H. Electrochim. Acta. 2014, 138, 318 – 324.
CrossRef - She, X.; Yang, D.; Jing, D.; Yuan, F.; Yang, W.; Guo, L.; Che, Y. Nanoscale. 2014, 6, 11057 – 11061.
CrossRef - Wang, Y.; Cui, X.; Li, Y.; Chen, L.; Chen, H.; Zhang, L.; Shi, J. A. Carbon. 2014, 68, 232 – 239.
CrossRef - Rao, C. V.; Ishikawa, Y. J. Phys. Chem. C. 2012, 116, 4340 – 4346.
CrossRef - Chan, L. H.; Hong, K. H.; Xiao, D. Q.; Lin, T. C.; Lai, S. H.; Hsieh, W. J.; Shih, H. C. Phys. Rev. B. 2004, 70, 125408.
CrossRef - Vikkisk, M.; Kruusenberg, I.; Ratso, S.; Joost, U.; Shulga, E.; Kink, I.; Rauwel, P.; Tammeveski, K. RSC Adv. 2015, 5, 59495 – 59505.
CrossRef - Wood, K. N.; O’Hayre, R.; Pylypenko, S. Energy Environ. Sci. 2014, 7, 1212 – 1249.
CrossRef - Qu, L.; Liu,Y.; Baek, J. B.; Dai, L. ACS Nano. 2010, 4, 1321.
CrossRef - Feng, L. Y.; Chen, Y. G.; Chen, L. ACS Nano. 2011, 5, 9611 – 9618.
CrossRef - Xin, Y.; Liu, J.; Zhou, Y.; Liu, W.; Gao, J.; Xie, Y,; Yin, Y.; Zou, Z. J. Power Sources. 2011, 196, 1012 – 1018.
CrossRef - Hummers, W. S. J. Am. Chem. Soc. 1958, 80, 1339.
CrossRef - Huang, N. International Journal of Nanomedicine.2011, 6, 3125 – 3137.
- Jeong, K. H.; Lee, P. Y.; Lahaye, R. J. W. E.; Park, H. M.; An, K. H.; Kim, I. J. J Am Chem Soc. 2008, 130, 1362 – 1366.
CrossRef
- Shao, G. Journal of Materials Science. 2012, 47, 4400 – 4409
CrossRef - Siburian, R; Nakamura, J. The Journal of Physical Chemistry C, 2012, 116, 22947 – 22953.
CrossRef - Liu, Z.; Zhang, G.; Lu, Z.; Jin, X.; Chang, Z. Nano Research. 2013, 6, 293 – 301.
CrossRef - Geng, D.; Yang, S.; Zhang, Y.; Yang, J.; Liu, J.; Li, R. Applied Surface Science. 2011, 257, 9193 – 9198.
CrossRef - Chae, D. H.; Utikal, T.; Weisenburger, S.; Giessen, H.; von Klitzing, K.; Lippitz, M. Nano Lett. 2011, 11, 1379.
CrossRef - Shao, G. Journal of Materials Science. 2012. 47, 4400 – 4409
CrossRef - Avinav, G.; Nandgaonkar.; Wang, Q.; Fu, K.; Krause, W. K. A. Green Chem. 2014, 16, 3195 – 3201.
- Acik, M.; Lee, G.; Mattevi, C.; Pirkle, A.; Wallace, R. M.; Chhowalla, M.; Cho, K.; Chabal, Y. . J.Phys.Chem.C. 2011, 115, 19761 – 19781.
CrossRef - Siburian, R.; Sebayang, K.; Supeno, M.; Marpaung. Chemistry Select. 2017, 2, 1188 – 1195.

This work is licensed under a Creative Commons Attribution 4.0 International License.
![]()
A New Edition of Web of Science
Journal Impact Factor
2022: 0.5
Five Year: 0.8
Journal is Indexed in

Cabells Whitelist
![]()


