Electrochemical Trifluoromethylation of Isonicotinic Acid Hydrazide Using Cyclic Voltammetry and Galvanostatic Electrolysis
Raja Beryl J and Joseph Raj Xavier
Department of Chemistry, Vel Tech Rangarajan Dr. Sagunthala R and D Institute of Science and Technology, Avadi, Chennai-600 062, Tamil Nadu, India.
Corresponding Author E-mail: drjosephrajxavier@gmail.com
DOI : http://dx.doi.org/10.13005/ojc/3404050
Article Received on : 14-03-2018
Article Accepted on : 11-07-2018
Article Published : 30 Jul 2018
Trifluoromethylation of isonicotinic acid hydrazide has been investigated in trifluoroacetic acid containing pyridine, triethylamine and sodium trifluoroacetate dissolved in acetonitrile on platinum and glassy carbon electrodes using cyclic voltammetry. LSVs for isonicotinic acid hydrazide in 0.1 M TFA/ Py/TEA/NaTFA in acetonitrile on platinum electrode show that there is no distinct oxidation peak for the oxidation of isonicotinicacid hydrazide within the voltammetric region of 0.0 to 1.6 V vs Ag and it gets oxidized anodically in the gas evolution region itself. TFA/ NaTFA medium shows slightly higher current density than the other two media for the oxidation of isonicotinic acid hydrazide. CVs for different concentrations of isonicotinic acid hydrazide show that anodic peak becomes broad and flat. It shows that severe adsorption of INAH/product takes place on the glassy carbon electrode during the voltammetry scanning. Galvanostatic electrolysis of INAH in TFA/Py/ACN medium at low current density on Pt shows good conversion with low selectivity.
KEYWORDS:Cyclic Voltammetry; Galvanostatic; Isonicotinic Acid; Trifluoromethylation
Download this article as:| Copy the following to cite this article: Raja B. J, Xavier J. R. Electrochemical Trifluoromethylation of Isonicotinic Acid Hydrazide Using Cyclic Voltammetry and Galvanostatic Electrolysis. Orient J Chem 2018;34(4). |
| Copy the following to cite this URL: Raja B. J, Xavier J. R. Electrochemical Trifluoromethylation of Isonicotinic Acid Hydrazide Using Cyclic Voltammetry and Galvanostatic Electrolysis. Orient J Chem 2018;34(4). Available from: http://www.orientjchem.org/?p=47727 |
Introduction
Organofluorine compounds have distinctive chemical, physical and biological properties. Recently, there has been increasing interest in the chemistry of organofluorine compounds, which find applications in a wide variety of fields such as material science, medicinal chemistry and theoretical chemistry.1-3 On the other hand, organic compounds containing carbon-fluorine bonds are rare in nature and only twelve compounds containing C-F bond have natural abundant. Therefore, fluorine atom must be introduced by appropriate methods into other available substances at a desired stage in the preparative procedure.
Fluorine gas is useful for direct fluorination of organic substances. However, fluorination using fluorine gas is rather difficult to control precisely, owing to its extremely high reactivity.4 In place of fluorine gas, anhydrous HF has been widely used for the synthesis of organofluorine compounds. However, anhydrous HF is volatile and highly corrosive and hence they are very difficult to handle. The trifluoromethylated compounds have been widely used in pharamaceutical and medicinal applications particularly as tuberculation agent. In view of importance of heterocyclic compounds, isonicotinicacid hydrazide (INAH) is taken as substrates for electrochemical trifluoromethylation. The most of the works related to the electro organic synthesis of trifluoromethylated compounds has used trifluoroacetic acid (TFA) and sodium trifluoroacetate (NaTFA) as sources of trifluoromethyl group and pyridine (Py) used for increasing the conductivity of the medium for electrolysis.5-12 To the best of our knowledge, electrochemical trifluoromethylation of INAH has not been reported elsewhere.
The aim of the present work is to investigate trifluoromethylation of isonicotinicacid hydrazide in trifluoroacetic acid containing pyridine, triethylamine and sodium trifluoroacetate dissolved in acetonitrile on platinum and glassy carbon electrodes using cyclic voltammetry. Galvanostatic electrolysis of isonicotinic acid hydrazide was done on platinum in the same media and the products were characterized by GC-MS. It is also aimed to analyze the voltammetric parameters such as oxidation peak current and peak potential of INAH using CV on glassy carbon and Pt electrodes in different electrolyte media as well as Galvanostatic electrolysis of INAH on Pt and optimisation of different parameters such as faradic charge, current density and different mole ratios of supporting electrolyte on the selectivity of trifluoromethyl derivative of INAH.
Experimental Details
Preparation of Sodium Trifluoroacetate
The conversion of trifluoroacetic acid into corresponding acetate salt is usually achieved by stirring the acid with sodium bicarbonate under cold condition. 50 ml of trifluoroacetic acid was taken in a 100 ml round bottom flask and neutralized with 54.6 g of sodium bicarbonate with constant stirring under cold condition. After completion of this reaction (pH 7), the solution was evaporated to dryness using vacuum evaporator. Finally, the salts of sodium trifluoroactetate were obtained.
Reagents
All chemicals were of analytical grade. Potassium ferrocyanide, Sodium bicarbonate, pyridine, isonicotinicacid hydrazide, Trifluoroacetic acid, Triethylamine, Acetonitrile and Acetone were purchased from Merck, Germany.
Cyclic Voltammetric Studies
An undivided glass cell with the capacity of 15 cm3 was used for cyclic voltammetric experiment. The cell had provision for gas inlet and outlet. Nitrogen gas was used for the deaeration. Remi magnetic stirrer with the Teflon glad paddle was used to stir the electrolyte. High purity platinum (area 0.06cm2) and glassy carbon electrodes (GCE, area 0.07cm2) were used as working electrodes throughout the present study. Silver electrode was used as quasi reference electrode. A platinum foil was used as a counter electrode. GCE was sufficiently polished with emery sheets starting from 1/0, 2/0, 3/0 and 4/0 (John Oakey, England), followed by washing with triple distilled water and trichloroethylene to get reproducible voltammograms. The GCE was activated by electrochemical cycling as described in the literature. The electrode activity was frequently checked with the ferricyanide/ferrocyanide redox system13 until to get the ΔEp value very close to 60mV. All the experiments were carried out at 25 ± 1ºC. Cyclic voltammetric (CV) measurements were recorded using an Eco Chemie Autolab Potentiostat system under computer control.
Glavanostatic Electrolysis
An undivided cell with 25 ml capacity of polypropylene tube served as preparative cell for trifluoromethylation of INAH. The anode was a rectangular platinum foil (3.5 cm2) and the cathode was stainless steel (3.5cm2). Acetonitrile (25 ml) containing 0.1 mol/L(0.342 g) of isonicotinic acid hydrazide, 0.25 mol/L(0.712g) of trifluoroacetic acid and 0.1mol/L(0.197g) of pyridine was introduced into the cell. Electrolysis was carried out galvanostatically at room temperature. After completion of the electrolysis, the electrolyte was distilled out and the product mixture was identified by GC-MS.
Results and Discussion
Cyclic Voltammetric (CV) Studies
Cyclic voltammetric studies were done in different solvent-supporting electrolyte media with and without INAH to find out the feasibility of electrochemical oxidation by analyzing different voltammetric parameters such as the anodic peak potential and anodic peak current. Figure 1 represents the typical linear sweep voltammograms (LSVs) for different concentrations in the absence and presence of INAH in 0.1 M TFA/0.1 M Py/ACN on Pt electrode at a sweep rate of 40 mV s-1. It is observed from the CV that there is no distinct oxidation peak for the oxidation of INAH within the voltammetric region of 0.0 to 1.6 V vs Ag. However, the anodic current increases from 0.5 V itself and further goes steeply. The separation between the LSVs is well defined for different concentrations of INAH and the gas evolution potential region also shifts towards negative direction. This leads to the conclusion that INAH gets oxidized anodically in the gas evolution region it self.
Table 1 presents the anodic current density obtained at a potential of 1.6 V vs Ag in the above medium in absence and presence of isonicotinic acid hydrazide at different concentrations in order to compare the ease of oxidation of isonicotinic acid hydrazide. It is shown from the table that the anodic current density at 1.6 V in presence of 1.0 mM of isonicotinicacid hydrazide is found to be higher than that in its absence and the current increases gradually with the increase in concentration of isonicotinic acid hydrazide. This shows that isonicotinic acid hydrazide gets oxidized effectively in this solvent-supporting electrolyte system. Similar LSVs were recorded for different concentrations of isonicotinic acid hydrazide in trifluoroacetic acid containing triethylamine (TEA) dissolved in ACN. The voltammograms recorded for different concentrations of isonicotinic acid hydrazide along with its absence in the above medium on platinum electrode at a same sweep rate of 40 mV s-1 are shown in Fig. 2. The isonicotinic acid hydrazide does not show any distinct oxidation peak in the measured voltammetric region. The anodic current density obtained at 1.6 V for different concentrations of isonicotinic acid hydrazide in this medium increases from the background and also with increase in its concentration as shown in the table.
Table 1: Anodic current density of isonicotinicacid hydrazide on platinum electrode in different media obtained from cyclic voltammetry at a potential of 1.6 V vs Ag (Sweep rate: 40 mV s-1)
|
Expt. No. |
Medium |
Concentration of INAH (mM) |
Current density (mA cm-2) |
|
1 |
TFA + Pyridine |
0.0 1.0 3.0 5.0 |
0.67 1.12 1.36 1.76 |
|
2 |
TFA + Triethylamine |
0.0 1.0 3.0 5.0 |
0.32 0.71 1.82 3.51 |
|
3 |
TFA + Sodium trifluoroacetate |
0.0 1.0 3.0 5.0 |
0.24 1.33 1.82 3.31 |
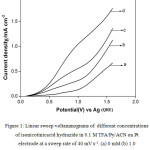 |
Figure 1: Linear sweep voltammograms of different concentrations of isonicotinicacid hydrazide in 0.1 M TFA/Py/ ACN on Pt electrode at a sweep rate of 40 mV s-1. (a) 0 mM (b) 1.0 mM (c) 3.0 mM (d) 5.0 mM.
|
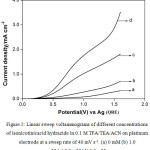 |
Figure 2: Linear sweep voltammograms of different concentrations of isonicotinicacid hydrazide in 0.1 M TFA/ TEA /ACN on platinum electrode at a sweep rate of 40 mV s-1. (a) 0 mM (b) 1.0 mM (c) 3.0 mM (d) 5.0 mM. |
Fig.3 presents LSVs recorded for different concentrations of isonicotinic acid hydrazide in TFA/NaTFA buffer medium in ACN. It does not show any drastic changes in its voltammetric behavior when compared to the CVs obtained in trifluoroacetic acid containing amines. However, in specific, background current density measured at 1.6 V for this medium is found to be very low when compared to the other two media (Table 1). On the other hand, the current densities obtained at different concentrations of isonicotinicacid hydrazide, particularly at 1.0 mM, 3.0 mM and 5.0 mM show a high value. The TFA/ NaTFA show slightly higher current density than the other two media. Further the isonicotinicacid hydrazide shows higher anodic current densities at low concentrations in TFA/Py and in NaTFA media and high current values are noted at its high concentrations in TFA/TEA and in TFA/NaTFA media.
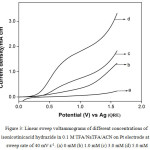 |
Figure 3: Linear sweep voltammograms of different concentrations of isonicotinicacid hydrazide in 0.1 M TFA/ Na TFA/ACN on Pt electrode at a sweep rate of 40 mV s-1. (a) 0 mM (b) 1.0 mM (c) 3.0 mM (d) 5.0 mM. |
CVs were also recorded on glassy carbon electrode instead of platinum in order to find out effect of electrode material on the anodic oxidation of isonicotinic acid hydrazide CVs in the absence and presence of different concentrations of INAH in 0.1 M TFA/Py in ACN. Fig. 4 represents typical CVs in the absence and presence of different concentrations of INAH in 0.1 M TFA/Py in ACN on glassy carbon electrode at a sweep rate of 40 mV s-1. Isonicotinic acid hydrazide (1.0 mM) shows a single oxidation peak at 1.4 V in the forward direction and in the reverse sweep no reduction peak is observed. On increasing the concentration from 1.0 mM to 3.0 mM and 5.0 mM the anodic peak current increases suddenly and shift towards more positive value. The CVs show that there is possibility of adsorption of the reactants/products on the working electrode surface during the voltammetry scanning.
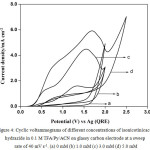 |
Figure 4: Cyclic voltammograms of different concentrations of isonicotinicacid hydrazide in 0.1 M TFA/Py/ACN on glassy carbon electrode at a sweep rate of 40 mV s-1. (a) 0 mM (b) 1.0 mM (c) 3.0 mM (d) 5.0 mM. |
Fig. 5 shows typical multi sweep CVs of 5 mM of isonicotinic acid hydrazide in 0.1 M TFA/Py/ACN on glassy carbon electrode at a sweep rate of 40 mV s-1 for four scans. With successive sweep rate, the anodic peak current decreases from 4.48 to 1.14 mA cm-2. The ratio of peak current density obtained at fourth scan to the same at first scan namely, I4pa/I1pa, was calculated and the value is 0.25. This shows that severe adsorption of INAH/product takes place on the glassy carbon electrode during the voltammetry scanning. Similarly, CVs for different concentrations of isonicotinic acid hydrazide in 0.1 M TFA/TEA/ACN on glassy carbon at a sweep rate of 40 mV s-1 are shown in Fig. 6 and the anodic peak was found to be very broad and flat. Multisweep cyclic voltammograms of isonicotinic acid hydrazide (5 mM) on glassy carbon electrode at a sweep rate of 40 mV s-1 confirms severe adsorption on the electrode surface as shown in Fig.7.
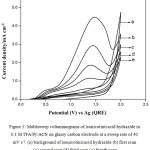 |
Figure 5: Multisweep voltammograms of isonicotinicacid hydrazide in 0.1 M TFA/Py/ACN on glassy carbon electrode at a sweep rate of 40 mV s-1. (a) background of isonicotinicacid hydrazide (b) first scan (c) second scan (d) third scan (e) fourth scan. |
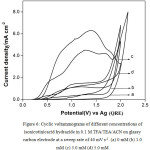 |
Figure 6: Cyclic voltammograms of different concentrations of isonicotinicacid hydrazide in 0.1 M TFA/TEA/ACN on glassy carbon electrode at a sweep rate of 40 mV s-1. (a) 0 mM (b) 1.0 mM (c) 3.0 mM (d) 5.0 mM. |
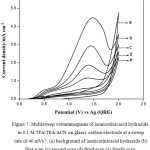 |
Figure 7: Multisweep voltammograms of isonicotinicacid hydrazide in 0.1 M TFA/TEA/ACN on glassy carbon electrode at a sweep rate of 40 mVs-1. (a) background of isonicotinicacid hydrazide (b) first scan (c) second scan (d) third scan (e) fourth scan |
The ratio I4pa/ I1pa is very low (0.24). It can be seen from Fig. 8 that similar voltammetric patterns observed for isonicotinic acid hydrazide in TFA/NaTFA/ACN on glassy carbon at a sweep rate of 40 mV s-1 indicate electrode passivation. It has been shown from the results that the platinum had been chosen as the electrode of choice instead of glassy carbon electrode for the subsequent experiment involving the galvanostatic electrolysis of isonicotinic acid hydrazide. The anodic current densities of 3.0 mM of isonicotinicacid hydrazide obtained at 1.6 V in Pyridine, Triethylamine and sodium trifluoroacetate on the same platinum electrode at the same sweep rate of 40 mV s-1 are found to be 1.36, 1.82 and 1.82 respectively.
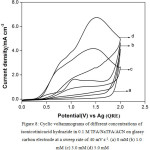 |
Figure 8: Cyclic voltammograms of different concentrations of isonicotinicacid hydrazide in 0.1 M TFA/NaTFA/ACN on glassy carbon electrode at a sweep rate of 40 mV s-1. (a) 0 mM (b) 1.0 mM (c) 3.0 mM (d) 5.0 mM. Click here to View figure |
Galvanostatic electrolysis of isonicotinic acid hydrazide
Constant current electrolysis of isonicotinicacid hydrazide was carried out on platinum electrode containing three different media namely TFA/Py, TFA/TEA, TFA/NaTFA in ACN in an undivided cell. Since the background current densities obtained from CVs for the three media on Pt electrode in absence of isonicotinic acid hydrazide were found to be low, the concentrations of TFA and amines had been increased by four times. The concentration of TFA had been kept slightly higher than the amine in order to maintain the acidity of supporting electrolyte solution. Three different operating parameters namely mole ratio of starting material to supporting electrolyte, charge passed and the current density had been varied. The GC-MS spectrum of the product mixture had been taken directly after the electrolysis, the products had been identified from m/z values and then the conversion percentage and selectivity of the products had been calculated. The conversion percentage indicates the total percentage of products in the product mixture. Selectivity was calculated by dividing the percentage of mono substituted, di substituted and tri substituted trifluoro derivative of isonicotinic acid hydrazide in the reaction mixture with the conversion percentage. It can be seen from the table 3 that as more number of products is formed, the lesser will be the selectivity. Galvanostatic electrolysis of isonicotinic acid hydrazide (0.025 M) in TFA/Py/ACN on platinum electrode with the reactant/supporting electrolyte ratio of 1:20 was carried out. The total charge passed was 1.0 F mole-1 with the applied current density of 1.5 mA cm-2. The product mixture was analyzed by GC-MS spectra, which is shown in Fig. 9.
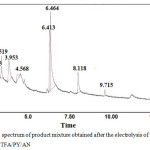 |
Figure 9: GC spectrum of product mixture obtained after the electrolysis of isonicotinicacid hydrazide in TFA/PY/ACN. |
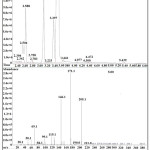 |
Figure 10: GC-MS spectra of product mixture obtained after the electrolysis of isonicotinicacid hydrazide in TFA/PY/AN. |
The GC-MS spectra shows mono substituted trifluoromethyl derivative of isonicotinic acid hydrazide at 3.15 (1.35 %), reactant at 3.52 (5.5 %) followed by many products. The GC-MS spectrum of the product is shown in Fig. 10. Table. 2 shows 94% conversion and 2% selectivity for Exp. No. 1, where the mole ratio of starting material and TFA/Py in ACN had been kept as 1: 20 with the passage of 1.0 F mole-1 and current density of 1.5 mA cm-2. When the current density was increased (Expt No.2, 3 in Table 3), the conversion percentage decreases significantly, however, the selectivity of mono substituted trifluoro derivative increases. Higher selectivity (20%) was noted in the case of increasing the charge passed by 3.0 F mole-1 and current density by 5.0 mA cm-2 without changing the mole ratio of reactant to supporting electrolyte. In order to increase the conversion of the product namely trifluoromethyl derivative of isonicotinicacid hydrazide, triethylamine was added instead of pyridine in the supporting electrolyte with the passage of 3.0 F mole-1 and applied current density of 5.0 mA cm-2. From the GC-MS spectrum of the product mixture, it is observed that there is no formation of mono substituted trifluoro derivative of isonicotinic acid hydrazide.
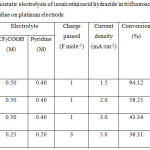 |
Table 2: Galvanostatic electrolysis of isonicotinicacid hydrazide in trifluoroacetic acid containing pyridine on platinum electrode. |
The galvanostatic electrolysis of isonicotinic acid hydrazide carried out in TFA containing NaTFA under identical experimental conditions shows full conversion (100%). This result is also consistent with the voltammetric data obtained for INAH in TFA/NaTFA/ACN medium, where the noted current density at 1.6 V was comparatively high. The above studies show that the background current density also plays an important role in increasing the conversion percentage. However, TFA/Py/ACN shows better selectivity than TFA/NaTFA/ACN under the same experimental conditions. The exact reaction reason for the high selectivity of the isonicotinic acid hydrazide under this condition is unknown. The plausible mechanism for the trifluoromethylation of isonicotinic acid hydrazide is shown in scheme 1.
Conclusion
Galvanostatic electrolysis of isonicotinic acid hydrazide was done on platinum in the same media and the products were characterized by GC-MS. LSVs for isonicotinic acid hydrazide in 0.1 M TFA/ Py/TEA/NaTFA in acetonitrile on platinum electrode show that there is no distinct oxidation peak for the oxidation of isonicotinic acid hydrazide within the voltammetric region of 0.0 to 1.6 V vs Ag and it gets oxidized anodically in the gas evolution region itself. The isonicotinic acid hydrazide shows higher anodic current densities at low concentrations in TFA/Py and NaTFA media and high current values are noted at its high concentrations both in TFA/TEA as well as in TFA/NaTFA media. CVs for different concentrations of isonicotinic acid hydrazide in all the three media on GC electrode show that anodic peak becomes broad and flat, where the low value of I4pa/ I1pa reveals that severe adsorption of INAH/product takes place on the GC electrode during the voltammetry scanning. Galvanostatic electrolysis of INAH in TFA/Py/ACN medium at low current density on Pt shows good conversion with low selectivity. When the current density was increased, the conversion percentage decreases significantly, however, the selectivity of mono substituted trifluoro derivative increases by 20 %. TFA/TEA/ACN medium shows full conversion but no mono fluoro derivative formed in this medium.
Acknowledgements
The authors thank Prof. Dr. A. Abudhahir, Prof. Dr. P. Sarasu and the Management of Vel Tech Rangarajan Dr. Sagunthala R&D Institute of Science and Technology, Avadi, Chennai-600 062, Tamil Nadu, India for their constant encouragement and constructive suggestions regarding this research.
Reference
- Purser,S.; Moore, P.R.; Swallow, S.; Gouverneur, V. chem. Soc. Rev. 2008, 37, 320-330.
CrossRef - Begue, J.P.; Bonnet-Delpon, D.; Bioorganic and medicinal chemistry of fluorine, Inc., John wiley & sons, (2008).
CrossRef - Kenji Uneyama, Organofluorine chemistry, John wiley & sons, (2007).
- Melot, B.C.; Tarascon, J.M. Acc.Chem.Res. 2013, 46, 1226–1238.
CrossRef - Grushin, V.V.; Marshall, W.J. J. Am. Chem. Soc. 2006, 128, 12644.
CrossRef - Andrei, G.A.; Shermolovich, Yuriy. Curr. Top. Med. Chem. 2014, 14, 952-965.
- Kiss, L.E.; Ferreira, H.S.; Learmonth, D.A. Organic Letters, 2008, 10, 1835-1837.
CrossRef - Hou, Y.K.; Higashiya, S.; Fuchigami,T. Electrochim. Acta 2000, 45, 3005-3010.
CrossRef - Frost, R.; Gautier, D. J. Anal. Tech., 2006, 30, 210-215.
- Loska, R.; Majcher, M.; Makosza, M. J. Org. Chem. 2007, 72, 5574-5580.
CrossRef - Qing, F.L.; Zhang, X.G.; Peng, Y.Y.; J. Fluor. Chem., 2001, 111, 185-187.
CrossRef - Debarge,S.; Violeau,B.; Bendaoud, N;, Jouannetaud, M.P.; Jacquesy,J.C. Tetrahedron Ltt. 2003, 44, 1747-1750.
CrossRef - Egami, H.; Shimizu, R.; Usui, Y.; Sodeoka, M. J. Fluor. Chem. 2014, 167, 172-178.
CrossRef

This work is licensed under a Creative Commons Attribution 4.0 International License.
![]()
A New Edition of Web of Science
Journal Impact Factor
2022: 0.5
Five Year: 0.8
Journal is Indexed in

Cabells Whitelist
![]()


