Detection, Characterisation and Determination of Indoor Organic Air Pollutant and fine Particles Produced by Laser Printers
Narges. Mortaji1, Mohammad Ebrahim Olya1 and Maryam Ataeefard2
1Department of environmental research, Institute for Color Science and Technology, Tehran, Iran.
2Department of Printing Science and Technology, Institute for Color Science and Technology, Tehran, Iran.
Corresponding Author E-mail: olya-me@icrc.ac.ir
DOI : http://dx.doi.org/10.13005/ojc/3404034
Article Received on : 8 June, 2017
Article Accepted on : 30 May, 2018
Article Published : 10 Jul 2018
In the present study, the air pollution of hp 1200 and hp 1320 laser printers was studied as two types of the most conventional laser printers. Due to the researchs, there was a little exact available data about the organic pollutants produced by these instruments. So this study was evaluated in the glass box chamber based on the standard of ISO16000-9 for the first time and the samples were analyzed by Gas Chromatography, mass spectroscopy and Fourier transform infrared spectroscopy to identify the organic pollutants. Particle Size Analyzer was used to determine the scale and the count of the particles exist in the glass box chamber. According to the results, the different particles (0.5-10 ) and the different organic pollutatns were detected. Also, hp 1200 laser printer released more amounts of the fine particulate matters than hp 1320 laser printer but the amount of the organic pollutants released from hp 1200 laser printer was negligible in comparison with hp 1320 laser printer.
KEYWORDS:Indoor Air Pollution; Laser Printer Pollution; Organic Pollutants; Particulate Matters
Download this article as:| Copy the following to cite this article: Mortaji N, Olya M. E, Ataeefard M. Detection, Characterisation and Determination of Indoor Organic Air Pollutant and fine Particles Produced by Laser Printers. Orient J Chem 2018;34(4). |
| Copy the following to cite this URL: Mortaji N, Olya M. E, Ataeefard M. Detection, Characterisation and Determination of Indoor Organic Air Pollutant and fine Particles Produced by Laser Printers. Orient J Chem 2018;34(4). Available from: http://www.orientjchem.org/?p=47238 |
Introduction
Nowadays, air pollution is one of the largest environmental problem because of the air quality importance for human health. Human daily air consumption is around 3 times of water and 16 times of foods. Hence, air pollutions are more dangerous than foods and water pollutions. Whereas, million tons of pollutants have been annually entered through the human respiratory air. Air pollution means some components, producing through human activities or natural processes, exist in the Earth’s atmosphere which has harmful effects on human’s life and environment.1 There are some methods to classify the air pollutants. One of these methods is to divide them into two classes of the closed interior ambient pollutants and the exterior ambient pollutants. Despite the common belief, pollutants in the closed interior ambient are more dangerous than those in the exterior ambient.2 The closed, interior ambient is referring to non-industrial ambient such as offices, schools, hospitals and residential areas.3 Based on statistical data, about 80% of the daily activities of each person are taking place in the indoor environment. Researches outputs prove that the amount of interior pollutants in some cases is even up to 100 times more than exterior ones and billions of dollars have been devoted to compensate undesirable consequences of this occurrence. According to the significance of air quality on the individual’s health and performance, today people pay attention to the air quality of the closed interior ambient more than ever.4-5 Measurements have shown that indoor air pollutants are differed from exterior ones by kind and amount. Nitrogen Oxide (NOx) and Sulfur dioxide (SO2) are some of the most important mineral pollutants,3,4,6 and volatile organic material, Benzene, Acetone, Formaldehyde, Toluene are some of the most important organic pollutants in the indoor environments.5 Normally, they are produced by furniture, building paints, detergents, adhesives, cooking, cigarette smoke and offices facilities like printers and copiers etc. Volatile organic compounds would be released in the gas phase in the room temperature and the atmospheric pressure. Long-term exposure to these volatile organic compounds even with low density would affect human health unfavorably. Headache, nausea, sensitivity of eye and skin, dyspnea, fatigue or even in the cases of higher densities and accordingly more risks cancer, asthma, retardation in the children and death are of the consequences.2,3,6 According to the vast usage of electronic devices such as the printers, the copy devices, in the recent years, in 1987, the Ozone and particulate matter was detected as printer pollutants for the first time. The volatile organic compounds (VOCs) and Nitrogen dioxide(NO2) in 1999 and the fine particulate matter were detected as printer pollutants in 2006.7 Ferion 12, Ferion 11, Methylene Choloride, Chloroform, Benzene and their byproducts, Toluene, xylene byproduct and Styrene were identified as pollutants for laser printers, ink jet printers and copy devices in standby situation and working time. The laser printers are more pollutant than the ink jet printers, scanners and copy devices and they emitted particulate matters. Also Ozone was detected just during working time.8
Released contaminants from laser printers could be organic or mineral, volatile and semi-volatile organic compounds, fine and ultrafine particulate matters or Ozone. In the previous researches some volatile organic compounds are recognized such as: Toluene, Ethylbenzene, Meta-Para-Xylene, Ortho-Xylene, Styrene, Isopropylbenzene, n-propylbenzene, Benzaldehyde, Alpha Methylstyrene, 1, 2, 4 Trimethylbenzene, Butylbenzene, Acetophenone, Methoxy-Ethyl benzene, n- Decane, 2-ethyl 1- Hexanol, Limonene, n- Nonanal, n- Dodecane, Formaldehyde, Acetaldehyde, Acetone, Propionaldehyde, 2-butanone, Butyraldehyde etc.9
In addition to organic compounds, some inorganic compounds are also recognized by Scanning Electron Microscopy with X-ray micro analysis (SEM/EDX) such as: Aluminum, Chlorine, Calcium, Cobalt, Chromium, Copper, Iron, Potassium, Magnesium, Sodium, Nickel, phosphorus, Sulfur, Manganese, Silicon, Titanium and Zinc. Other released particles from the body of printers such as Silicon, Sulfur, Chlorine, Calcium, Titanium, Chromium, Iron and Boron are identified by X-ray Fluorescence Spectrometry(XRF) technique.10
The previous studies show that contamination values, produced by laser printers, are not in the same levels and they are divided into four principle groups of: 1- printers without releasing contaminations like color laser printer hp 4550DN, color laser printer hp 8500DN, laser printer hp 2300dnt, laser printer hp 4 plus, laser printer hp 5000n, laser printer hp 5N, laser printer hp 5si/NX, RICOH Aficio and 2- Printers with releasing low level of contaminations like Canon IRC6800, Laser printer hp 5M, Laser printer 9000dn, RICOH, CL3000DN, 3- printers with releasing mid-level of suspended fine particles like Laser printer hp 1020, Laser printer hp 4200dnt and finally 4- printers with releasing high level of contaminations like color laser printer 4650dn, color laser printer hp 5550dnt, color laser printer hp 8550N, laser printer hp 2420dn, laser printer hp 1320n, laser printer hp 4220dtn, laser printer hp 8000DN, laser printer hp 4250n, laser printer hp 5 (a).12
Morawska et all in 2009 studied on fine particulate matters and released organic contaminants from the printers. Two types of laser printers were selected for this study. hp 1320 laser printer belongs to the group 4 (high contaminants) and hp 1200 laser printer belongs to group 2 (low contaminants). Based on the achieved outputs, temperature is an important factor to release fine particulate matters and organic pollutants from printers in which at the temperature below a certain level, (around 100°C for organic pollutants and around 140°C for fine suspended particles), particle releasing was not observed. On the other hand, measurements showed that during and after printing operations, there were differences between values and time of releasing organic pollutants and fine suspended particles. Both of printers, low-contaminant and high-contaminant, had been demonstrated an important change at the initial working time (t0). In the following, however, different outputs were resulted for each printer. After the primary explosion in the printer hp 2200(low contaminant) released particles count were decreased after 2 minutes but in the hp 1320, which was identified as a high contaminant printer particles releasing has continued for 10 minutes. Common point in both printers was that at the end of operations, released particles had been decreased, while the organic pollutants releasing has continued and this procedure went through its maximum afterward was interesting.13
The aim of most researches results was focused on releasing fine and ultrafine particles from printers, and less attention has been cast on the organic contaminants. Hence, in this study both organic contaminants and fine suspended particles, released from laser printers hp 1320 and hp 1200, have been measured and compared. hp 1320 laser printer belongs to high-contaminants group but there is no exact data about kind and amount of its organic pollutants. No individual study has also implemented on the hp 1200 laser printer, which is a high-consumption printer. So in the present research for the first time its contaminants values have been considered to assess producing of organic pollutants and fine suspended particles.
Material and Methods
Materials
Two hp laser printers (1320 and 1200) equipped by the origin toner were used and glass box chamber was fabricated based on ISO 16000-9 in the laboratory.14 Particle Size Analyzer PSA Met One 531 AEROCET and Gas Chromatography and Mass Spectroscopy GC/MS analyzer (GC 7890A, Mass 5975C Agilent) Technology were used to identify of the pollutants. Ozone assessment was done by the portable Aeroqual device and FTIR spectrum test was taken continuously (real time) from the air of the ambient inside the box by “Spectrum One Device” made in Perkin Elmer.
Experimental Chamber and Laser Printers
The experiments were done in an experimental glass box chamber with an interior volume of 1m3. Before starting the printing process, the climatic conditions were set to a temperature of T=23°C and a relative humidity of RH=50%. Temperature and relative humidity were continuously recorded. The pages have been printed by black and white (b/w) printer with an area coverage of 5% on the normal white paper (80g/m3). A humidity generator, a fan for circulating air flow, air flow meter, thermometer, hygrometer and its controller and a Zero air cylinder for fresh air supply to the chamber, as accessories were used. The printing schedule was in accordance with the ECMA-328 standard.15 The time measurements were set at 3 levels, the first was before starting (idle time), the second was after 10-minute printing time and the last one was over 1 hour resting time.
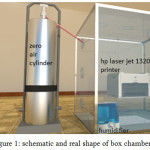 |
Figure 1: Schematic and real shape of box chamber Click here to View figure |
Procedure
The tests were performed in 70 minutes based on the standard of ECMA-328.15 This time insists of 10 minutes of printer working and 60 minutes of resting time. Air sampling of inside of the box was done in 3 steps. First sampling: when the printer was turned on, but it didn’t work. Second sampling: after 10 minutes of working time. Third sampling: after 60 minutes of resting time. In all steps of analysis, counting and size scaling of fine particles released from the printers was analized by PSA and the organic pollutants were identified by GC/MS and FTIR. Figure 2 shows a schematic view of the time of samplings and the associated analysis.
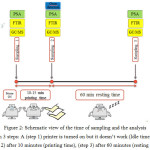 |
Figure 2: Schematic view of the time of sampling and the analysis in 3 steps: A (step 1) printer is turned on but it doesn’t work (Idle time), (step 2) after 10 minutes (printing time), (step 3) after 60 minutes (resting time) Click here to View figure |
Results and Discussion
Particle size Analysis
Measurements demonstrated that both experimental printers had released fine suspended particles. hp 1200 laser printer released more particles than laser printer HP 1320.
Figure 3 shows the number of fine particulate matters with two different sizes of 5 and 0.5 microns through 3 steps of experiments.
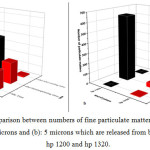 |
Figure 3: A comparison between numbers of fine particulate matters with particle size of (a): 0.5 microns and (b): 5 microns which are released from both printers of hp 1200 and hp 1320. |
hp 1200 showed a growth of 180% and 60% in the number of 0.5 micron particles in the step 2 and 3, respectively. For particles 5 microns’ particles the significant growth was 65000% in step 2 and no evidence of growth was observed in step 3. The same procedure was done for printer hp 1320. For 0.5 micron particles the growths of 15% and -34% were resulted and for 5 micron particles it was about 1000% and -75% for steps 2 and 3, respectively. The negative sign shows a decrease in the amount of particles.
In the three steps of measurements it was observed that the number of fine particulate neither matters nor their size were not similar for printer hp 1320 and hp 1200. The results show that before starting the printers, fine particulate matters previously had been released in the medium. This phenomenon was also observed in the previous studies [16]. In fact, once the printer is turned on and prepared to print, fine particles released due to the fuser roller heating up. In this condition it should be expected for the fuser temperature to increase even up to 110 °C.,16 both of the number and the density of particles increase after 10 minutes of printing. In the step 3 of measurements which was done 60 minutes after printers resting time, the number and density of particles again were decreased. The similar findings are presented in the study by Lidia Morawska et all.13 In addition to the number of fine suspended particles, their densities in four sizes of PM1, PM2.5, PM7, and PM10 were also assessed and the outputs are provided in the Figure 4.
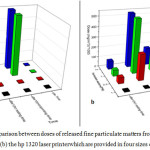 |
Figure 4: A comparison between doses of released fine particulate matters from (a): the hp 1200 laser printer and (b) the hp 1320 laser printerwhich are provided in four sizes of 1, 2.5, 7 and 10. Click here to View figure |
According to the results, fine particles had been released during the operations of printers, although the number of 0.5 micron particles was decreased after an hour. However, the amount of fine particles was still above the primary level before the operations commencement. The same procedure was observed in the measurements of particle density for 1, 2.5, 5 and 10 microns. This decreasing in the number of particles was due to their uniform distributions all around the test box after 60 minutes of resting time. Two observed values of zero in the steps 1 and 3 for 5 microns particles were not a confirmation that there was not any particle, but it meant the numbers of particles with this size were below the filter level of recognition of the devices and consequently the zero values were reported. Since the amount of 5-microns particle was 100 times more than those with 0.5 microns, it was expected that whenever there was no turbulence in the surrounding air streams, most of them became deposited.17 It was also observed that fine particles were released during operation of the laser printer hp 1320, but after 60 minutes of printer resting time, the amount of these particles got decreased and even reached less than primary values. This could be explained by increasing the relative humidity during the test performance. In fact, after printing around 80 pages (A4), the relative humidity increased and at the end of the performance it went up to 90%. These humidity increasing caused of the evaporation of paper’s moisture and consequently, the condensation of air humidity in the test chamber. One of the influential factors in the releasing fine particles from printers is the temperature of fusing.18 For hp 1320 it took about 0.1 Sec to reach to fusing temperatures 200°C and for the printer hp 1200 this temperature is 180°C. Fusing temperature of printer hp 1320 was higher than printer hp 1200 and also, its relative humidity of the surrounding air was higher than hp1200. Increasing of the relative humidity causes lumping of released particles in the air, where upon the heavy particles become deposited. Due to these occurrences, the amount of measured particles in the step 3, at the end of printer resting time compared to the primary level got decreased. The same result was observed in the previous studies for hp 1320 laser printer.13 Due to the recent studies, the bigger particles were produced increasing of relative humidity in the air.17,19-20 Also it should be considered that nature of fine particulate matters might affect the relationship of them with relative humidity of the air. Most of the released fine particulate matters from printers are the types of carbons and based on the previous studies they have reverse dependency with relative humidity.21
Figure 3 shows that before commencement of the printing operations there existed fine particulate matters in the box, and after 60 minutes of resting time in comparison with the primary step the density of these particles got increased. It also should be pointed out that the density of bigger particles were more than smaller ones. In fact, in the molecular dimensions, there are some differences in which smaller particles might get together and produce bigger particles, so the density of bigger particles were more than the smaller ones. The relative humidity in the air is one of the effective factors in the agglomerations of particles. The other reason is the electric charges of releasing fine particles from the printers. The results of previous studies also have confirmed this idea the charged particles would be released due to the printing mechanism and it was because of the electrically charged at the start of the process.22
Table 1, shows a comparison between the increase and decrease procedures of fine particulate matters from two trial printers. For both printers, the density of particles gets increase after 10 minutes of operations. The obtained results for hp 1320 show that, the density of the particles decreased after an hour of resting time. The reason for this occurrence might be the growth of relative humidity in the box. Increasing relative humidity, the smaller particles is gathered and produced bigger particles. Therefore, after one hour of resting time, the increasing procedure of the fine particulate matters is ceased and even the decreasing ones is observed. For particles with bigger size, this decreasing of the density of fine particulate matters is even more. For hp 1200, after 10 minutes of operations, the density of particles increased and despite hp 1320 which after one hour of resting time no trace of releasing particle is observed for the hp 1200 after one hour of resting time releasing of fine particles are still continued. The results show that, the percentage of increasing fine particles was also high after the resting time. In some of the previous researches, releasing pollutants are observed even after turning off the printers.13
Table 1: A comparison between increase and decrease procedures of the particle density after 10 minutes of operations and after one hour of resting time.
|
PM1 |
PM2.5 |
PM7 |
PM10 |
||||||
|
10 min |
1 hr |
10 min |
1 hr |
10 min |
1 hr |
10 min |
1 hr |
||
|
hp 1200 |
Er |
79% |
80% |
150% |
18233% |
18233% |
150% |
150% |
|
|
hp 1320 |
233% |
0% |
180% |
-35% |
209% |
-65% |
211% |
-52% |
|
Measurements of Released Organic Contaminants from the Printers
The organic contaminants measurement released from hp 1320 and hp 1200 show that, the measurements in the different steps of the sampling the amount and type of identifying organic contaminants are not the same. The amount of these contaminants varied for two mentioned printers. hp 1320 laser printer released much more organic pollutants than laser printer hp 1200. Analysis with two devices of FTIR (real time case) and Gas Chromatography (GC/Mass) and the sampling format in three steps of 1: before printing operations, 2: 10 minutes after the printing operations and 3: one hour after resting time, were performed. Samplings in each step were done for 3 times and the mean outputs (average outputs) were reported.
Gas Chromatography result was presented in the figure 4 for hp 1320 and hp 1200. No significant trace of releasing organic pollutants is observed for laser printer hp 1200. In the other word, hp 1200 in comparison with hp 1320 dose not releases organic contaminants. The pollutants with more than 70% probability of being released from hp 1320 were detected in the steps 2 and 3. Several types of pollutants were detected such as aromatic and aliphatic compounds, phthalate derivatives, halogen compounds and compounds containing aldehyde functional groups.
Xylene, Benzene, Treacontane, Pentaburane, Cyclotetradecane, Di buthyl phthalate, 2-furane carboxaldehide and Nonane were identified in the second step. Also, Cyclohexane, Benzenemethanol, Amphetamine, Di dosil phthalate, 2,6,8, tree methyl decane and 1,2 benzenedi carboxylic acid are the Pollutants were identified in the third step.
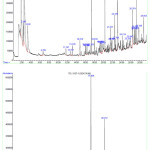 |
Figure 5: Gas Chromatography Analysis from hp 1320 laser printer after (a) 10 minutes (printing time) and (b) after 60 minutes (resting time). |
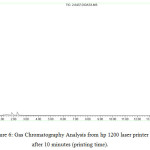 |
Figure 6: Gas Chromatography Analysis from hp 1200 laser printer after 10 minutes (printing time). Click here to View figure |
Figures 7 and table 2 show the FTIR results for hp 1200 and hp 1320 laser printer. The plots demonstrate the functional groups index of organic pollutants which are released from two trial printers.
Depicted plots in the MATLAB software; demonstrate the variety of the areas under the curves (areas under the peaks) versus time. Peaks the index, which are distinguished with circles in the figure of the comparative FTIR spectrum are selected and the areas under their curves are depicted versus time. The growth of this area and increasing procedure of the plots of the hp 1320 laser printer shows that pollutants are released immediately after printing operations (step 2) and even after one hour of resting time (step 3). Whereas for the printer hp 1200 the plots just show a direct line. Not merely there is no trace of increasing with time passing, but also somehow a decreasing procedure in the plots is observed. Because during “on-line FTIR analysis” pollutants would exit out of the box and also due to the fact that organic pollutants are not produced during and one hour after of printing operations. Figure 6 shows the variation of the areas under the FTIR curve versus the time for both printers.
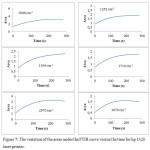 |
Figure 7: The variation of the areas under the FTIR curve versus the time for hp 1320 laser printer. Click here to View figure |
Table 2: The variation of the areas under the FTIR curve versus the time for hp 1200 laser printer.
|
Wave number (cm-1) |
1049 |
1494 |
1606 |
1737 |
2921 |
|
Time (s) |
300 |
300 |
300 |
300 |
300 |
|
Variation of the area |
3.2-3 |
1.6-1.5 |
2.6-2.5 |
2.2-2 |
3.1-3 |
Ozone contaminant measurements released from the printers
Ozone contaminants releasing in both printers are assessed continuously (on-line methods) during printing operations which resulted in no record of ozone releasing.
Conclusions
Types and amount of the released pollutants from both hp 1320 and hp 1200 laser printers were identified and measured by the analytical methods. Several kinds of pollutants like fine particulate matters and ozone and organic pollutants were assessed. Releasing particles with sizes of 0.5, 1, 2.5, 5, 7, 10 microns were demonstrated for both printers. There was a density and the amount of fine particulate matters increasing after 10 minutes of printing operations. In hp 1320, the yield of process increasing for PM0.5 was 15%, PM1 : 233%, PM2.5 : 180%, PM5 : 1000%, PM7 : 209% and PM10 : 211%, and in hp 1200 the yield increasing for PM0.5 was 180%, PM2.5 : 80%, PM5 : 65000%, PM7 : 18233%, PM10 : 150%. No trace of releasing fine particles is observed after one hour of finishing printing operation for laser printer hp 1320. Hence the measurements show less density of fine particles after one hour of the printing operations and the resting time. The yield of process for fine particulates after one hour of printing operation and in step 3 of measurements for hp 1320 was -93% for PM0.5, PM1 : 0%, PM2.5 : -35%, PM5 : -75%, PM7 : -65% and -52% for PM10 particles in which negative sign showed decrease in the number of particles. At the same situation, for hp 1200 releasing fine particles are continued after 10 minutes of printing operations and even despite hp 1320 laser printer after one hour of resting time fine particles mattersstill are released from the laser printer hp 1200. The yield of process for releasing particles are of 60% for PM0.5 particles, 79% for PM1 particles,150% for PM2.5 particles, 0% for PM5 particles, 18233% for PM7 particles and 150% for PM10 particulates. Despite hp 1200 laser printer which showed no trace of releasing organic pollutants, for hp 1320 laser printer releasing organic pollutants are observed and even it is continued after one hour of resting time. None of them showed traces of releasing of ozone pollutants. The printers belong to high pollutants printers which hp 1320 laser printer releases organic pollutants and fine particulate matters but hp 1200 laser printer releases only fine suspended particles. Relative humidity in the surrounding air is in direct relation with density of fine particulate matters in there. The heavier particles would be deposited because of their relative humidity. Hence increased relative humidity could be a factor of decreasing contaminations from fine particulate matters in the air.
Acknowledgement
The authors would like to thank the colleagues of Institute for color science and technology for their helps.
Reference
- Hewitt, N.; Jackson, A. V.; Handbook of atmospheric science: principles and applications. Blackwell Publishing: Oxford. 2004.
- Yao, N.; Yeung, K.L.; Chemical Engineering Journal. 2011, 167, 13-21.
CrossRef - Wang, H.; Ang, M.; Tade, M.O,; Environment International State of the art. 2007, 33, 694-705.
CrossRef - Yu, L.; Brouwers, H.J.H.; Applied Catalysis B. 2009, 92, 454-461.
CrossRef - MO, J.; Zhang, Y.; Environ. Atmospheric Environmen., 2009, 43, 2229-2246.
CrossRef - Yu, H.; Zhang, K.; Rossi, C.; Journal of photochemistry and photobiology, A, Chemistry. 2007, 188, 65-73.
CrossRef - Congrong, H.; Morawska, L.; Wang, H.; Jayaraten, R.; McGarry, P.; Richard Johnson, G.; Bostrom, Th.; Gontheir, J.; Authemayou, S.; Journal of Aerosol Science. 2010, 41, 523-530.
CrossRef - Destaillats, H.; Maddalena, R. L.; Brett.Singer, C.; Hodgson, A. T.; McKone, Th. E.; Atmospheric Environment. 2008, 42, 1371–1388.
CrossRef - Larson, S. A.; Falconer, J. L.; Catalysis Letters. 1997, 44, 57-65.
CrossRef - Salthammer, T.; Schripp, T.; Uhde, E.; Wensing, M.; Environmental Pollution.2012, 169, 167-174.
CrossRef - Barthel, M.; Pedan, V.; Hahn, O.; Rothhardt, M.; Bresch, H.; Jann, O.; Seeger, S.; American Chemical Society. 2011, 45, 7819-7825.
- He, O.; Morawska, L.; Taplin, L.; Environ.Sci.Technol. 2007, 41, 6039-6045.
CrossRef - Liu, S.X.; Qu, Z.P.; Han, X.W.; Sun, C.L.; Catal. Today. 2004, 93, 877–884.
CrossRef - ISO 16000-9, Determination of the emission of volatile organic compounds from building products and furnishing, Emission test chamber method, First Edition, 2006.
- ENCA, Determination of Chemical Emission Rates from Electronic Equipment 6th Edition, December 2013.
- Wensing, M.; Schripp, T.; Uhde, E.; Salthammer, T.; Science of the total environment. 2008, 407, 418-427.
CrossRef - Al Jallad, F.; Al Karheeri, E.; Al Omar, M.; Sustain. Environ. Res. 2013, 23, 191-198.
- Mullins, B. J.; Bertolatti, D.; Mead-Hunter, R.; Atmospheric Environment. 2013, 79, 428-432.
CrossRef - Erdogan, S.; Baysal, A.; Akbar, O.; Merdivan, M.; Hamamci, C.; Asian Journal of Chemistry. 2007, 19, 1703-1708.
- Vijay Bhaskar, B.; Mehta, V. M.; Aerosol and air quality research. 2010, 10, 301-315.
CrossRef - Tai, A.P.K.; Mickley, L. J.; Jacob, D. J,; Atmospheric Environment. 2010, 44, 3976-3984.
CrossRef - Jayaratne, E.R.; Ling, X.; He, C.; Morawska, L.; Journal of electrostatics. 2012,70, 333-338.
CrossRef

This work is licensed under a Creative Commons Attribution 4.0 International License.
![]()
A New Edition of Web of Science
Journal Impact Factor
2022: 0.5
Five Year: 0.8
Journal is Indexed in

Cabells Whitelist
![]()


